. 2024 Aug 29;14(1):20096.
doi: 10.1038/s41598-024-70851-3.

Hydro-chemical characterization and irrigation suitability assessment of a tropical decaying river in India

Affiliations

Hydro-chemical characterization and irrigation suitability assessment of a tropical decaying river in India

Aznarul Islam et al. Sci Rep. .

Abstract

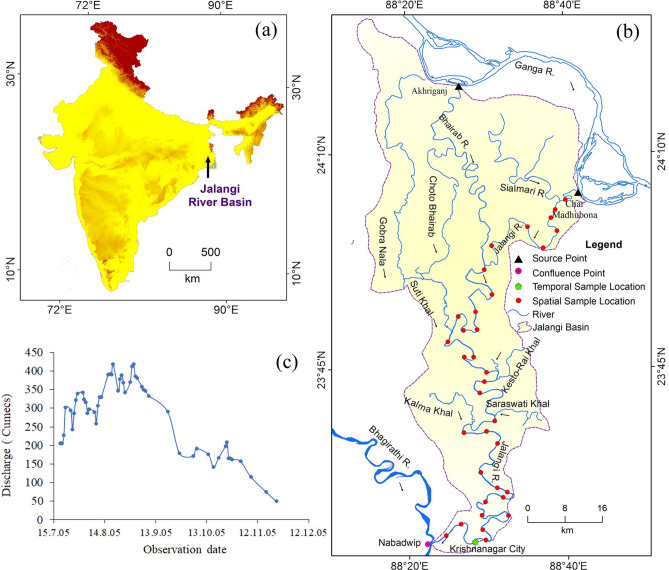
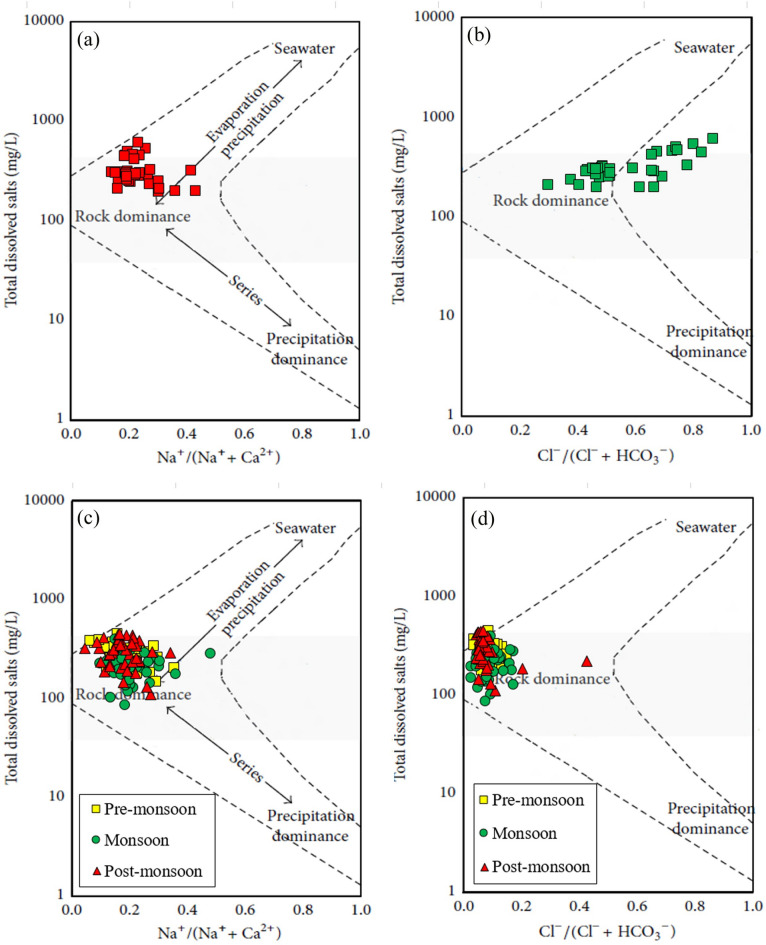
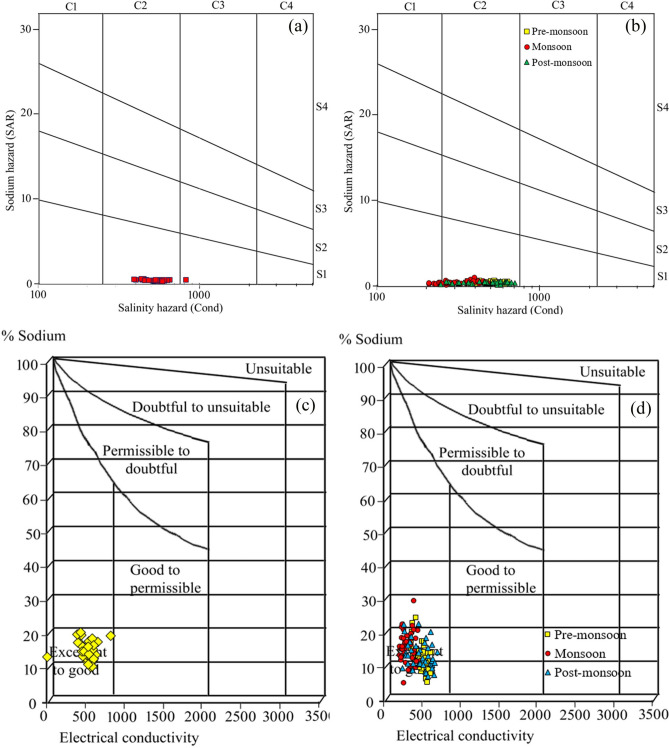
Water pollution is a major concern for a decaying river. Polluted water reduces ecosystem services and human use of rivers. Therefore, the present study aims to assess the irrigation suitability of the Jalangi River water. A total of 34 pre-selected water samples were gathered from the source to the sink of the Jalangi River with an interval of 10 km and one secondary station's data from February 2012 to January 2022 were used for this purpose. The Piper diagram exhibits that the Jalangi River water is Na+-HCO3- types, and the alkaline earth (Ca2+ + Mg2+) outperforms alkalises (Na+ + K+) and weak acids (HCO3- + CO32-) outperform strong acids (Cl- + SO42-). SAR values ranging from 0.35 to 0.64 show that water is suitable for irrigation and poses no sodicity risks. The %Na results show that 91.18% of water samples are good and acceptable for irrigation. RSC levels indicate a significant alkalinity hazard, with 94.12% of samples considered inappropriate for irrigation. PI findings show that 91.18% of water samples are suitable for irrigation. Apart from the spatial water samples, seasonal water samples exhibit a wide variations as per the nature of irrigation hazards. Gibbs plot demonstrates that the weathering of rocks determined the hydro-chemical evolution of Jalangi River water. This study identifies very little evaporation dominance for pre- and post-monsoon water. The analysis of variance (ANOVA) test illustrates that there are no spatial variations in water quality while seasonal variations are widely noted (p < 0.05). The results also revealed that river water for irrigation during monsoon is suitable compared to the pre-monsoon season. Anthropogenic interventions including riverbed agriculture, and the discharge of untreated sewage from urban areas are playing a crucial role in deteriorating the water quality of the river, which needs substantial attention from the various stakeholders in a participatory, and sustainable manner.

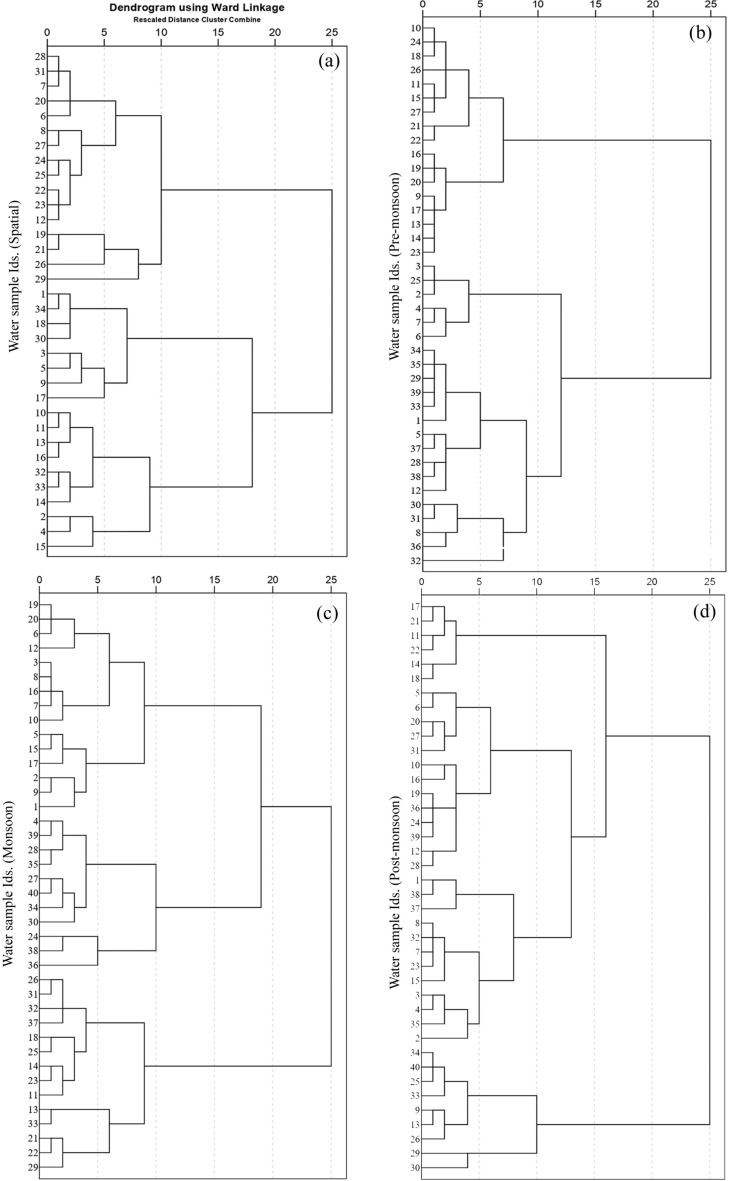
Keywords: Hierarchical cluster analysis; Irrigation hazards; Jalangi River; Monsoonal variation; Principal component analysis; River decay; Saturation index.


Conflict of interest statement

The authors declare no competing interests.

Figures

Fig. 1
Fig. 1
Locational attributes of the Jalangi River, (a) Jalangi River basin in eastern India, (b) Jalangi River systems and location of the water samples, (c) discharge hydrograph of Jalangi River at Swarupganj (note: spatial sample locations are placed from source to mouth i.e. the uppermost location is S1 and the lowermost point near Nabadwip is S34) (source: prepared by the authors using ArcGIS (version 10.4), Microsoft Office Excel (version 2010) and Adobe Photoshop (version 7.0).
Fig. 2
Fig. 2
Distributional nature of the major ionic chemistry, (a) spatial variations (N = 34) and (b) seasonal variations (N = 39 for pre-monsoon, 40 each for monsoon and post-monsoon) (note: the variables are explained in Sect “Methodology”. PO for PO43−, F for F, NO for NO3, pH for potential of hydrogen, K for K+, BOD for biological oxygen demand, DO  for dissolved oxygen, Cl for Cl, SO for SO42−, Na for Na+, COD for chemical oxygen demand, TB for turbidity, Mg for Mg2+, TSS for total suspended solids, Ca for Ca2+, CaCO for CaCO3, TDS for total dissolved solids, TA for total alkalinity, EC for electrical conductivity.
Fig. 3
Fig. 3
Hydro-chemical classifications of water sample as per the Piper trilinear diagram, (a) spatial dynamics, (b) seasonal dynamics.
Fig. 4
Fig. 4
Gibbs plot for anion and cation (a) cations (spatial dynamics), (b) anions (spatial dynamics), (c) cations (seasonal dynamics), (d) anion (seasonal dynamics) (note: 34 samples for spatial variations and seasonal variations (N = 39 for pre-monsoon, 40 each for monsoon and post-monsoon; the variables are explained in Sect “Methodology”).
Fig. 5
Fig. 5
Water suitability for irrigation, (a)  United States (U.S) Salinity Laboratory diagram (spatial dynamics), (b) U.S Salinity Laboratory diagram (seasonal dynamics), (c) Wilcox diagram (spatial dynamics), (d) Wilcox diagram (seasonal dynamics) (note: total samples (N = 34) for spatial variations and seasonal variations (N = 39 for pre-monsoon, 40 each for monsoon and post-monsoon).
Fig. 6
Fig. 6
Box plots showing the (a) spatial (b) seasonal variations in water quality indices (note: the variables such as SAR, PS, %Na, RSC, MH, and PI are explained in Sect “Methodology”.
Fig. 7
Fig. 7
Spatio-temporal variation of the irrigation hazards, (a) variation from the source to the mouth of the Jalangi River, (b) pre-monsoon variation, (c) monsoon variation, (d) post-monsoon variation (notes: 7b–d share the same legend as 7a; the trendlines are the best-fit lines; the irrigation hazard indices are explained in Sect “Methodology”).
Fig. 8
Fig. 8
Dendrogram using hierarchical cluster analysis of Jalangi River water quality parameters (a) spatial, (b) pre-monsoon variation, (c) monsoon variation, (d) post-monsoon variation.
Fig. 9
Fig. 9
Decay of Jalangi River through historical time (a) Jalangi River in 1840’s scenario in Tassin’s map (based on Das) (b) index map of the Ganga–Bhairab offtake, Ganga–Jalangi offtake, and Jalangi–Bhairab confluence (Sentinel 2A tiles number T45QXG dated 15 Nov 2020), (ce) represent the evolution of Ganga–Bhaibrab offtake in 1973 (Landsat 1 multi-spectral scanner (MSS), path 149, row 43 dated 17 Jan 1973), 2000 (Landsat 7 enhanced thematic mapper plus (ETM +), path 138, row 43 dated 17 Nov 2000) and 2020 (same as 9b), (fh) show evolution of the Ganga–Jalangi offtake in 1973 (same as 9c), 2000 (same as 9d) and 2020 (same as 9b); (ik) depict Jalangi–Bhairab confluence in 1968 (Corona Satellite KH-4A 45, Entity ID DS1045-2196DF120 dated 06 Feb 1968), 2000 (Landsat 5 thematic mapper (TM), path 138, row 43 dated 08 Oct 2000) and 2020 (same as 9b) (source: prepared by the authors based on using ArcGIS (version 10.4), and Adobe Photoshop (version 7.0).

References

    1. Mahammad, S. & Islam, A. Surface water quality assessment for drinking and irrigation using DEMATEL, entropy-based models and irrigation hazard indices. Environ. Earth Sci.83(10), 332. 10.1007/s12665-024-11633-y (2024). 10.1007/s12665-024-11633-y - DOI
    1. Hoque, M. M. & Islam, A. Spatio-temporal dynamics of ecological, bacteriological, and overall water quality of the Damodar River, India. Environ. Sci. Pollut. Res.31, 18465–18484. 10.1007/s11356-024-32185-5 (2024). 10.1007/s11356-024-32185-5 - DOI - PubMed
    1. Putri, R. F. et al. The impact of population pressure on agricultural land towards food sufficiency (Case in West Kalimantan Province, Indonesia). In IOP Conference Series: Earth and Environmental Science 012050 (IOP Publishing, 2019).
    1. Angelakιs, A. N. et al. Irrigation of world agricultural lands: Evolution through the millennia. Water12(5), 1285. 10.3390/w12051285 (2020). 10.3390/w12051285 - DOI
    1. Singh N, Singh OP. Green revolution in India and its impact on water resources. Millennium water story. https://millenniumwaterstory.org/Pages/Photostories/Water-and-Livelihood.... Accessed on 15 May 2024. (2021).

LinkOut - more resources