

Analysis of oceanic suspended particulate matter in the western North Pacific using the complex amplitude sensor
- PMID: 39210010
- PMCID: PMC11362335
- DOI: 10.1038/s41598-024-70683-1
Analysis of oceanic suspended particulate matter in the western North Pacific using the complex amplitude sensor
Abstract
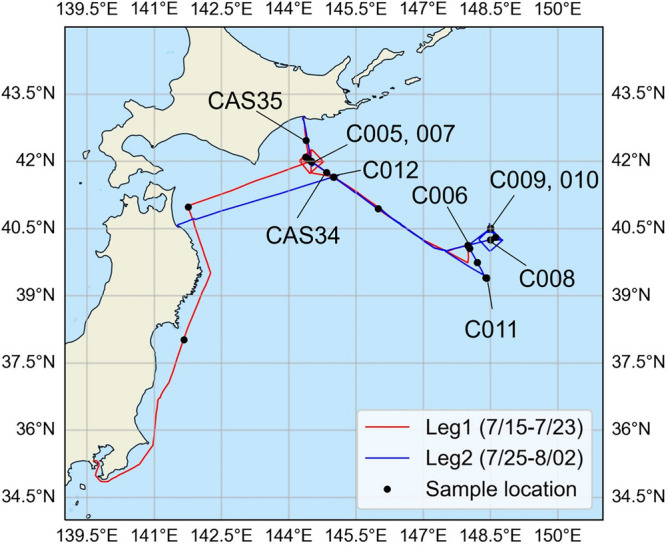
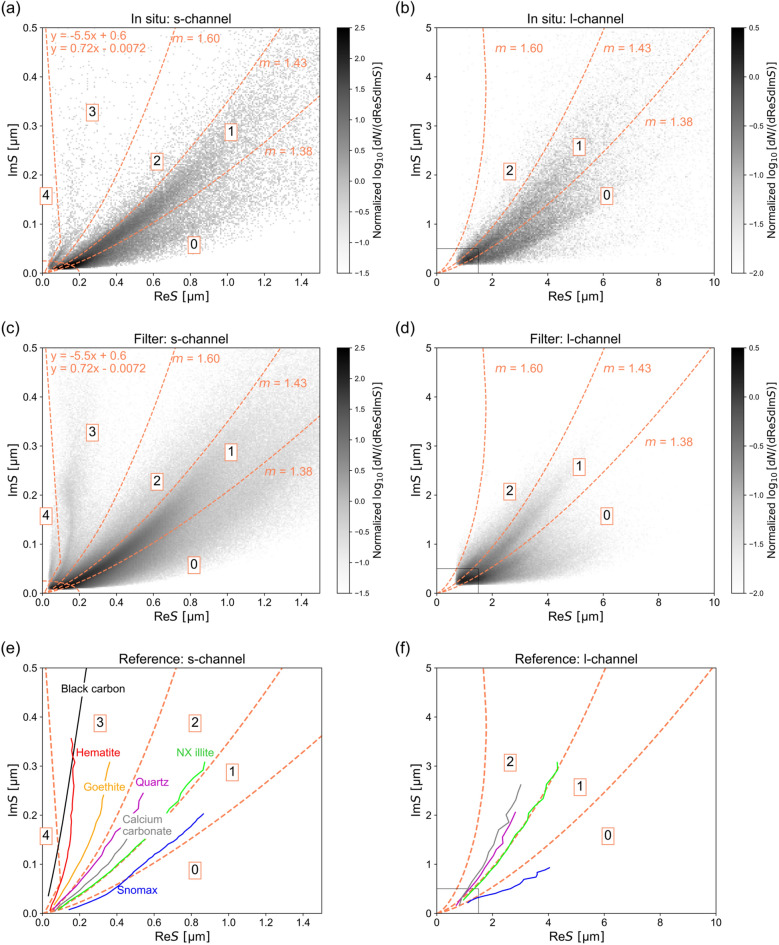
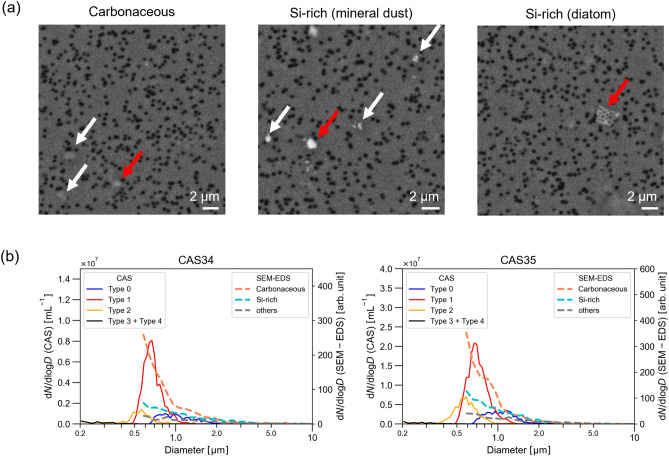
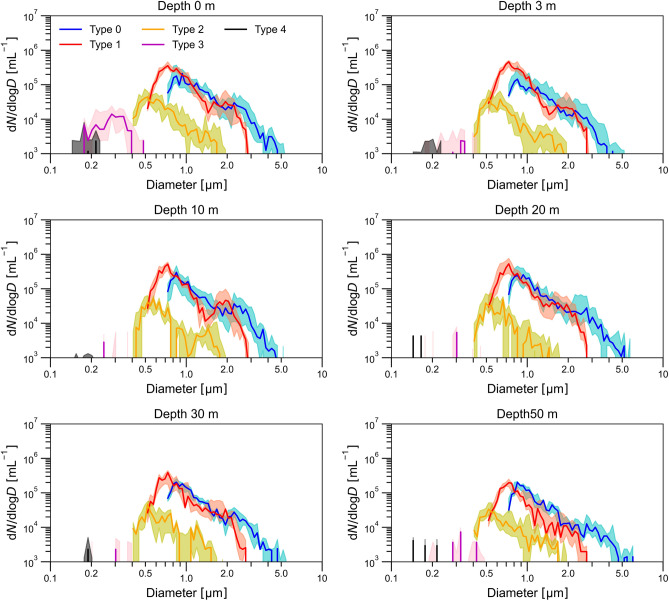
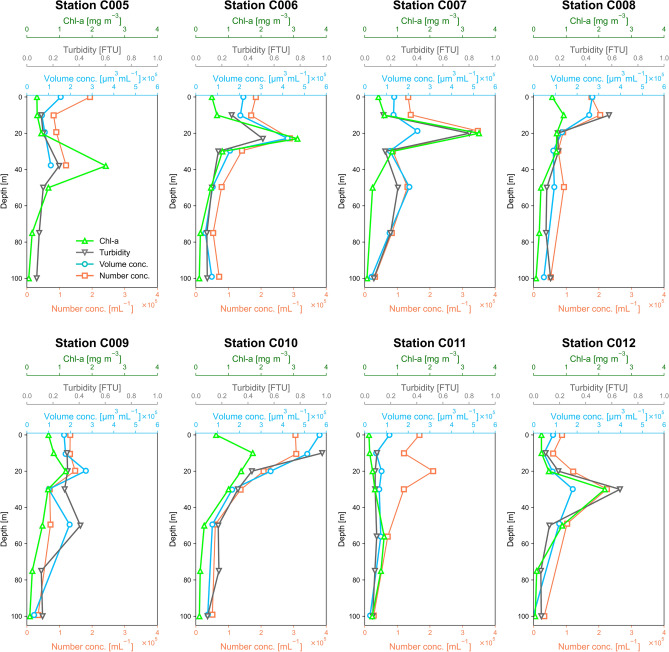
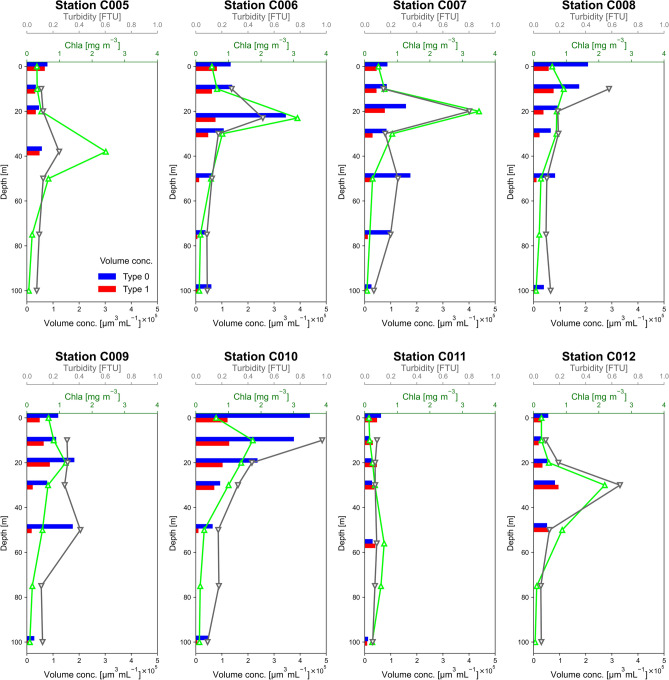
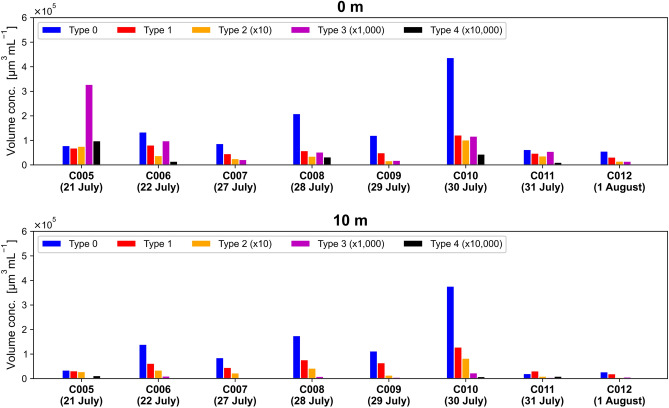
Oceanic suspended particulate matter (SPM) plays important roles in the coupling of climate and biogeochemical cycles via ocean-atmosphere interactions. However, methods for quantifying the properties of SPM in seawater have not yet been well established. Here we present the application of the recently developed complex amplitude sensor (CAS) for analyzing the complex forward-scattering amplitude of individual SPM (0.2-5.0 µm in diameter) obtained at depths of 0-100 m during a research cruise in the western North Pacific. The measured distribution of the complex amplitude indicated that the CAS-derived SPM data could be roughly classified into five major types. Comparison with reference sample's complex amplitude data and scanning electron microscopy analysis suggested that these types could be attributed mainly to diatom fragments, carbonaceous materials (likely organic matter), mineral dusts, iron oxides, or black carbon. Depth profiles revealed that relatively high concentrations of SPM, presumably dominated by diatom fragments and carbonaceous materials with peak diameters of 0.7-1.0 µm, were typically associated with elevated turbidities and chlorophyll a concentrations. Based on this case study, we discuss the practical advantages and limitations of using the CAS to measure size-resolved concentrations of SPM in seawater and to characterize its composition.
© 2024. The Author(s).
Conflict of interest statement
The authors declare no competing interests.
Figures
Similar articles
-
Composition and sources of suspended particles in the Pacific Arctic region.Mar Environ Res. 2023 Oct;191:106127. doi: 10.1016/j.marenvres.2023.106127. Epub 2023 Aug 9. Mar Environ Res. 2023. PMID: 37573738
-
The biogeochemical reactivity of suspended particulate matter at nested sites in the Dee basin, NE Scotland.Sci Total Environ. 2012 Sep 15;434:159-70. doi: 10.1016/j.scitotenv.2011.08.048. Epub 2011 Sep 25. Sci Total Environ. 2012. PMID: 21945186
-
Heterotrophic bacterial production and extracellular enzymatic activity in sinking particulate matter in the western North Pacific Ocean.Front Microbiol. 2012 Oct 23;3:379. doi: 10.3389/fmicb.2012.00379. eCollection 2012. Front Microbiol. 2012. PMID: 23109933 Free PMC article.
-
Potential for nocturnal satellite detection of suspended matter concentrations in coastal waters using a panchromatic band: a feasibility study based on VIIRS (NASA/NOAA) spectral and radiometric specifications.Opt Express. 2020 May 11;28(10):15314-15330. doi: 10.1364/OE.393048. Opt Express. 2020. PMID: 32403562
-
Freshwater suspended particulate matter-Key components and processes in floc formation and dynamics.Water Res. 2022 Jul 15;220:118655. doi: 10.1016/j.watres.2022.118655. Epub 2022 May 24. Water Res. 2022. PMID: 35665676 Review.
References
-
- Iwamoto, Y. & Uematsu, M. Spatial variation of biogenic and crustal elements in suspended particulate matter from surface waters of the North Pacific and its marginal seas. Prog. Oceanogr.126, 211–223 (2014). 10.1016/j.pocean.2014.04.019 - DOI
-
- Sigman, D. & Hain, M. The biological productivity of the ocean. Nat. Educ. Knowl.3, 21 (2012).
-
- Liu, Q., Kandasamy, S., Lin, B., Wang, H. & Chen, C.-T.A. Biogeochemical characteristics of suspended particulate matter in deep chlorophyll maximum layers in the southern East China Sea. Biogeosciences15, 2091–2109 (2018). 10.5194/bg-15-2091-2018 - DOI
Grants and funding
LinkOut - more resources
Full Text Sources
