

High throughput screening of airway constriction in mouse lung slices
- PMID: 39210022
- PMCID: PMC11362152
- DOI: 10.1038/s41598-024-71170-3
High throughput screening of airway constriction in mouse lung slices
Abstract
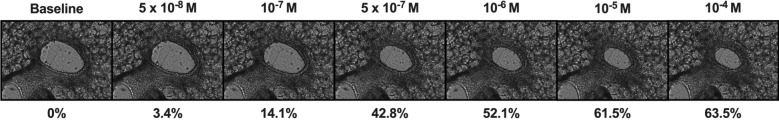
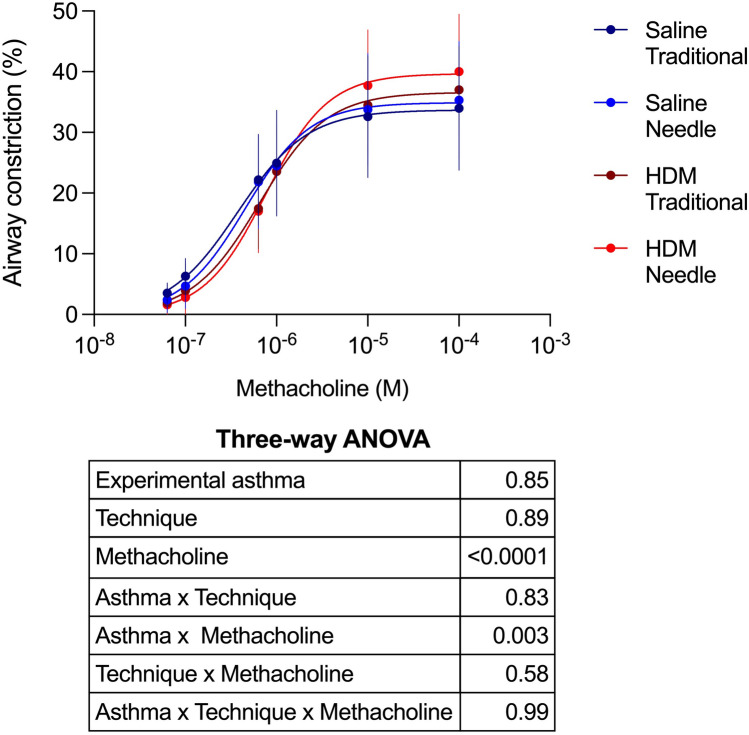
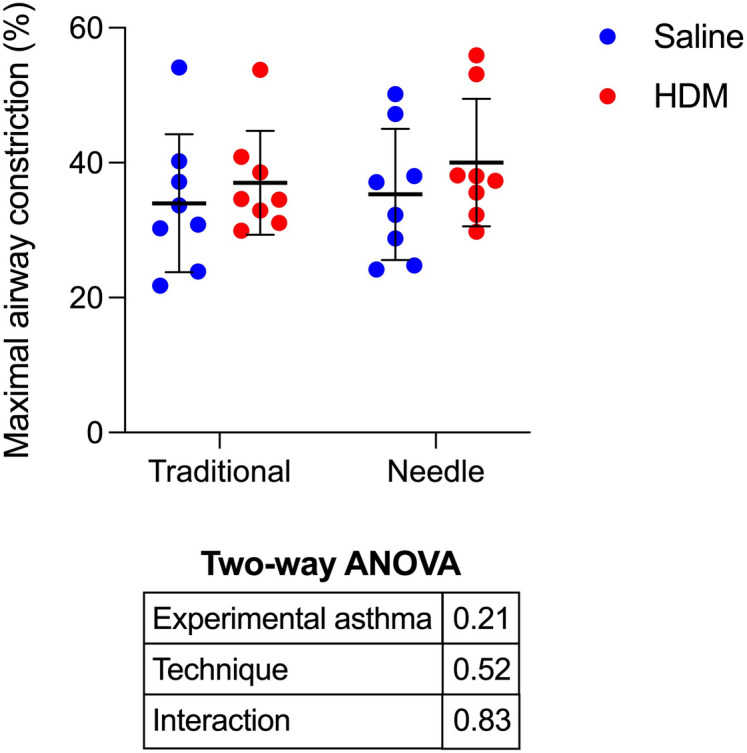
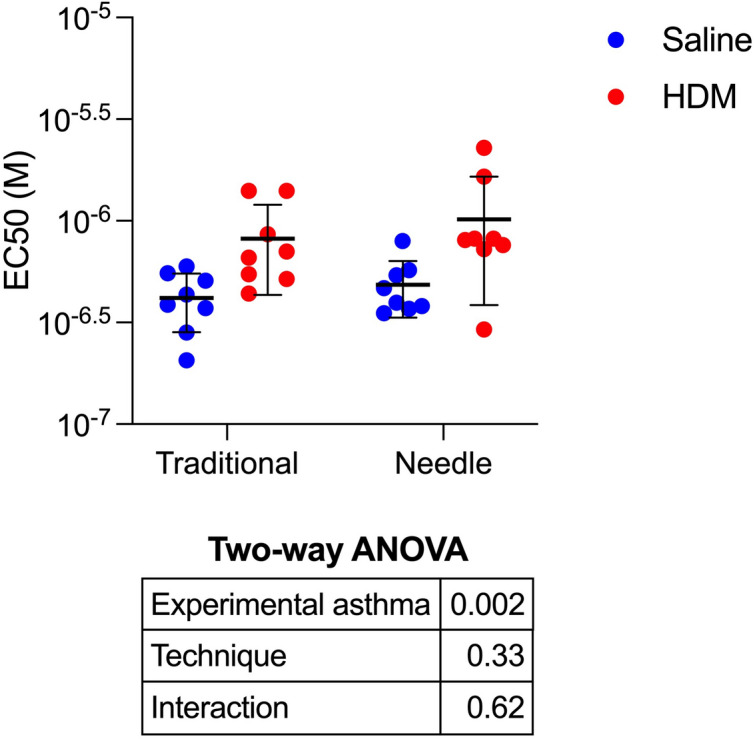
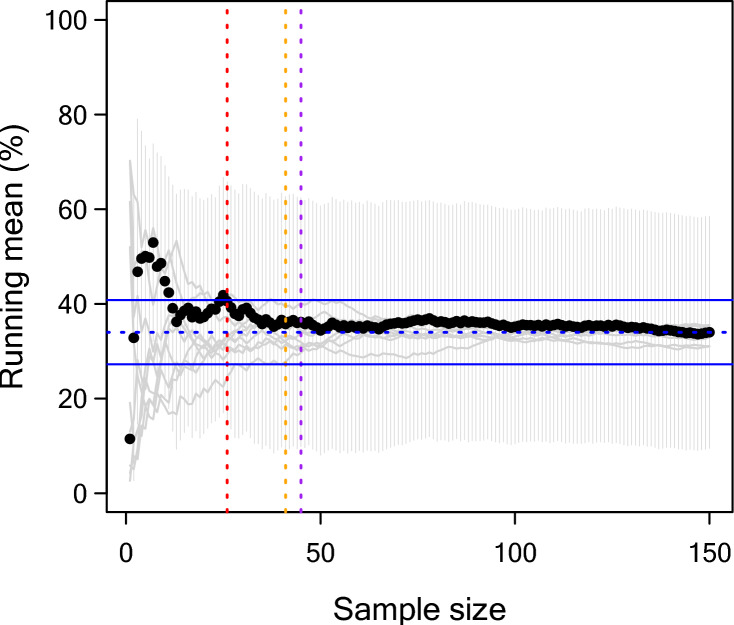
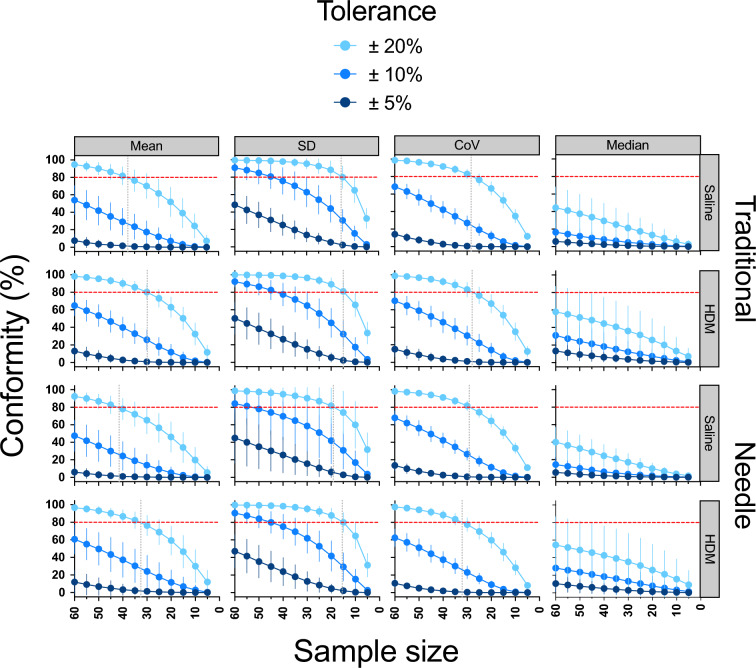
The level of airway constriction in thin slices of lung tissue is highly variable. Owing to the labor-intensive nature of these experiments, determining the number of airways to be analyzed in order to allocate a reliable value of constriction in one mouse is challenging. Herein, a new automated device for physiology and image analysis was used to facilitate high throughput screening of airway constriction in lung slices. Airway constriction was first quantified in slices of lungs from male BALB/c mice with and without experimental asthma that were inflated with agarose through the trachea or trans-parenchymal injections. Random sampling simulations were then conducted to determine the number of airways required per mouse to quantify maximal constriction. The constriction of 45 ± 12 airways per mouse in 32 mice were analyzed. Mean maximal constriction was 37.4 ± 32.0%. The agarose inflating technique did not affect the methacholine response. However, the methacholine constriction was affected by experimental asthma (p = 0.003), shifting the methacholine concentration-response curve to the right, indicating a decreased sensitivity. Simulations then predicted that approximately 35, 16 and 29 airways per mouse are needed to quantify the maximal constriction mean, standard deviation and coefficient of variation, respectively; these numbers varying between mice and with experimental asthma.
Keywords: Airway smooth muscle; Asthma; Contraction; Mouse models; Precision-cut lung slices (PCLS).
© 2024. The Author(s).
Conflict of interest statement
LF and PG are employed by SCIREQ Inc., a commercial entity with interests in topics related to the content of the present work. YB is holding an operating grant in partnership with SCIREQ Inc. MB, CH, LG, RP and ARR have no conflict of interest.
Figures
Similar articles
-
Rosiglitazone elicits in vitro relaxation in airways and precision cut lung slices from a mouse model of chronic allergic airways disease.Am J Physiol Lung Cell Mol Physiol. 2015 Nov 15;309(10):L1219-28. doi: 10.1152/ajplung.00156.2015. Epub 2015 Sep 18. Am J Physiol Lung Cell Mol Physiol. 2015. PMID: 26386117
-
[Standard technical specifications for methacholine chloride (Methacholine) bronchial challenge test (2023)].Zhonghua Jie He He Hu Xi Za Zhi. 2024 Feb 12;47(2):101-119. doi: 10.3760/cma.j.cn112147-20231019-00247. Zhonghua Jie He He Hu Xi Za Zhi. 2024. PMID: 38309959 Chinese.
-
Methacholine hyperresponsiveness in mice with house dust mite-induced lung inflammation is not associated with excessive airway constriction ex vivo.Exp Physiol. 2025 Mar 28. doi: 10.1113/EP092522. Online ahead of print. Exp Physiol. 2025. PMID: 40153804
-
[Mechanisms of non-specific airway hyperresponsiveness: Methacholine-induced alterations in airway architecture].Rev Mal Respir. 2016 Oct;33(8):735-743. doi: 10.1016/j.rmr.2015.10.742. Epub 2016 Feb 23. Rev Mal Respir. 2016. PMID: 26916468 Review. French.
-
Exploring lung physiology in health and disease with lung slices.Pulm Pharmacol Ther. 2011 Oct;24(5):452-65. doi: 10.1016/j.pupt.2011.05.001. Epub 2011 May 12. Pulm Pharmacol Ther. 2011. PMID: 21600999 Free PMC article. Review.
References
-
- Van Dijk, E. M., Culha, S., Menzen, M. H., Bidan, C. M. & Gosens, R. Elastase-induced parenchymal disruption and airway hyper responsiveness in mouse precision cut lung slices: Toward an ex vivo COPD model. Front. Physiol.7, 657. 10.3389/fphys.2016.00657 (2016). 10.3389/fphys.2016.00657 - DOI - PMC - PubMed
MeSH terms
Substances
Grants and funding
LinkOut - more resources
Full Text Sources
Medical
