. 2024 Aug 29;81(1):374.
doi: 10.1007/s00018-024-05417-7.

Functional determinants of lysophospholipid- and voltage-dependent regulation of TRPC5 channel

Affiliations

Functional determinants of lysophospholipid- and voltage-dependent regulation of TRPC5 channel

Alexandra Ptakova et al. Cell Mol Life Sci. .

Abstract

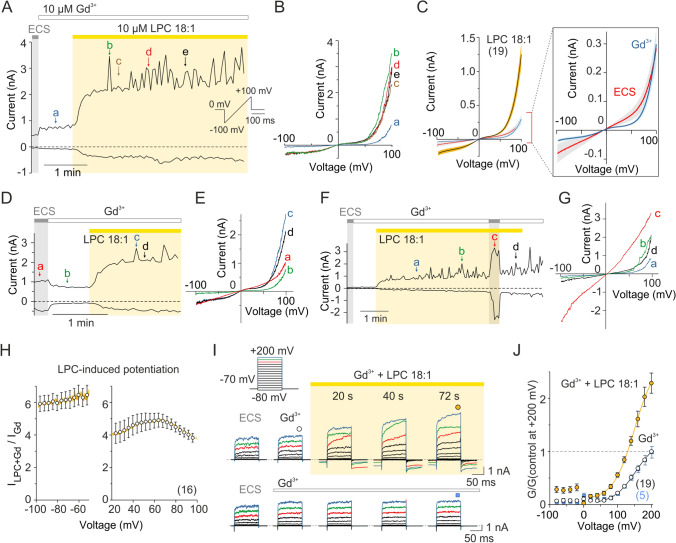
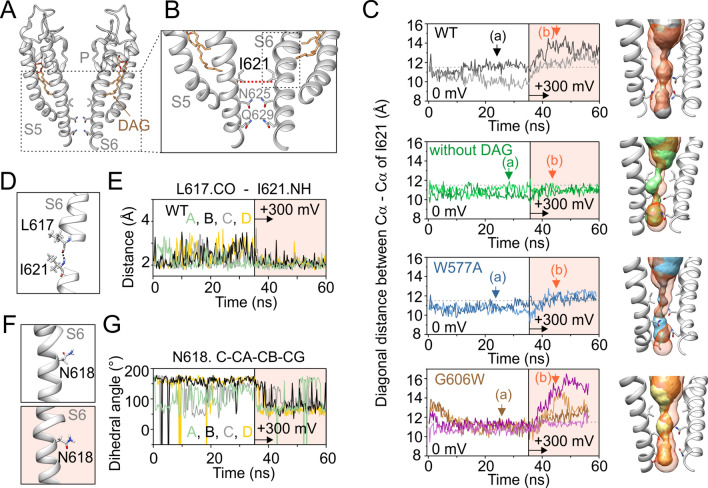
Lysophosphatidylcholine (LPC) is a bioactive lipid present at high concentrations in inflamed and injured tissues where it contributes to the initiation and maintenance of pain. One of its important molecular effectors is the transient receptor potential canonical 5 (TRPC5), but the explicit mechanism of the activation is unknown. Using electrophysiology, mutagenesis and molecular dynamics simulations, we show that LPC-induced activation of TRPC5 is modulated by xanthine ligands and depolarizing voltage, and involves conserved residues within the lateral fenestration of the pore domain. Replacement of W577 with alanine (W577A) rendered the channel insensitive to strong depolarizing voltage, but LPC still activated this mutant at highly depolarizing potentials. Substitution of G606 located directly opposite position 577 with tryptophan rescued the sensitivity of W577A to depolarization. Molecular simulations showed that depolarization widens the lower gate of the channel and this conformational change is prevented by the W577A mutation or removal of resident lipids. We propose a gating scheme in which depolarizing voltage and lipid-pore helix interactions act together to promote TRPC5 channel opening.

Keywords: Lysophosphatidylcholine; Pain; TRP channels; TRPC channels; Voltage-dependent gating.


Conflict of interest statement

The authors declare that they have no conflict of interest.

Figures

Fig. 1
Fig. 1
Lysophosphatidylcholine 18:1 activates human TRPC5 in HEK293T cells and modulates voltage-dependent gating. A Representative whole-cell currents recorded from a TRPC5-expressing HEK293T cell in extracellular control solution (ECS) not containing and then containing Gd3+ (10 µM), followed by the addition of 10 µM LPC (LPC 18:1). A ramp pulse from − 100 mV to + 100 mV from a holding potential of 0 mV was periodically applied every 3 s for 500 ms (inset). Amplitudes were measured at − 100 mV and + 100 mV and plotted as a function of time. B The current–voltage relations at the time points indicated by the letters in panel A. C Mean current–voltage relations averaged over ~ 1 min of steady-state LPC application (mean as solid lines, ± SEM as lighter-colored envelopes; n = 19) plotted for the currents recorded as shown in A. Right, zoomed view of the effect of 10 µM Gd3+ (blue line; ± SEM as light-blue envelopes; n = 19) on endogenous voltage-induced currents measured in extracellular control solution (ECS; red line; ± SEM as light-gray envelopes). The amplitudes of currents measured in the absence of Gd3+ at − 100 mV (− 87 ± 27 pA) and + 100 mV (283 ± 62 pA) were not significantly different from the current amplitudes measured in the presence of Gd3+ (− 49 ± 15 pA and 298 ± 58 pA; P = 0.863 and P = 0.238; n = 19; paired t test). D, F Representative whole-cell currents recorded from a TRPC5-expressing HEK293T cell in ECS not containing and then containing 10 µM Gd3+, followed by the addition of 10 µM LPC. A ramp pulse protocol was used as in panel A. Amplitudes were measured at − 100 mV and + 100 mV and plotted as a function of time. E, G The current–voltage relations at the time points indicated by the letters in panels D and F. H Average increase in voltage-dependent currents induced by LPC using a voltage protocol as in A. At a membrane potential of − 80 mV, the currents were potentiated 6.0 ± 0.5-fold by LPC, but only 4.5 ± 0.3-fold at + 80 mV (n = 16). I Representative current traces in response to a 100-ms voltage step family from − 80 to + 200 mV (20 mV step; inset) recorded from TRPC5-expressing cells. The currents were recorded in control solution ~ 1 min after whole-cell formation, after 30–40 s of exposure to 10 μM Gd3+, and after 1–2 min of exposure to LPC (upper traces) or 10 µM Gd3+, as a control (lower traces). Steady-state currents were measured at the end of the pulses as indicated by colored symbols atop the records. Note the fluctuations at higher (≥ 160 mV) potentials indicated by colored traces in LPC treated cells. J The average conductance-voltage plots normalized to the maximum response to + 200 mV obtained in extracellular control solution containing Gd3+. The data were fitted by Boltzmann equation over the interval + 40 mV to + 200 mV; solid lines). Number of biological replicates is indicated in parentheses (n = 19 for cells exposed to LPC; empty circles, black errors bars are smaller than the symbols for most of the data points, and n = 5 for cells treated with Gd3+ without LPC; blue squares and error bars). Data are mean ± SEM
Fig. 2
Fig. 2
LPC-induced responses are blocked by Pico145 and modulated by (-)-englerin A. A Representative recording from a TRPC5-expressing HEK293T cell exposed to LPC (LPC 18:1; 10 µM) in extracellular control solution containing Gd3+ (10 µM; the beginning of exposure is indicated by vertical arrow), followed by 100 nM Pico145. A ramp pulse protocol as shown in Fig. 1A was applied. Amplitudes were measured at − 100 mV and + 100 mV and plotted as a function of time. B The current–voltage relations at the time points indicated by the colored letters in panel A. For c and b, note the fluctuations above + 40 mV. C Representative time course of TRPC5-mediated LPC-evoked current inhibition induced by 100 nM Pico145 measured at − 90 mV. D Statistics of the Pico145-induced inhibition of LPC responses in seven TRPC5-expressing cells measured at − 90 mV as shown in C. Student's paired t test (*P < 0.05). E (−)-englerin A (EA; 30 nM) induces robust currents in the presence of LPC and suppresses current fluctuations at the depolarizing potential during long-term application. F The current–voltage relations at the time points indicated by the colored letters in panel E. G Representative time course of LPC-induced currents in the double mutant of TRPC5, in which the negatively charged residues involved in Ca2+ binding localized in the intracellular cavity of the sensor domain were neutralized (E418A /D439A). Similar observations were made for six other cells. H The current–voltage relations at the time points indicated by the colored letters in panel G
Fig. 3
Fig. 3
Activation of TRPC5 by LPC 18:1 involves the conserved glycine within the lipid-recognition window. A Detailed view of the lipid-recognition window (also termed L2 lipid-binding site) of human TRPC5 (PDB ID: 7E4T) with the residues mutated in this study indicated: W577 in the “LFW” motif inside the pore helix (P) and the directly opposite residue G606 in S6 are shown in stick representation. B Representative current traces in response to a voltage step protocol (from − 80 to + 200 mV; as shown in Fig. 1I) recorded from cells expressing wild-type (WT) or mutant TRPC5-channels as indicated above. The currents were recorded in the presence of 10 μM Gd3+. C The average current density–voltage plots for the indicated TRPC5 constructs. Steady-state currents were measured at the end of the pulses as indicated by colored symbols atop the records shown in B. The lines connecting average data points have no theoretical meaning. Number of biological replicates for each condition is indicated in parentheses. Data are mean ± SEM. D, E Representative current responses measured in the presence of (−)-englerin A (EA; 30 nM) and/or in the presence of LPC 18:1 (10 µM) in the W577A mutant channels. Ramp pulse protocols are indicated. Amplitudes measured at − 100 mV and + 100 mV were plotted as a function of time. Right, the current–voltage relations at the time points indicated by the colored letters in the left panels. F Representative current traces in response to a voltage step protocol from − 80 to + 200 mV (20 mV step) as shown in Fig. 1I, recorded from indicated TRPC5 constructs. The currents were recorded in extracellular solution containing 10 μM Gd3+  ~ 1 min after whole-cell formation (light gray traces), and after 1–2 min of exposure to LPC (black traces). G The average conductance-voltage plots, normalized to the maximum response at + 200 mV obtained in extracellular solution containing 10 µM Gd3+. Steady-state currents were measured at the end of the pulses as indicated by colored symbols atop the records shown in F. The black lines connecting average data points obtained in control solution containing Gd3+ (empty circles) have no theoretical meaning; the average data obtained in the presence of LPC 18:1 were fitted by Boltzmann equation (over the interval + 40 to + 200 mV; ochre lines). Number of biological replicates for each condition is indicated in parentheses. Data are mean ± SEM
Fig. 4
Fig. 4
The xanthine-binding pocket is involved in the LPC-induced activation of TRPC5. A, C Representative time course of currents induced by LPC 18:1 (10 µM) in the double mutant W577A/G606W TRPC5 channels recorded in the absence or presence of (−)-englerin A (EA; 30 nM). A ramp pulse protocol as shown in Fig. 1A. Amplitudes were measured at − 100 mV and + 100 mV and plotted as a function of time. B, D The current–voltage relations at the time points indicated by the colored letters in panel A and C. E Representative time course of currents measured in the presence of (−)-englerin A (EA; 30 nM) and LPC 18:1 (10 µM) in the triple mutant F576A/W577A/G606W channels. A ramp pulse protocol as shown in Fig. 1A was applied and amplitudes measured at − 100 mV and + 100 mV were plotted as a function of time. F The current–voltage relations at the time points indicated by the colored letters in panel E. G Average current traces in response to a voltage step protocol (from − 80 to + 200 mV; as shown in Fig. 1I) recorded from cells expressing W577A (n = 7), wild-type (WT; n = 20), F576A (n = 7), or triple mutant F576A/W577A/G606W (n = 8) TRPC5-channels as indicated. The currents were recorded in the presence of 10 μM Gd3+. H The average conductance-voltage plots from measurements as in E for indicated constructs obtained in extracellular control solution containing Gd3+. Steady-state currents were measured at the end of the pulses (indicated by circles above the records in G). Number of biological replicates for each condition is indicated in parentheses. Data are mean + SEM
Fig. 5
Fig. 5
Molecular dynamics simulations indicate that changes in the L2 lipid-binding site influence the lower gate of TRPC5 during depolarization. A Side view of the pore domain structure of two opposite subunits of human TRPC5 (PDB ID: 7E4T) with indicated residues forming the lower gate restriction (I621, N625, Q629). B Zoomed-in view of the lower pore region with the distance between the backbone Cα of two opposite residues I621 indicated. C Instantaneous distance measured diagonally between the backbone Cα of I621 in S6 of chains A and C (darker colored line), and chains B and D (lighter colored line), plotted as a function of simulation time for wild-type structure (7E4T), the structure without YZY lipid (DAG), and for the W577A and G606W mutants. Two independent simulations are shown for G606W. The colored (light orange) area indicates the time when depolarization at + 300 mV was applied. The horizontal dashed line denotes the diagonal distance between the backbone Cα of isoleucines 621 measured from the initial structure (11.51 Å). Right, side view of the profiles of the pore domain of two diagonally-arranged subunits of the respective constructs shown left with indicated residues in the lower gate I621, N625 and Q629. Instantaneous tunnels were calculated by Caver Analyst at points (a; colored) and (b; light orange) depicted by arrows in the plots on left. D Enlarged view of S6 with the hydrogen bond between the backbone CO group of L617 and NH group of I621 outlined. E Distance between the backbone CO group of L617 and NH group of I621, plotted as a function of simulation time for the chains A, B, C and D of the wild-type structure (7E4T). The colored area indicates the time when depolarization at + 300 mV was applied. F Zoomed-in view of the side-chain orientation of the residue N618 at control condition (wild-type structure without applied depolarization voltage) and at + 300 mV (colored area). G Changes in the dihedral angle values for the side-chain of N618 (C-CA-CB-CG), plotted as a function of simulation time for the chains A, B, C and D of the wild-type structure (7E4T)

Similar articles

Cited by

References

    1. Ren J, Lin J, Yu L, Yan M (2022) Lysophosphatidylcholine: potential target for the treatment of chronic pain. Int J Mol Sci. 10.3390/ijms23158274 10.3390/ijms23158274 - DOI - PMC - PubMed
    1. Marra S, Ferru-Clement R, Breuil V, Delaunay A, Christin M, Friend V, Sebille S, Cognard C, Ferreira T, Roux C et al (2016) Non-acidic activation of pain-related Acid-Sensing Ion Channel 3 by lipids. EMBO J 35:414–428 10.15252/embj.201592335 - DOI - PMC - PubMed
    1. Maingret F, Patel AJ, Lesage F, Lazdunski M, Honore E (2000) Lysophospholipids open the two-pore domain mechano-gated K(+) channels TREK-1 and TRAAK. J Biol Chem 275:10128–10133. 10.1074/jbc.275.14.10128 10.1074/jbc.275.14.10128 - DOI - PubMed
    1. Andersson DA, Nash M, Bevan S (2007) Modulation of the cold-activated channel TRPM8 by lysophospholipids and polyunsaturated fatty acids. J Neurosci 27:3347–3355. 10.1523/JNEUROSCI.4846-06.2007 10.1523/JNEUROSCI.4846-06.2007 - DOI - PMC - PubMed
    1. Friston DA, Cuddihy J, Souza Luiz J, Truong AH, Ho L, Basra M, Santha P, Oszlacs O, de Sousa VJ, Marczylo T et al (2023) Elevated 18:0 lysophosphatidylcholine contributes to the development of pain in tissue injury. Pain 164:e103–e115. 10.1097/j.pain.0000000000002709 10.1097/j.pain.0000000000002709 - DOI - PMC - PubMed

MeSH terms

LinkOut - more resources