. 2024 Sep;56(9):1938-1952.
doi: 10.1038/s41588-024-01871-y. Epub 2024 Aug 29.

YY1-controlled regulatory connectivity and transcription are influenced by the cell cycle

Affiliations

YY1-controlled regulatory connectivity and transcription are influenced by the cell cycle

Jessica C Lam et al. Nat Genet. 2024 Sep.

Abstract

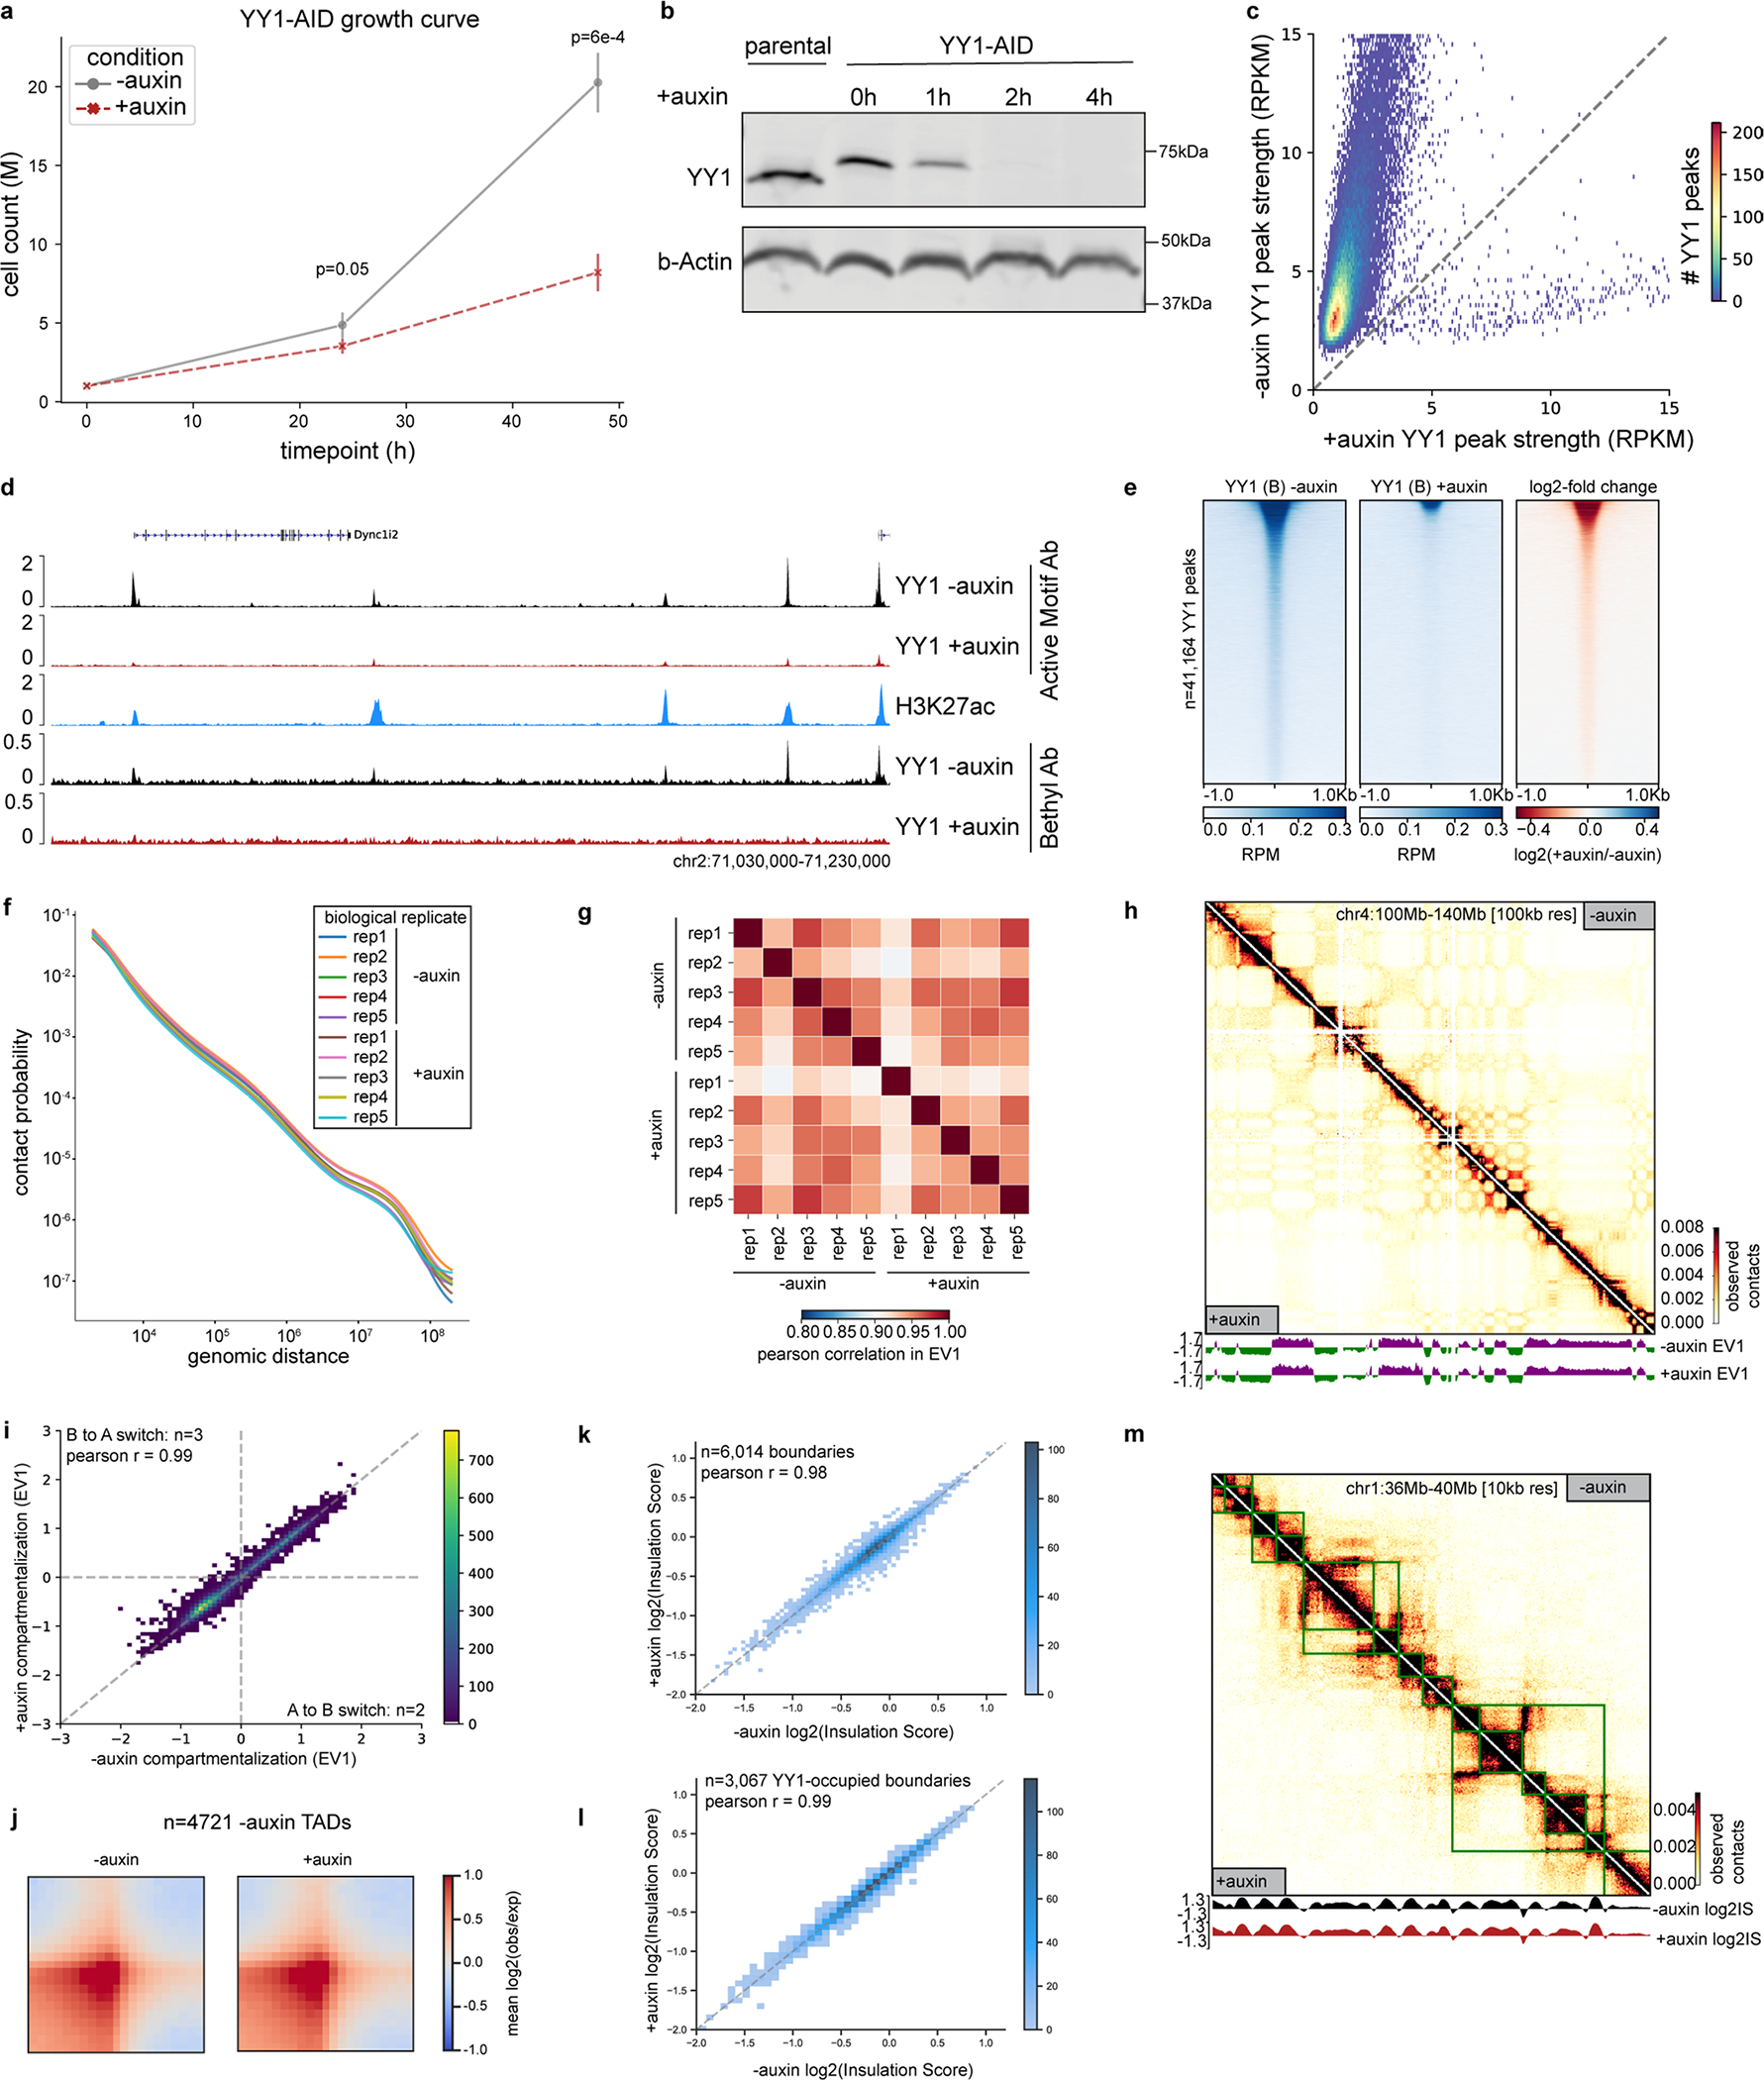
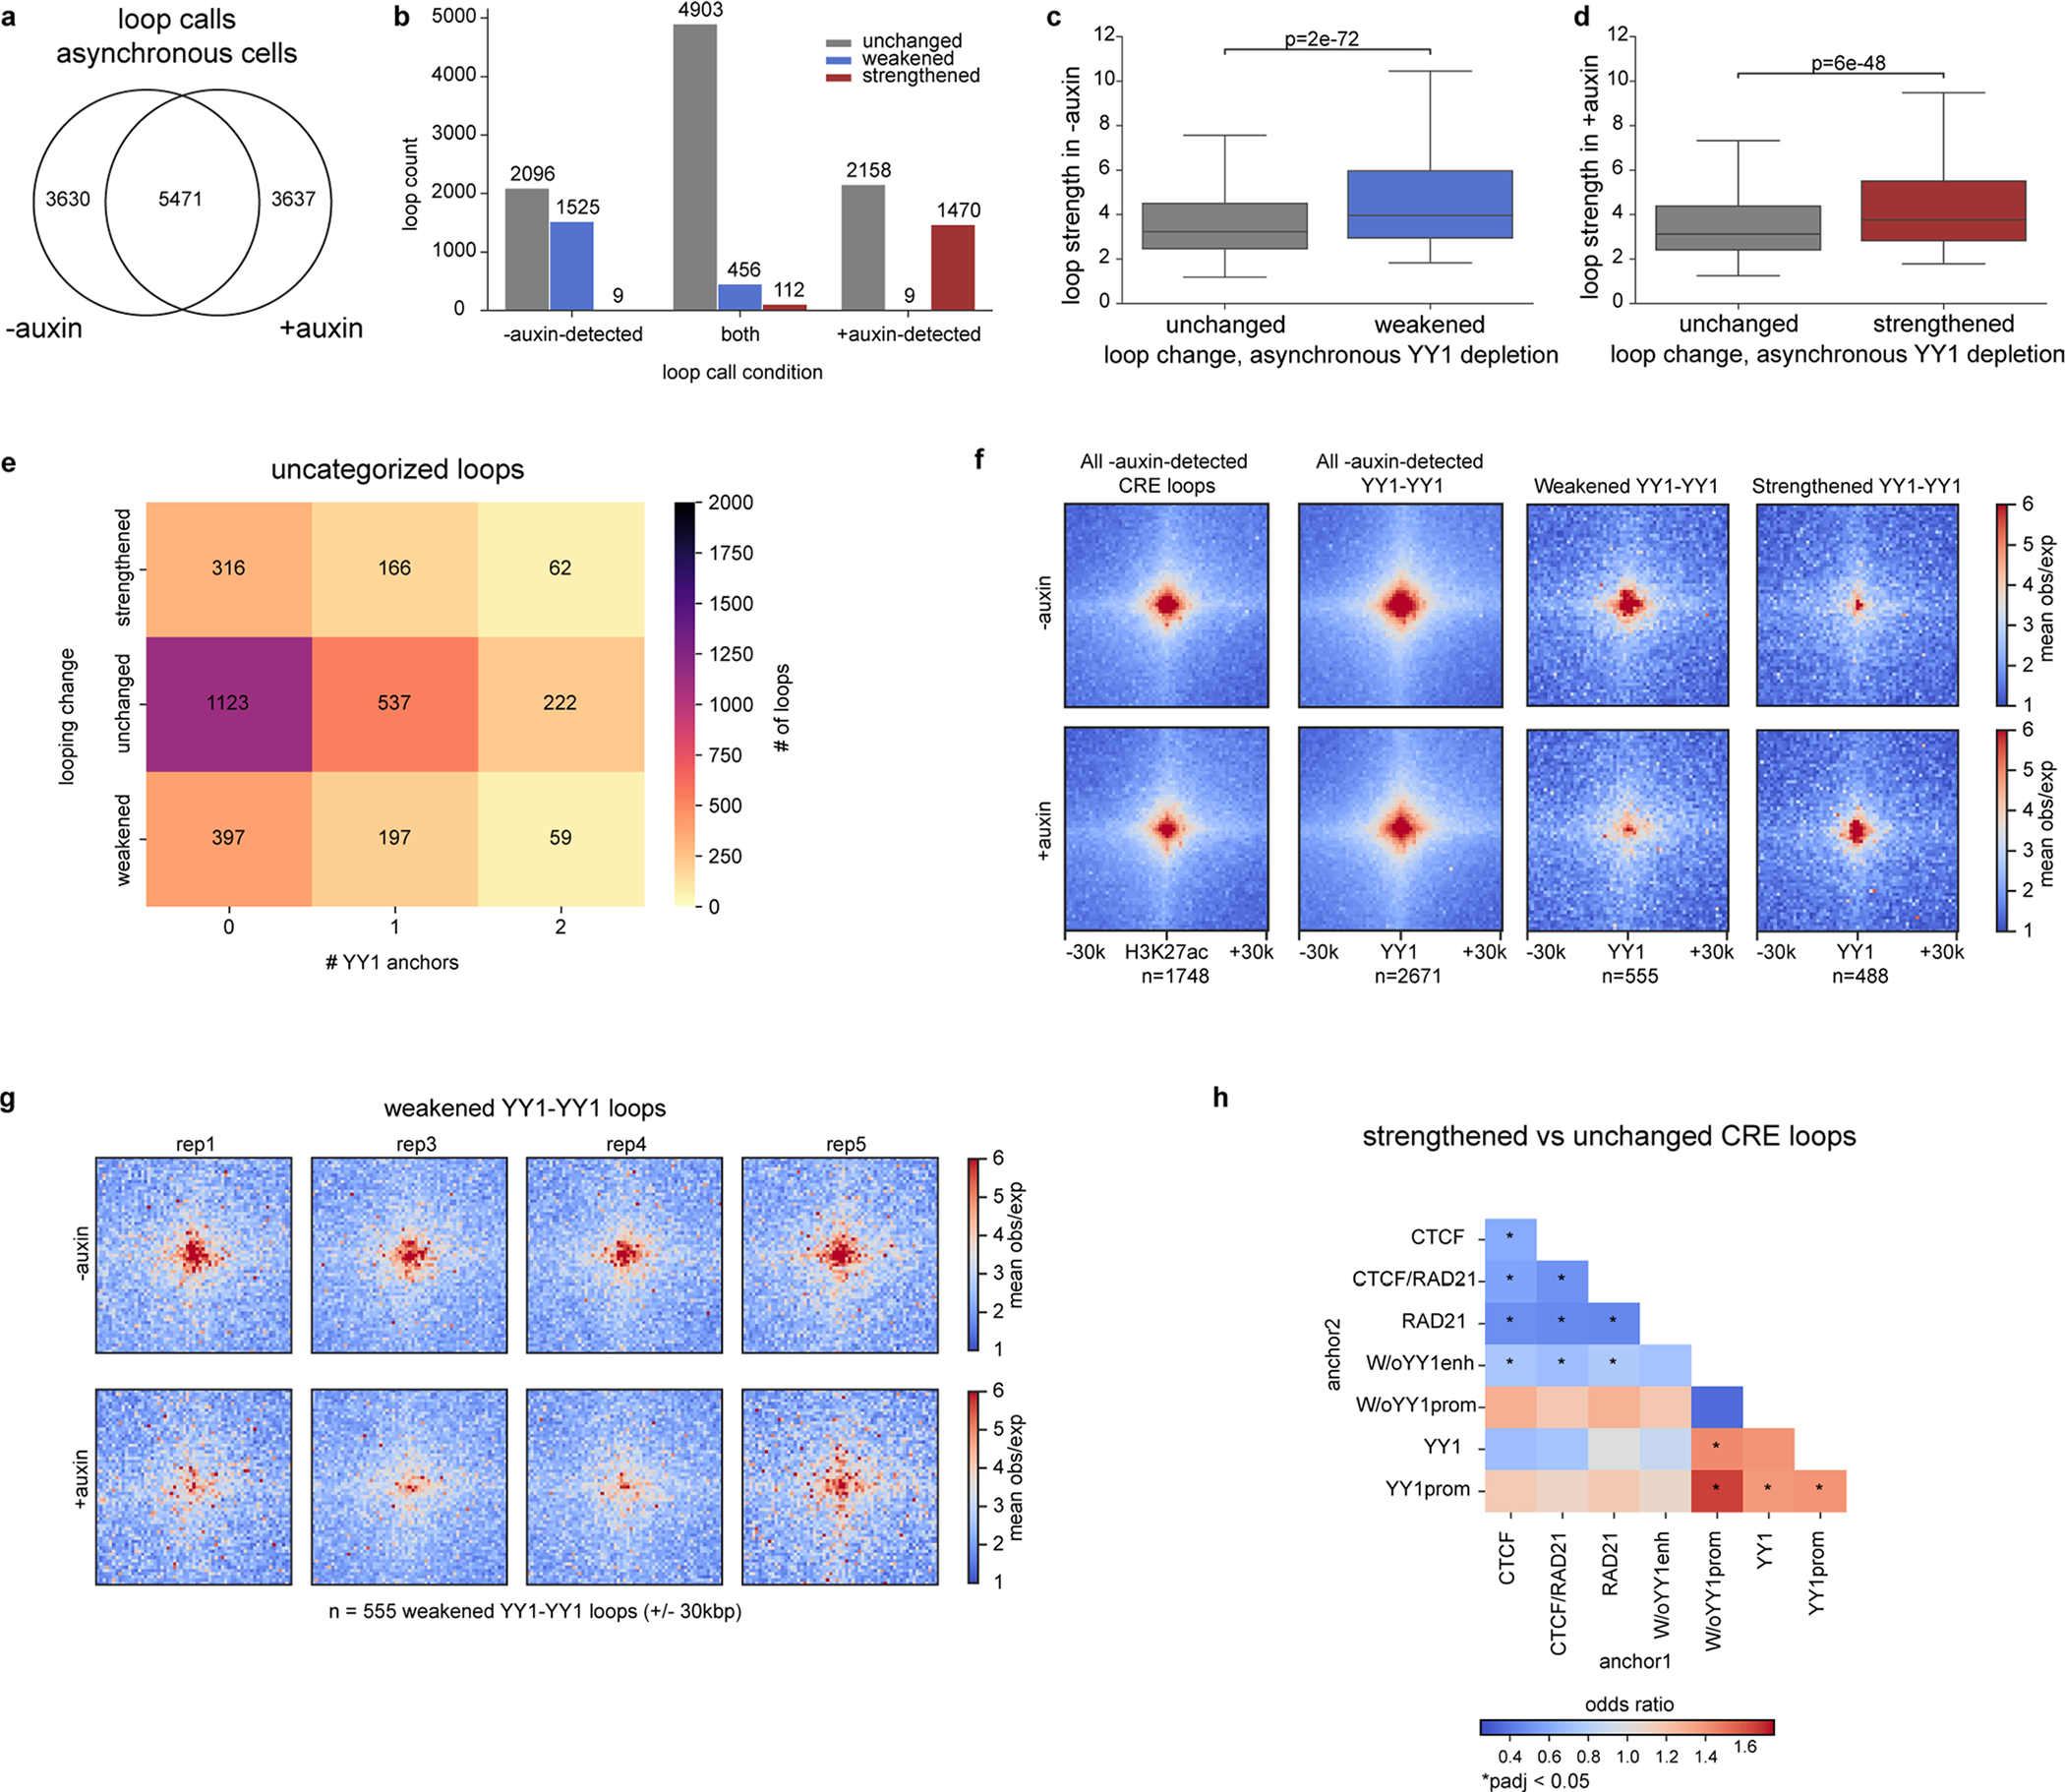
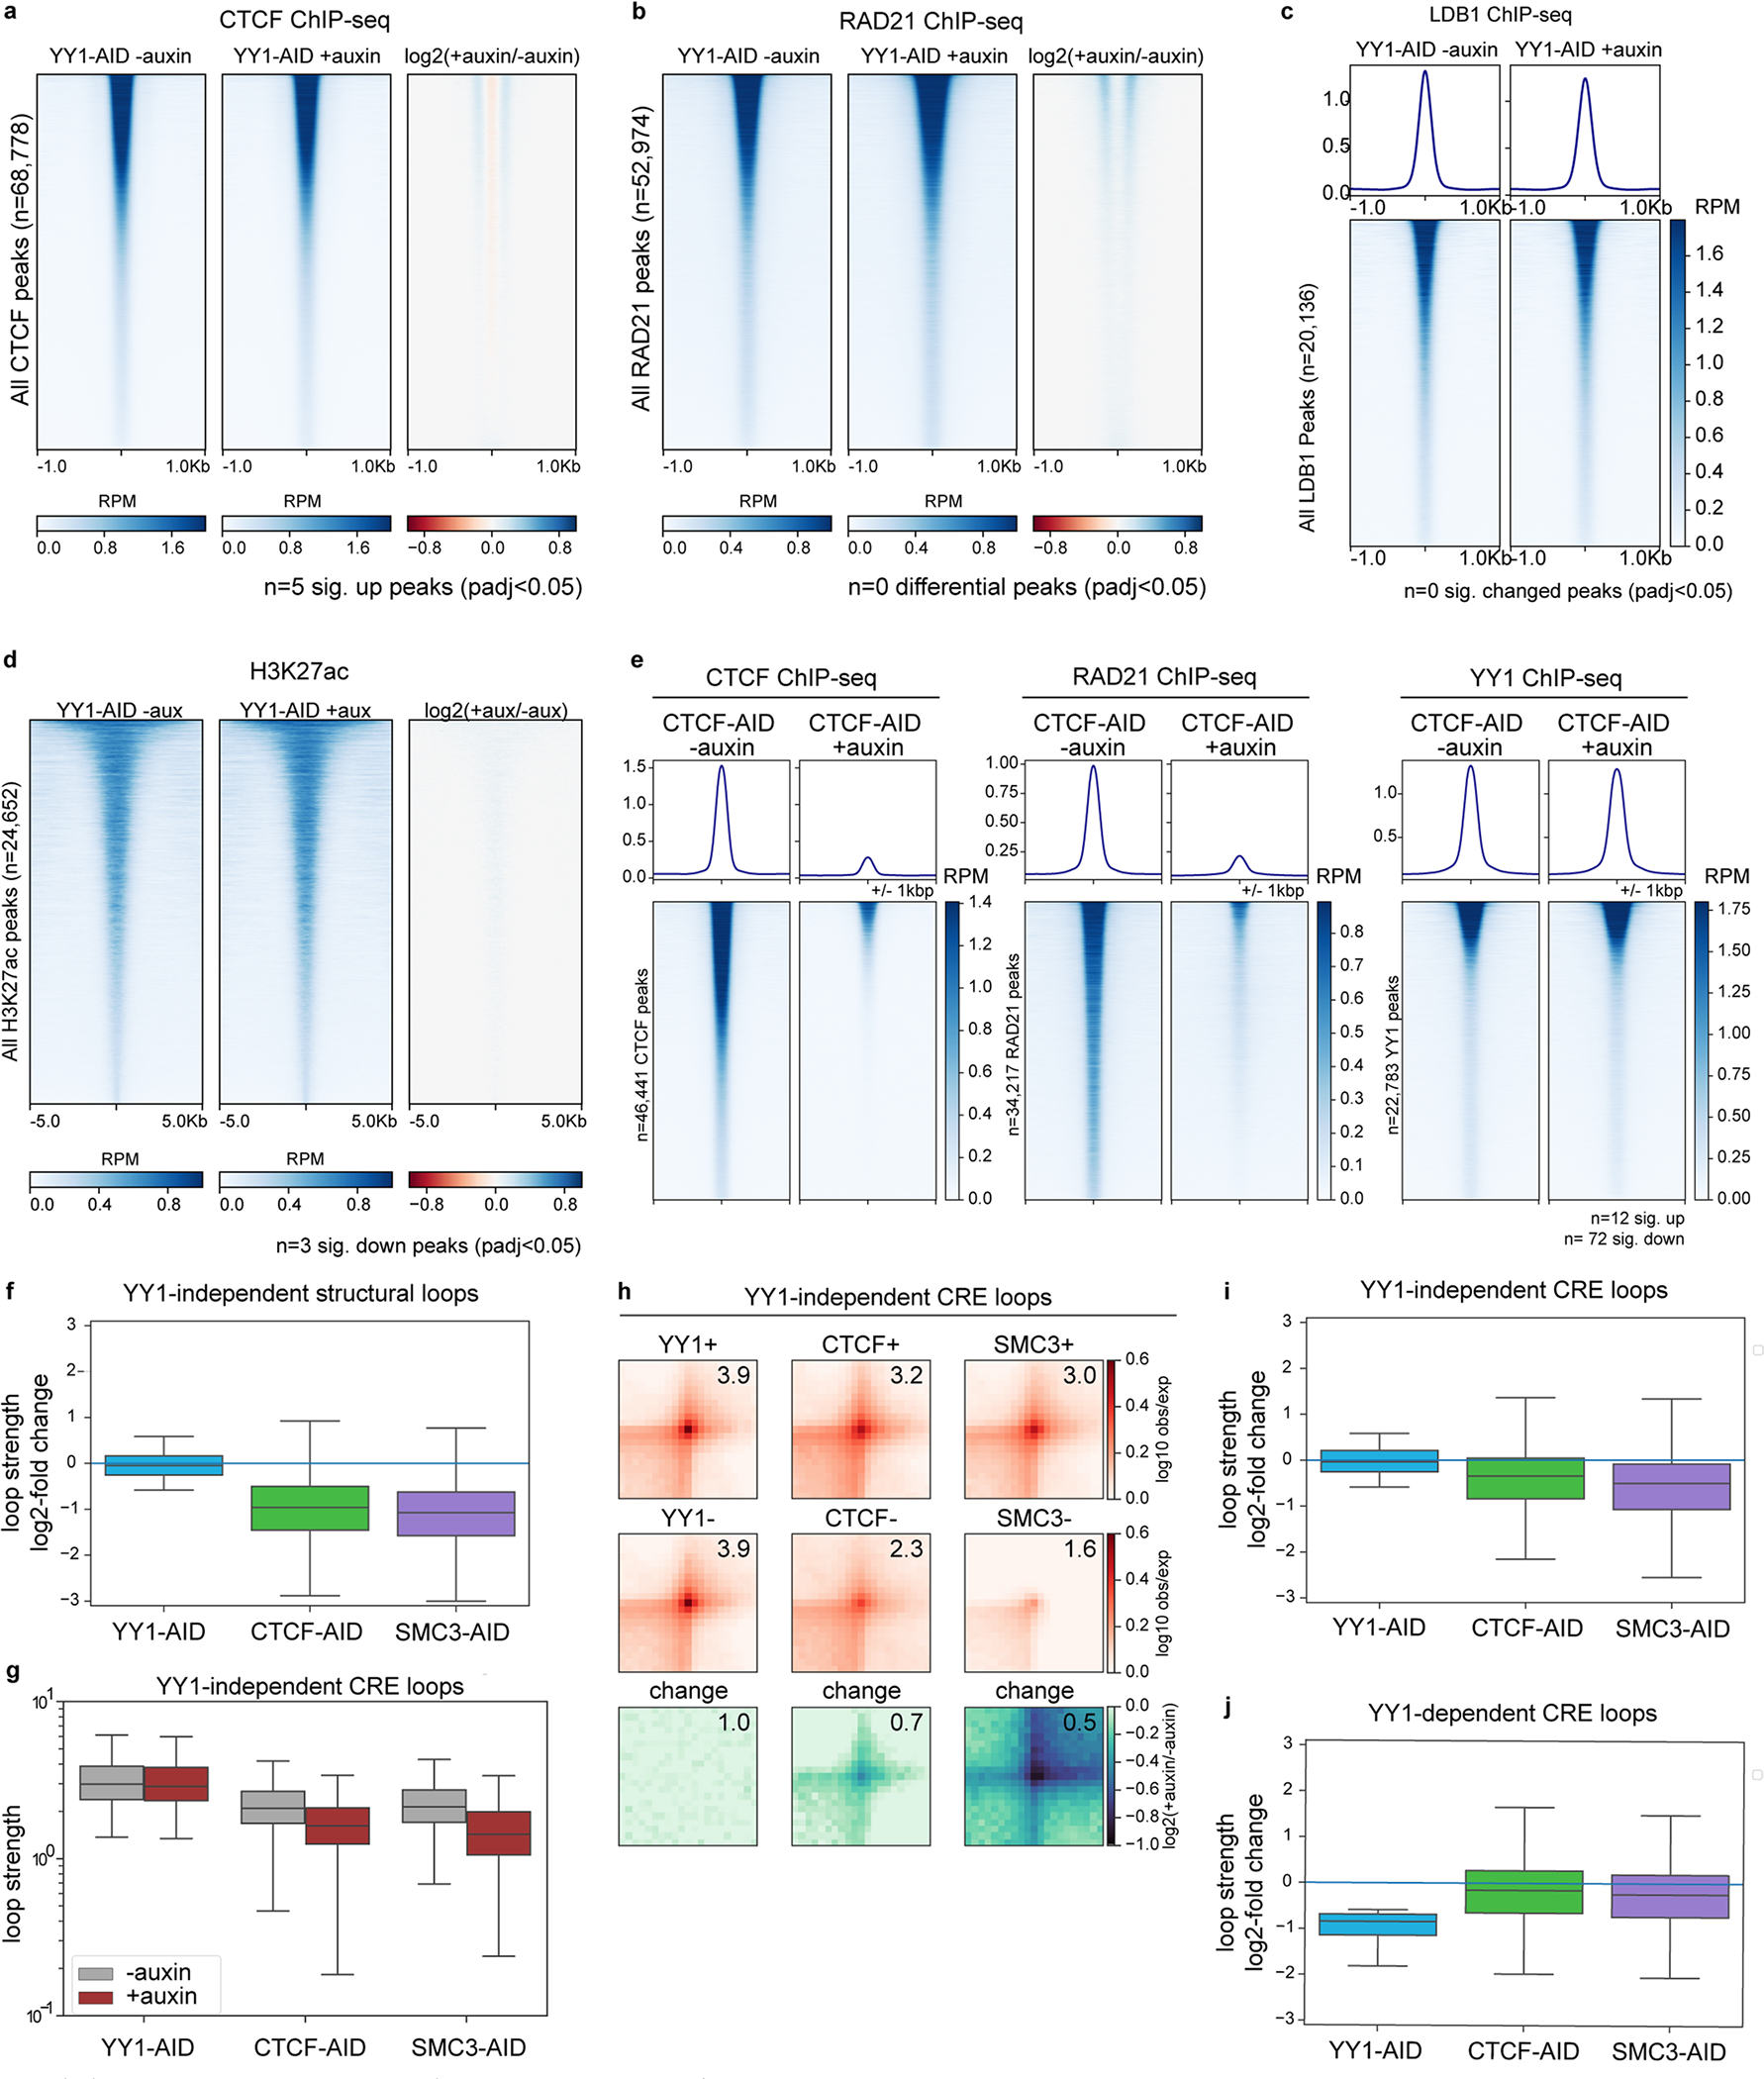
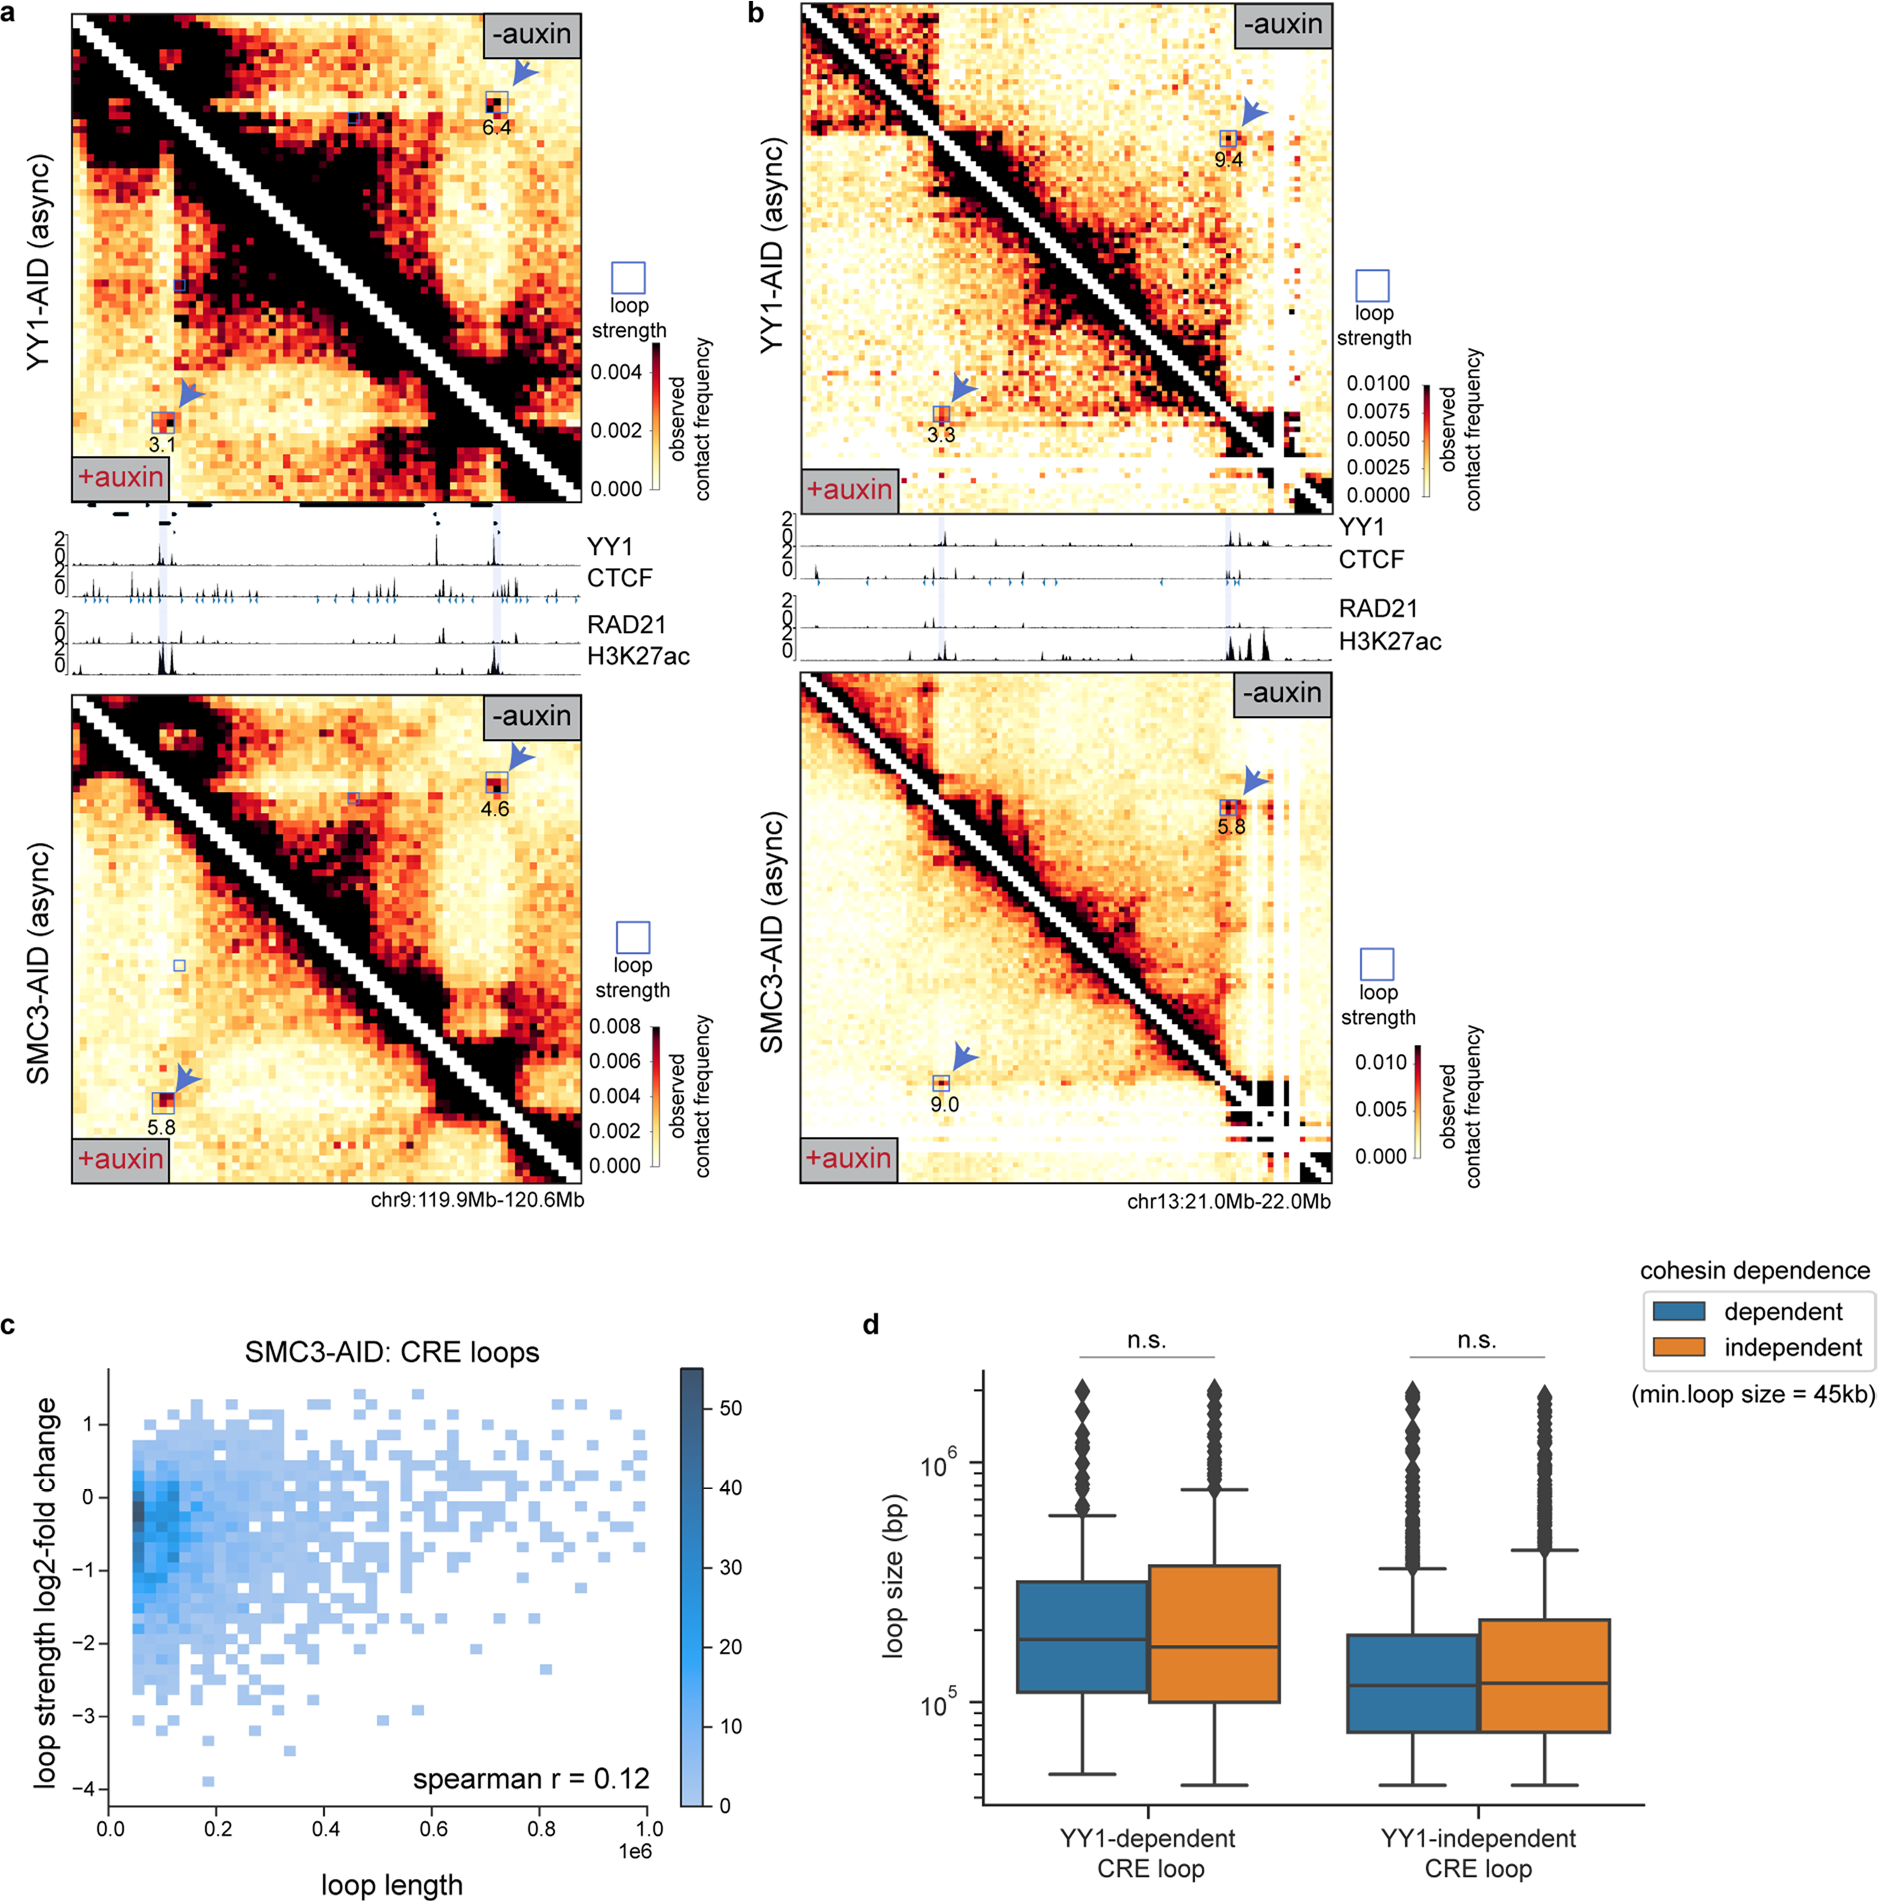
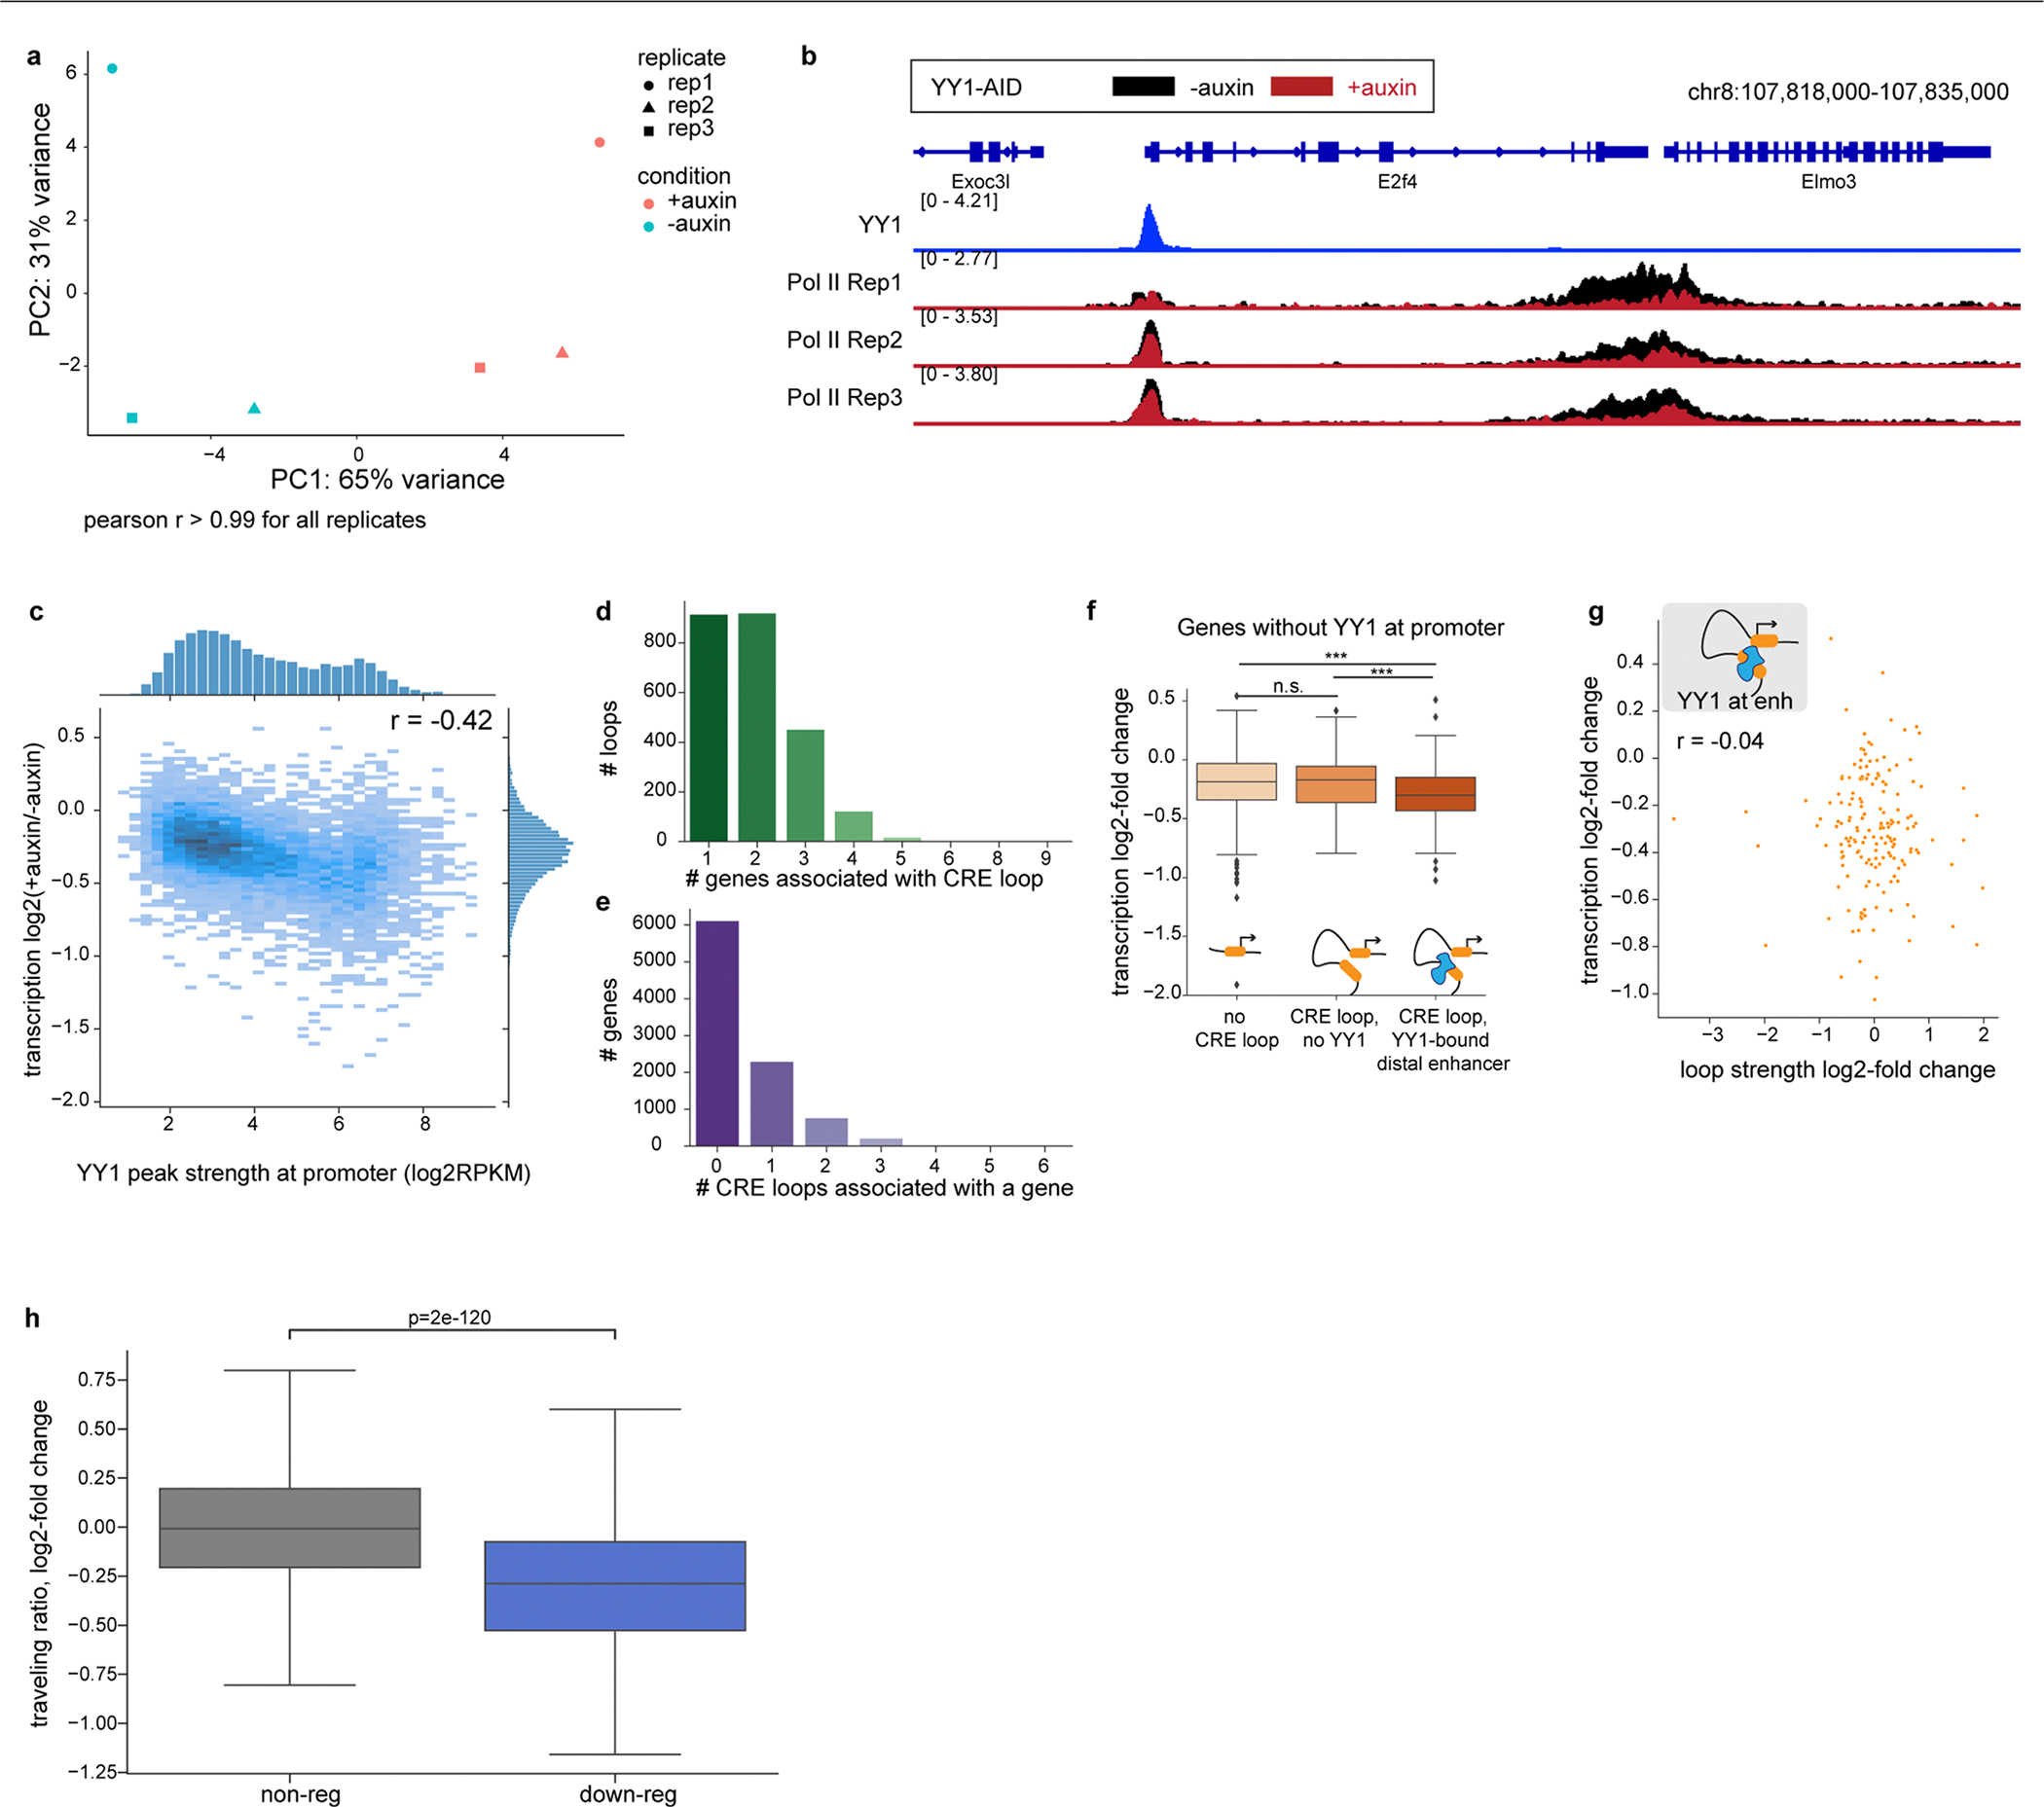
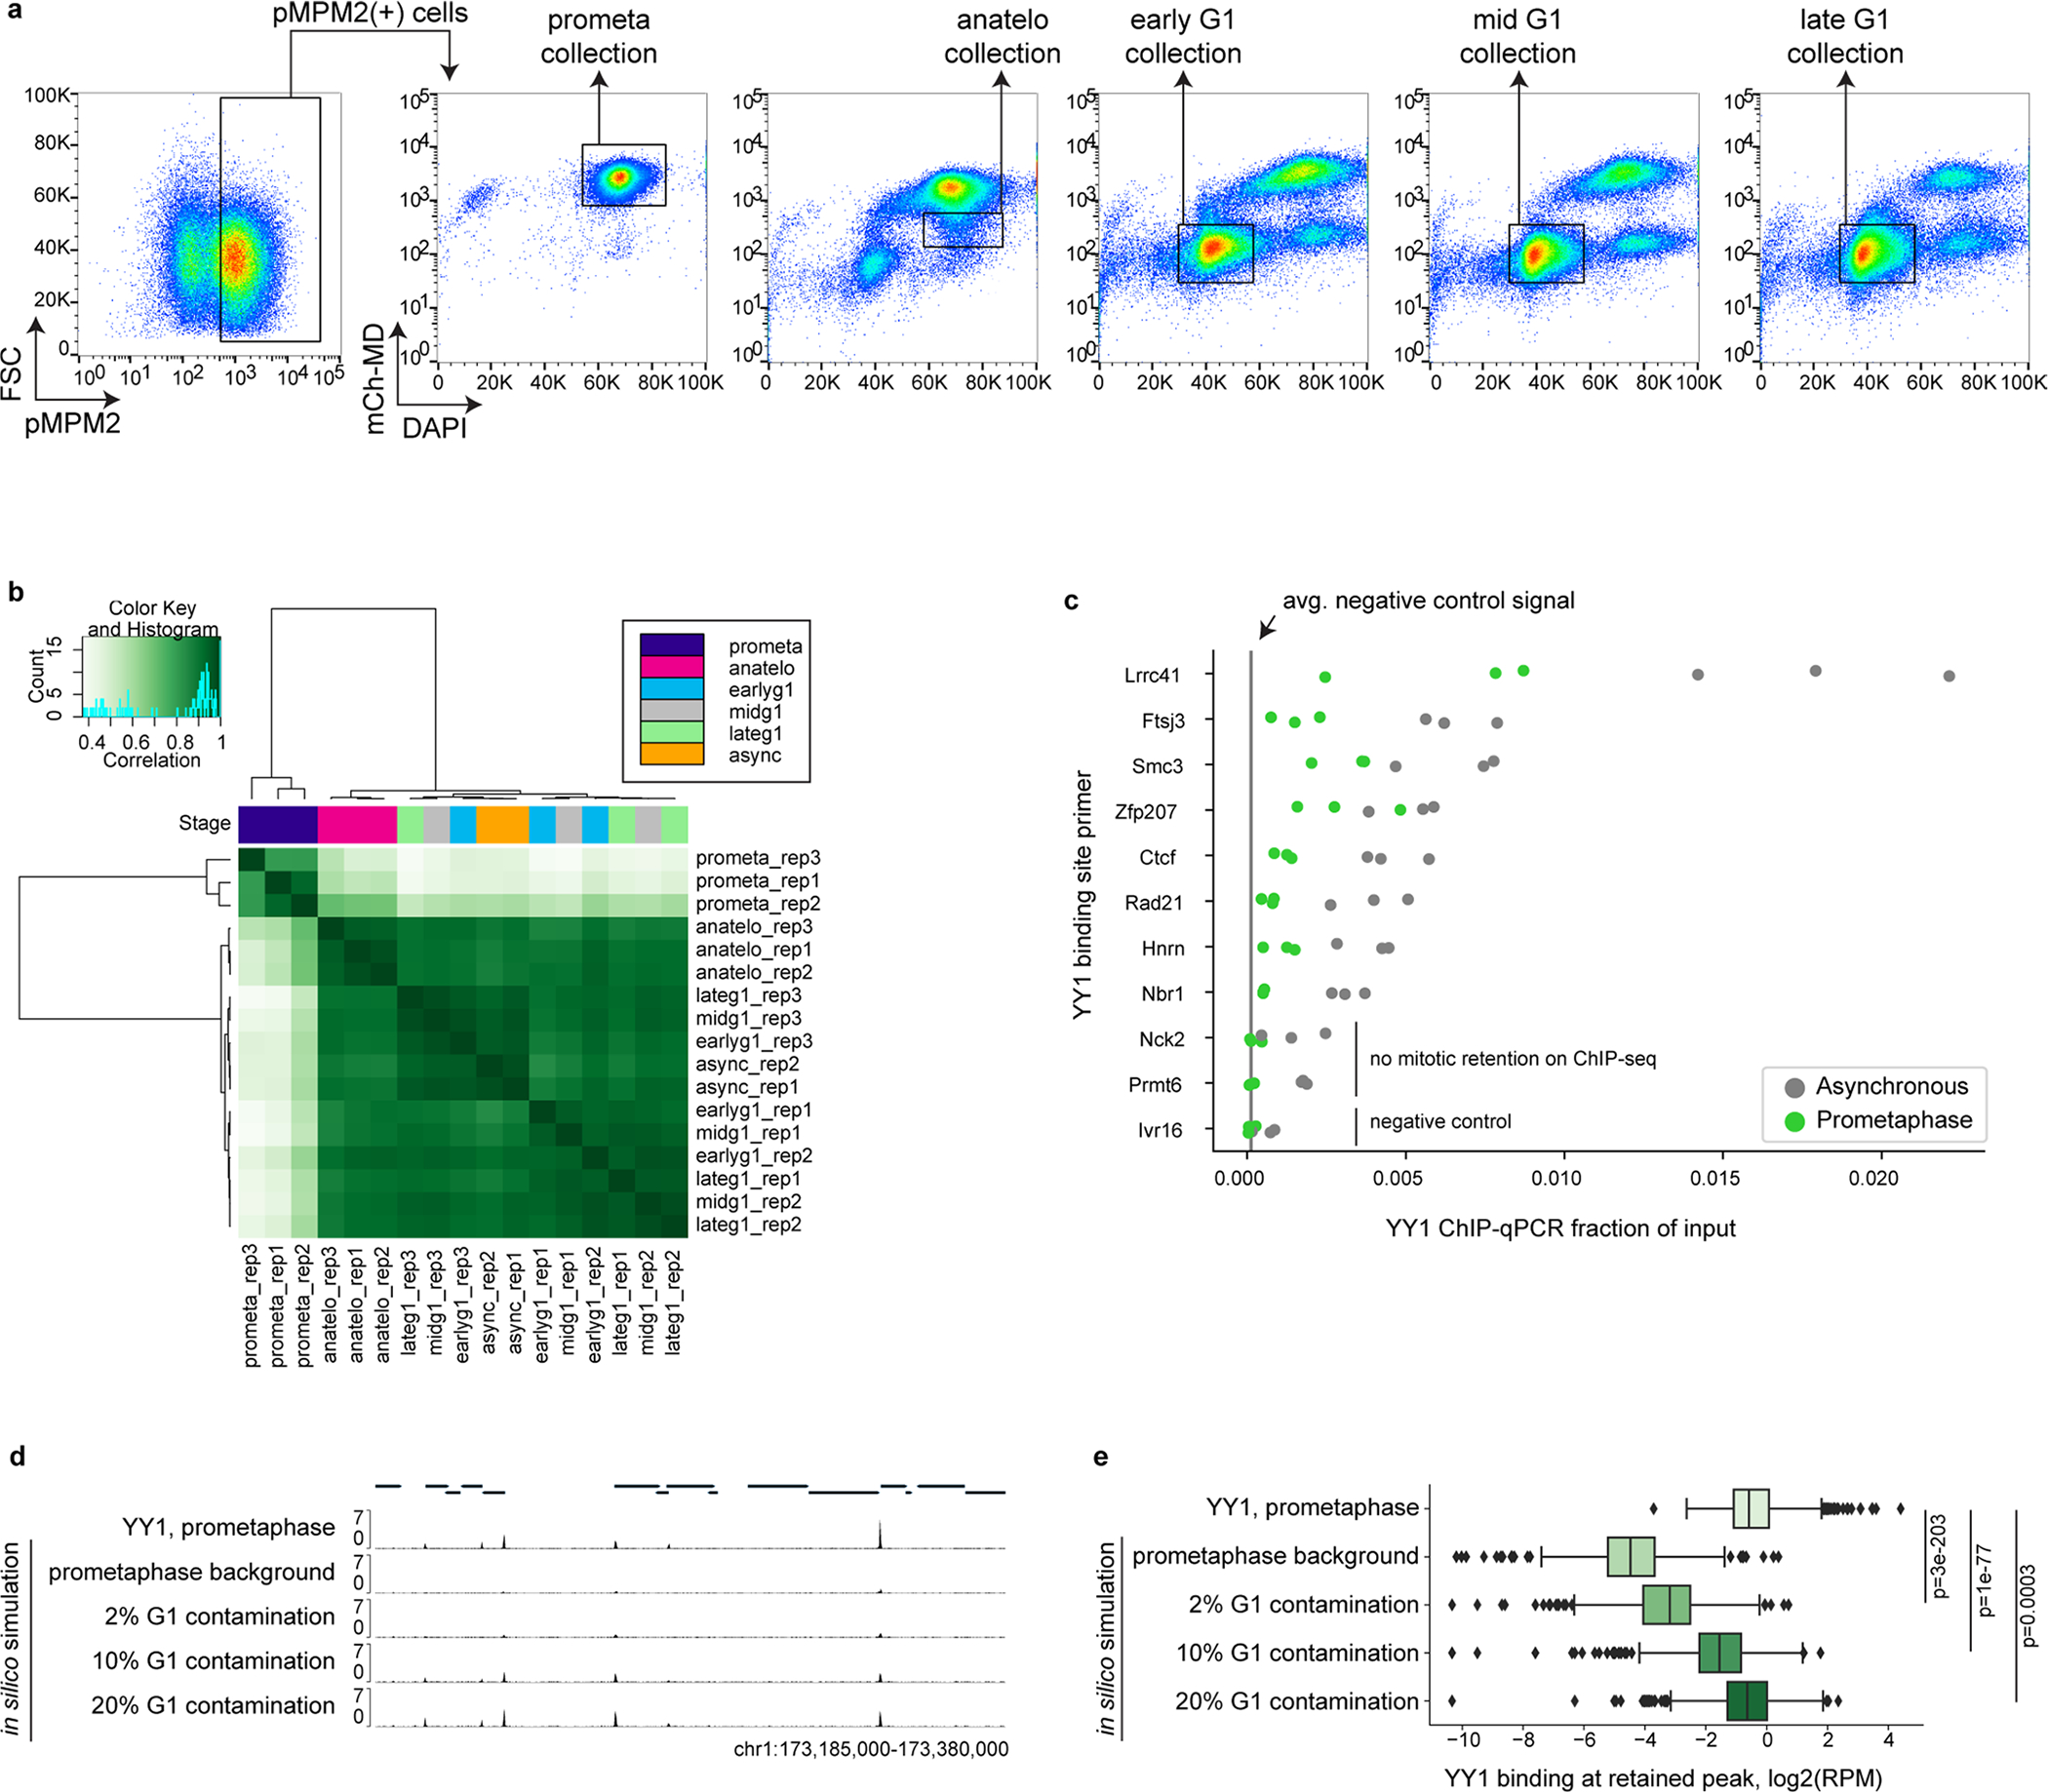
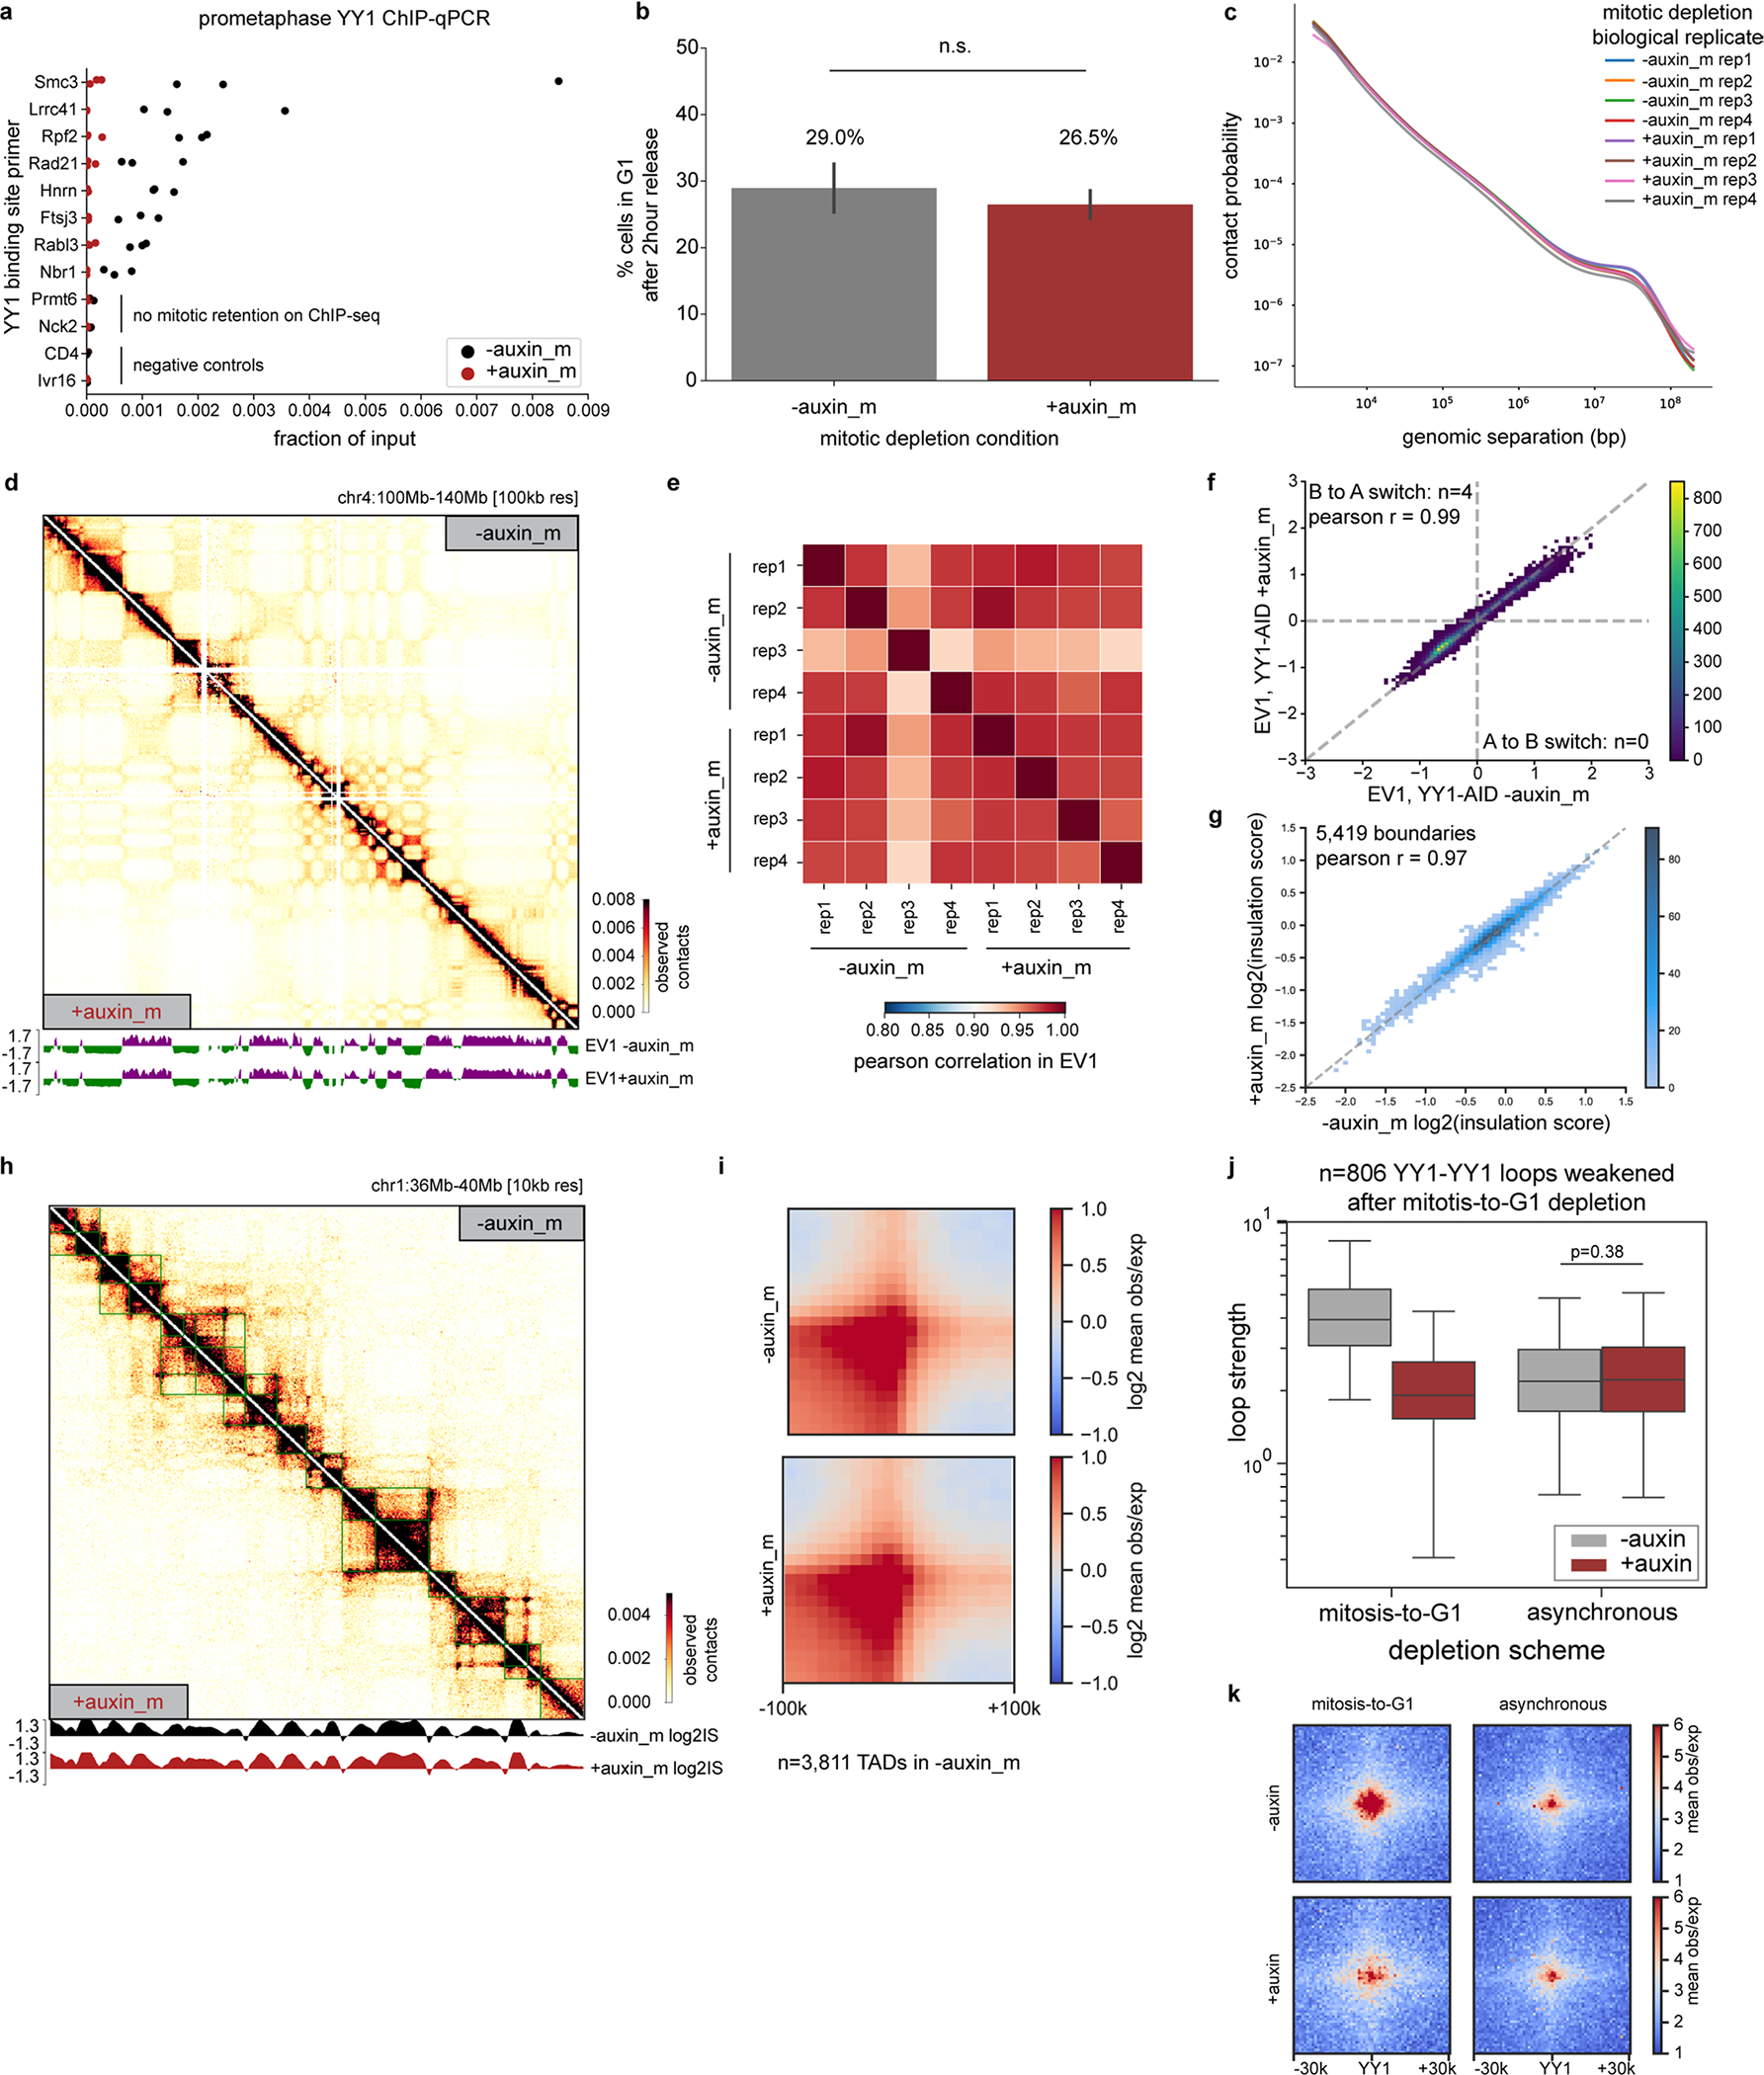
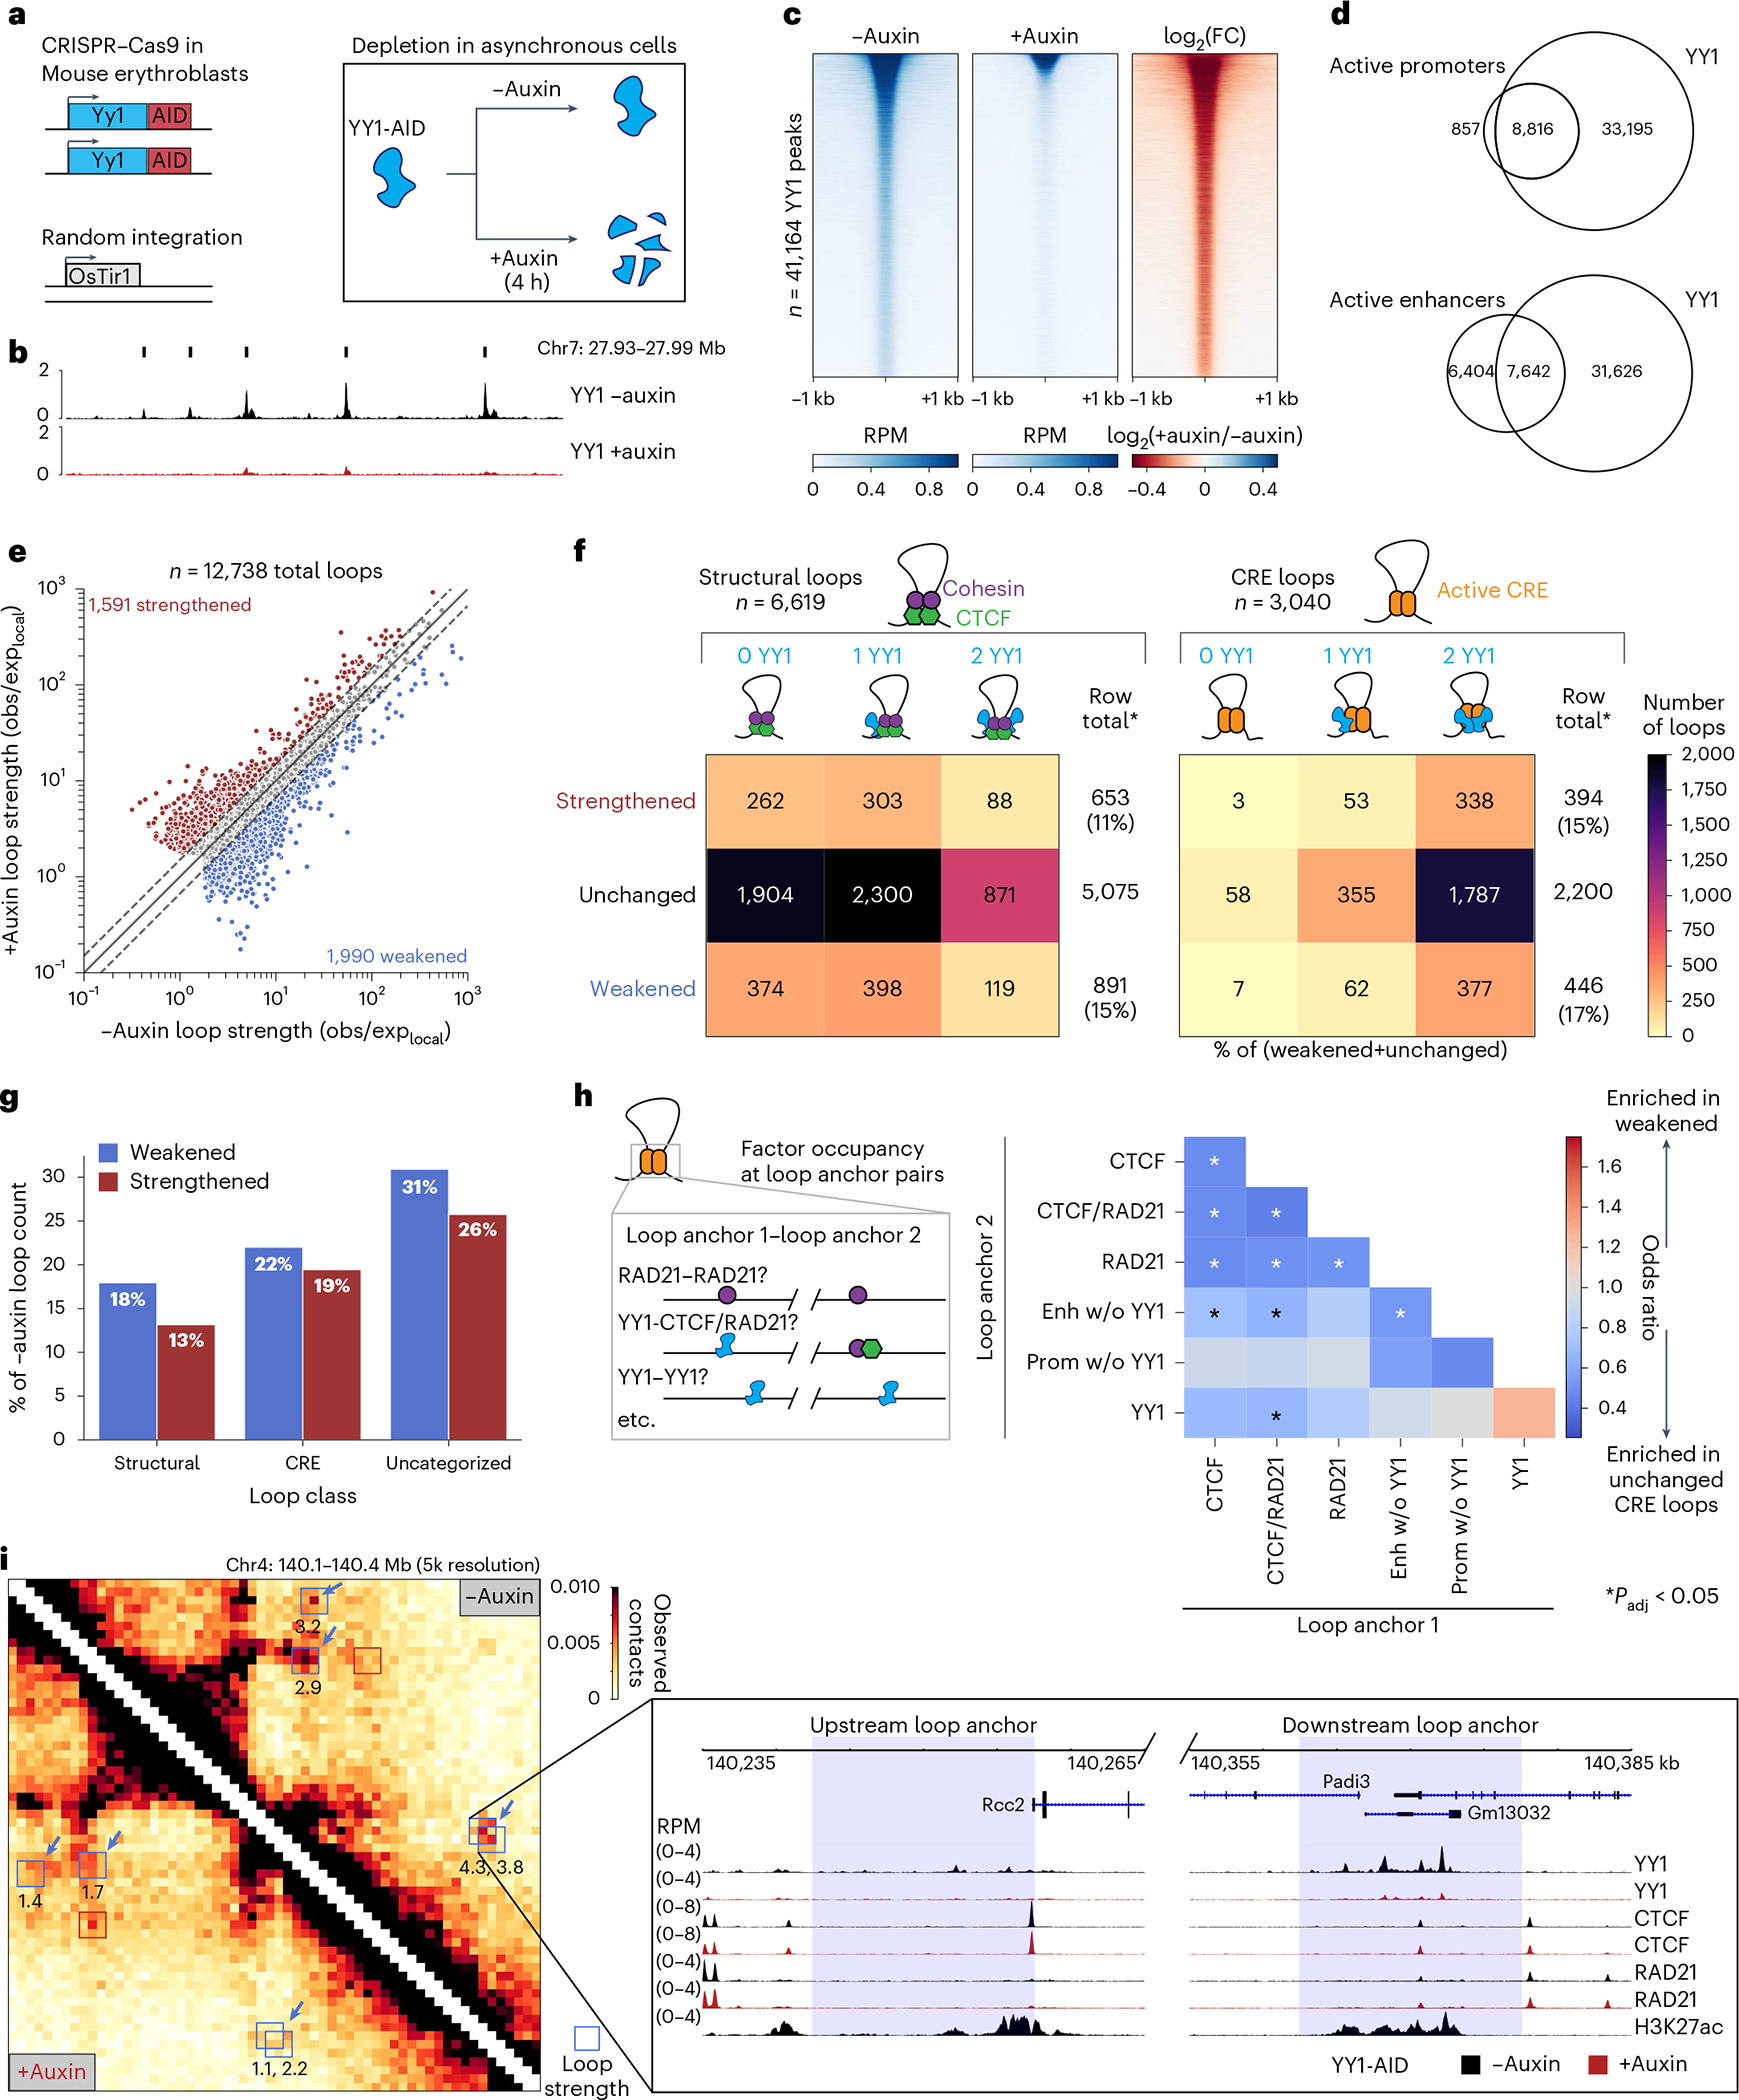
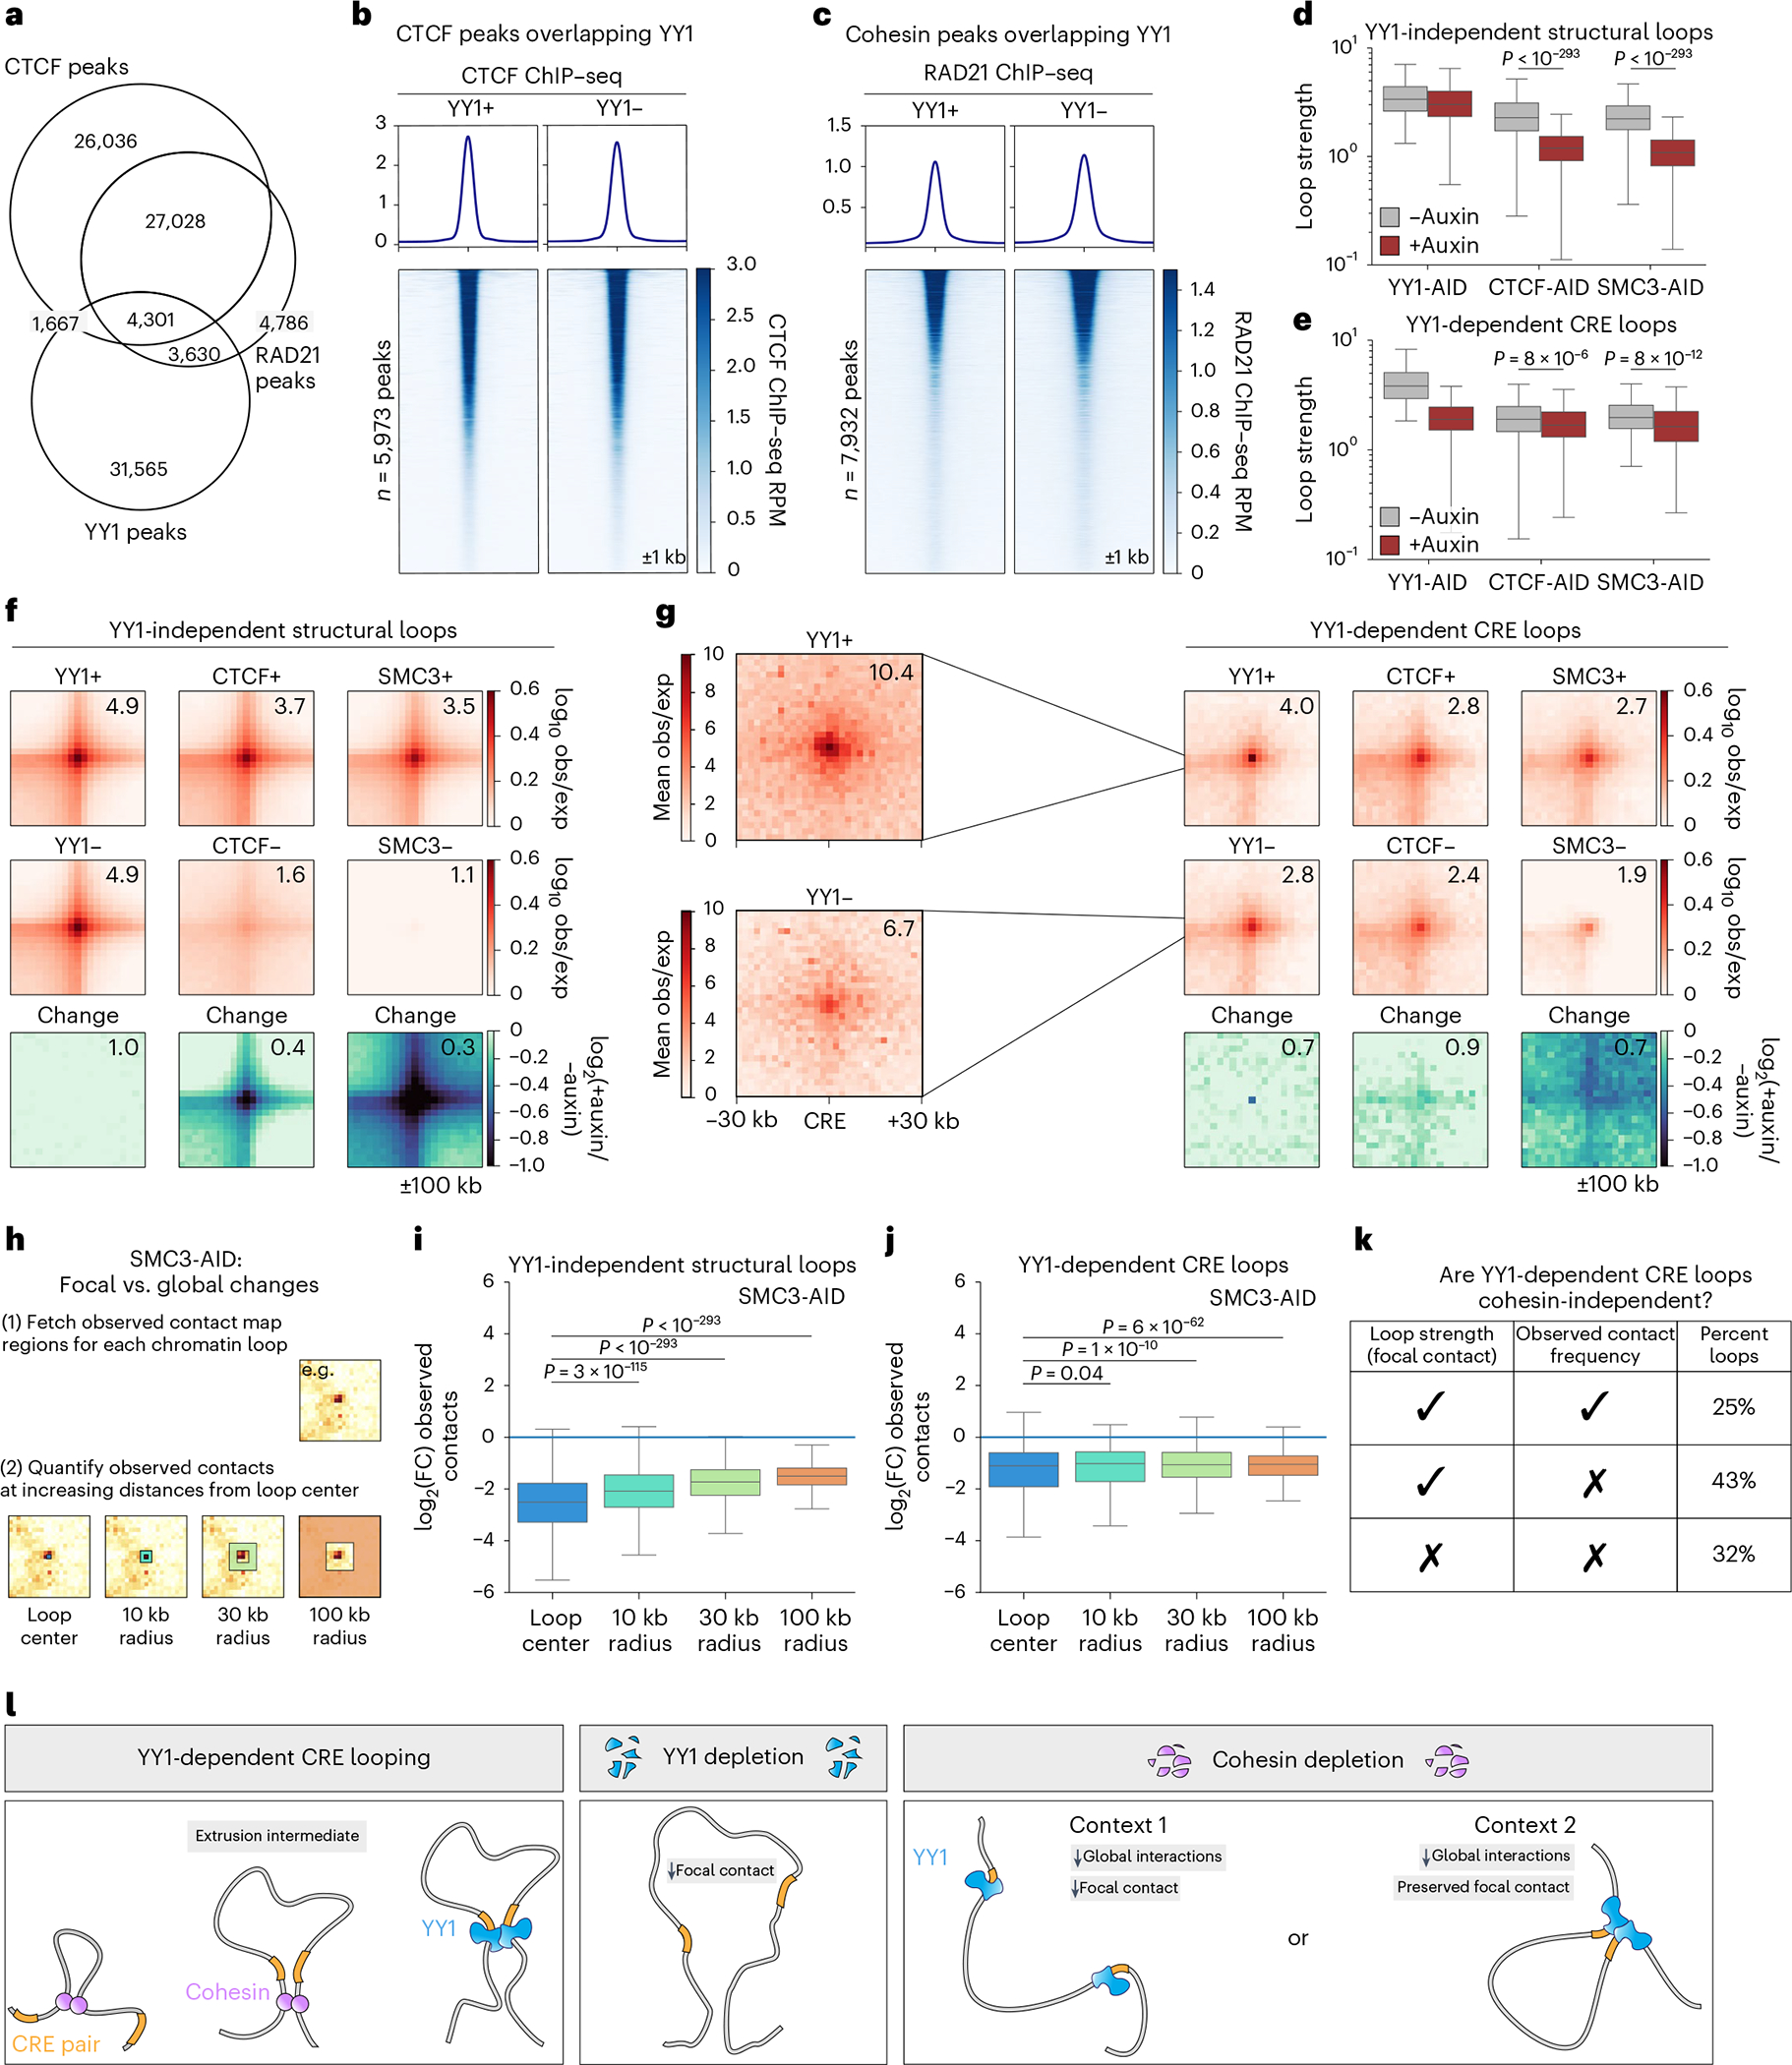
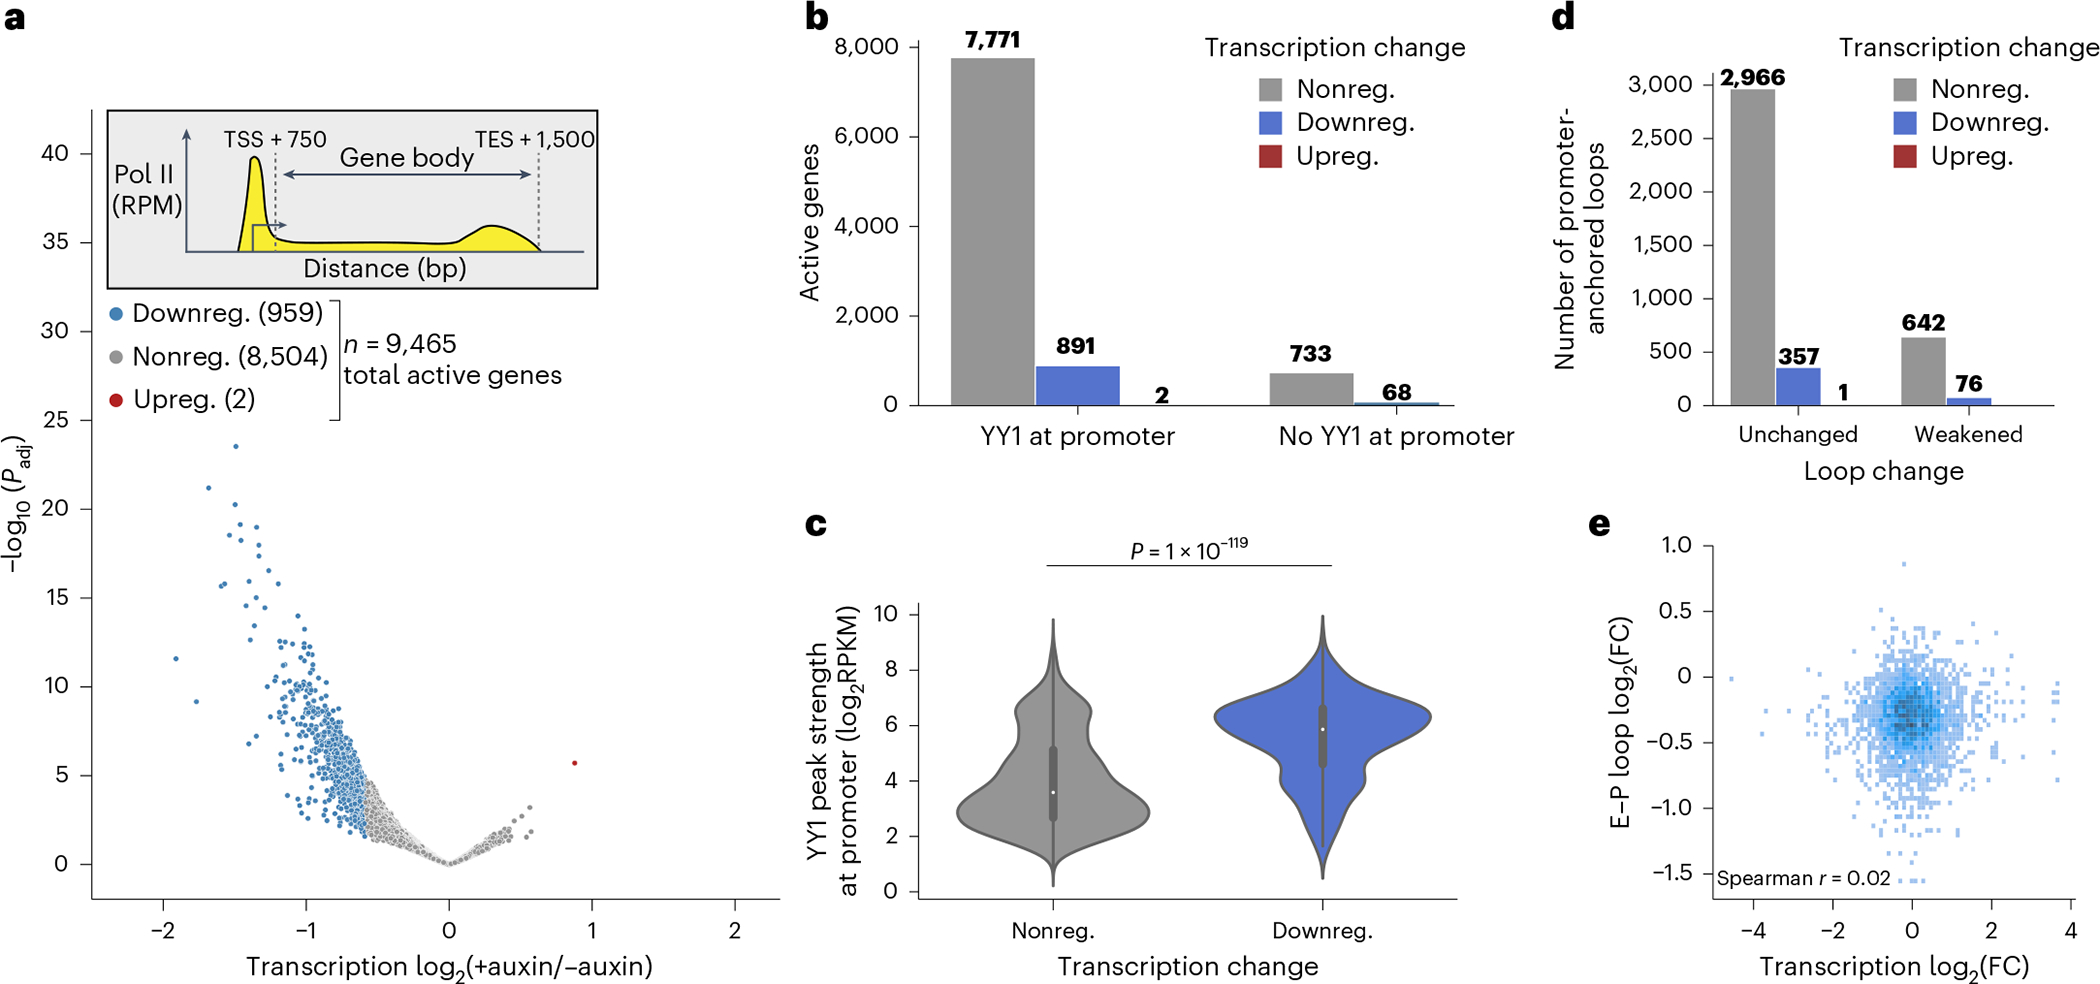
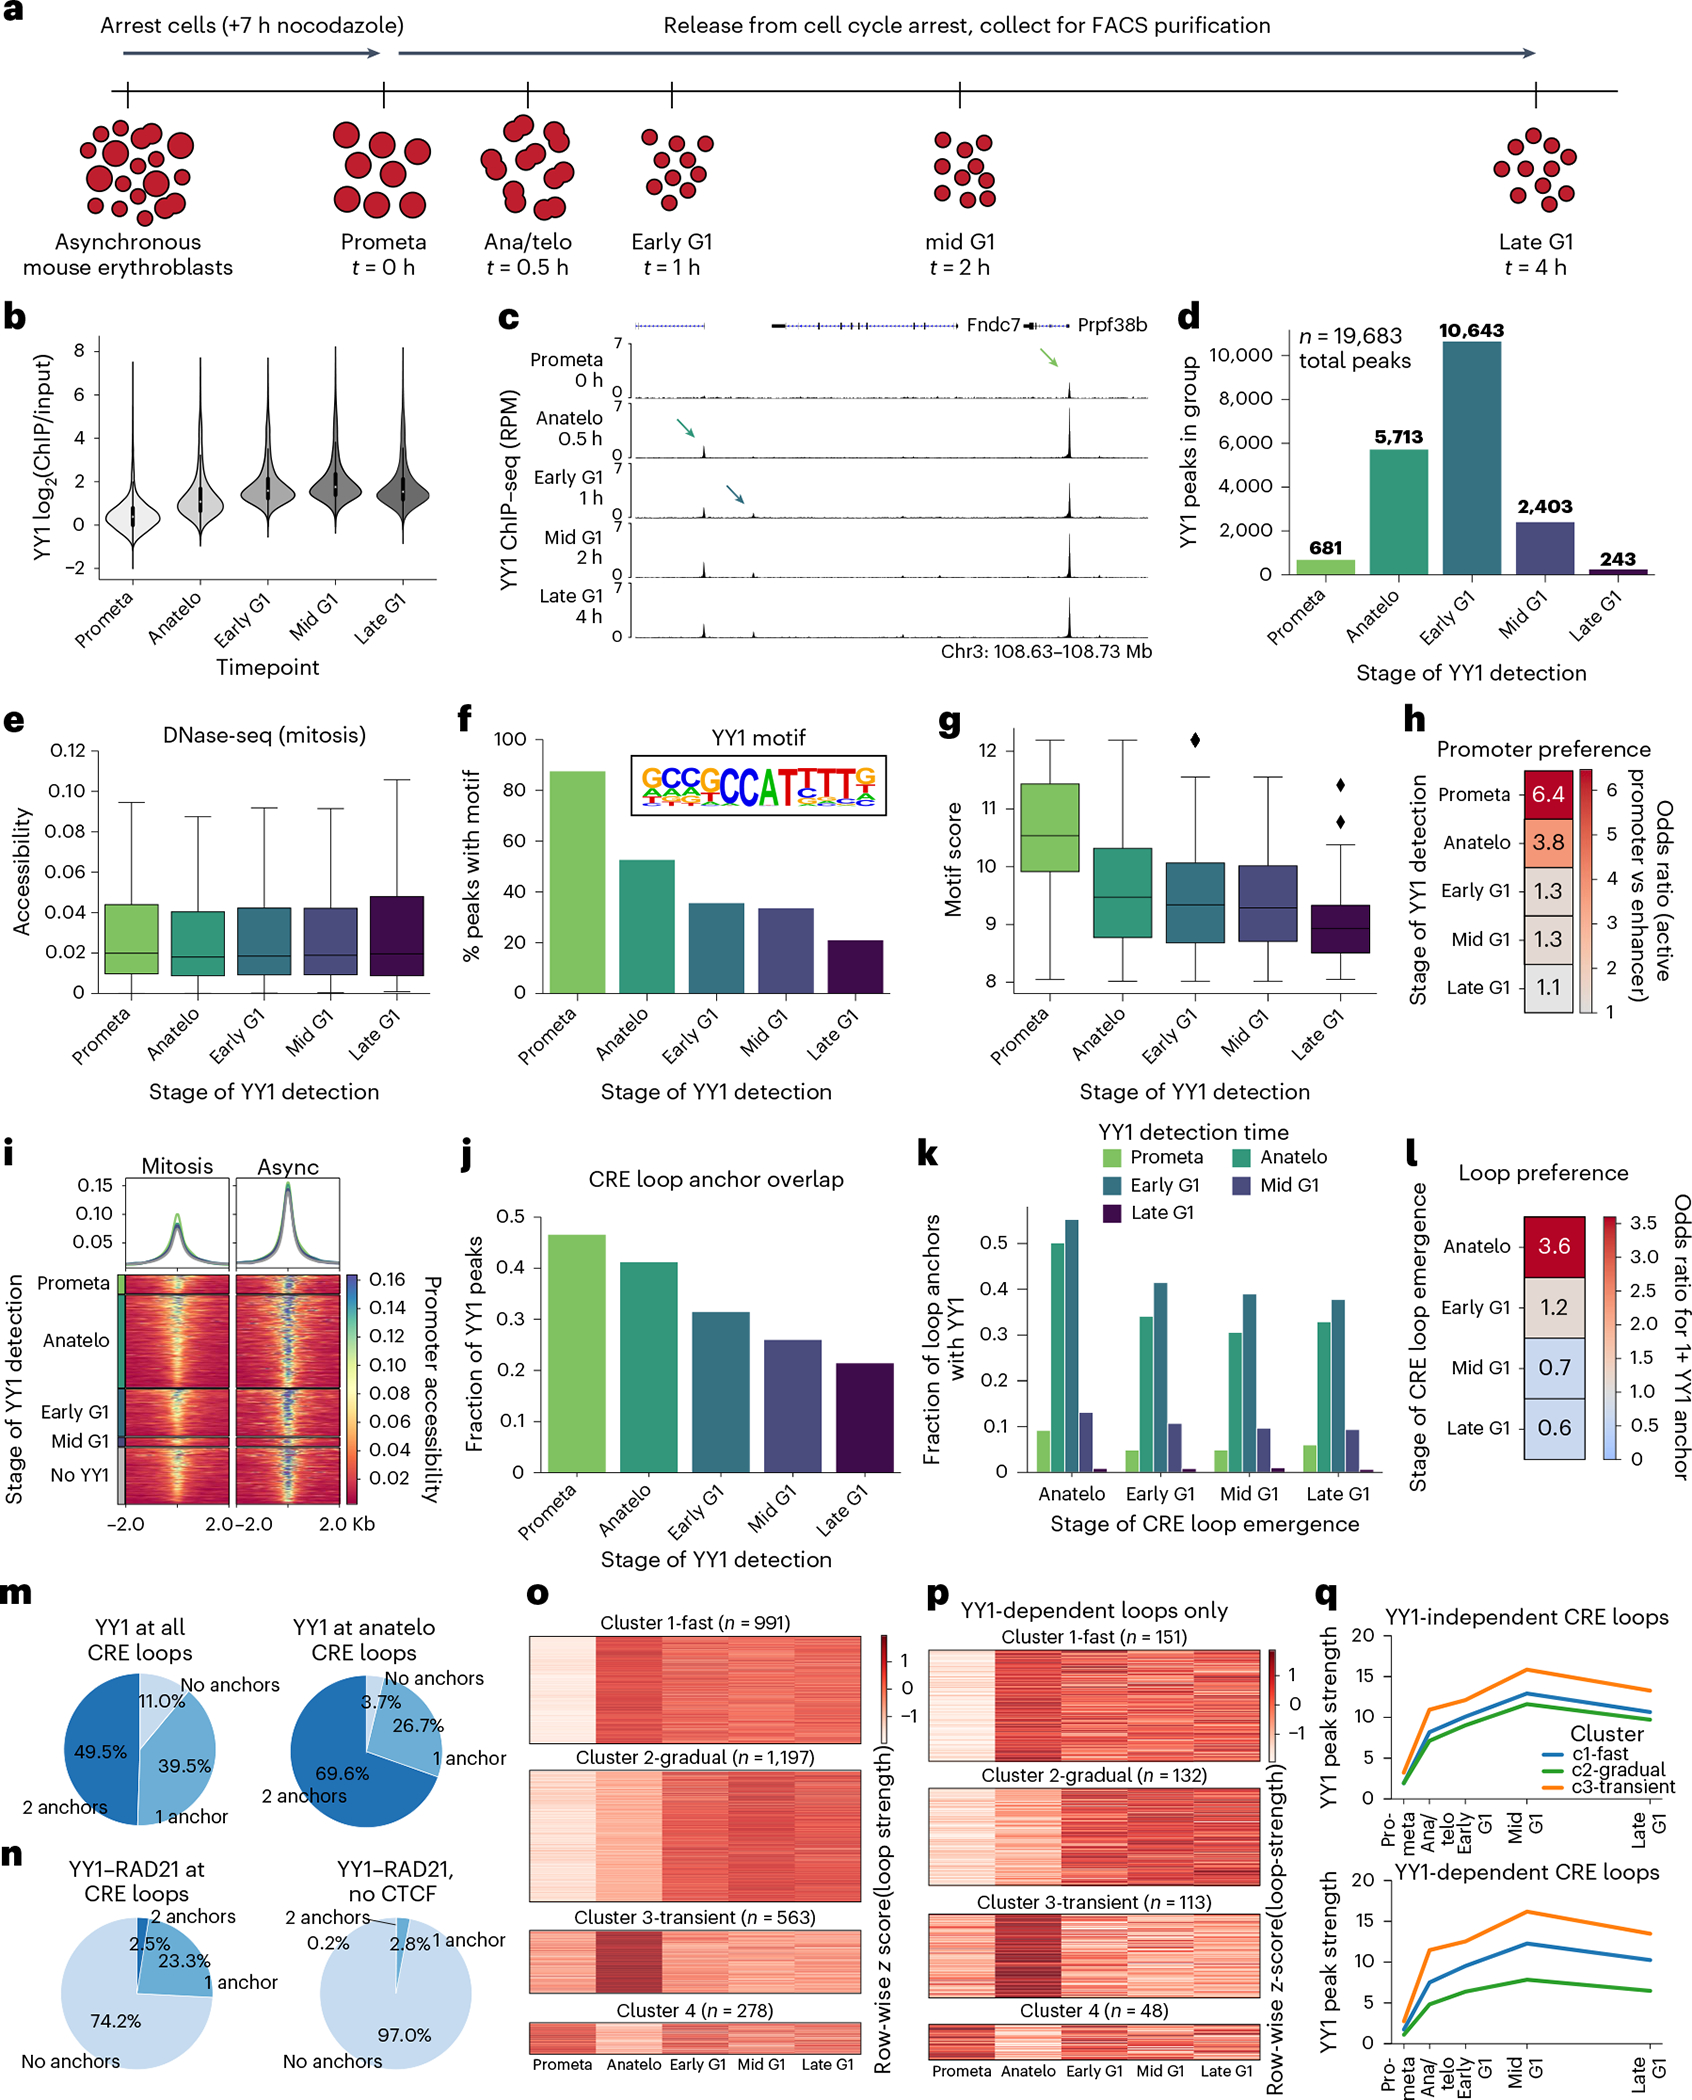
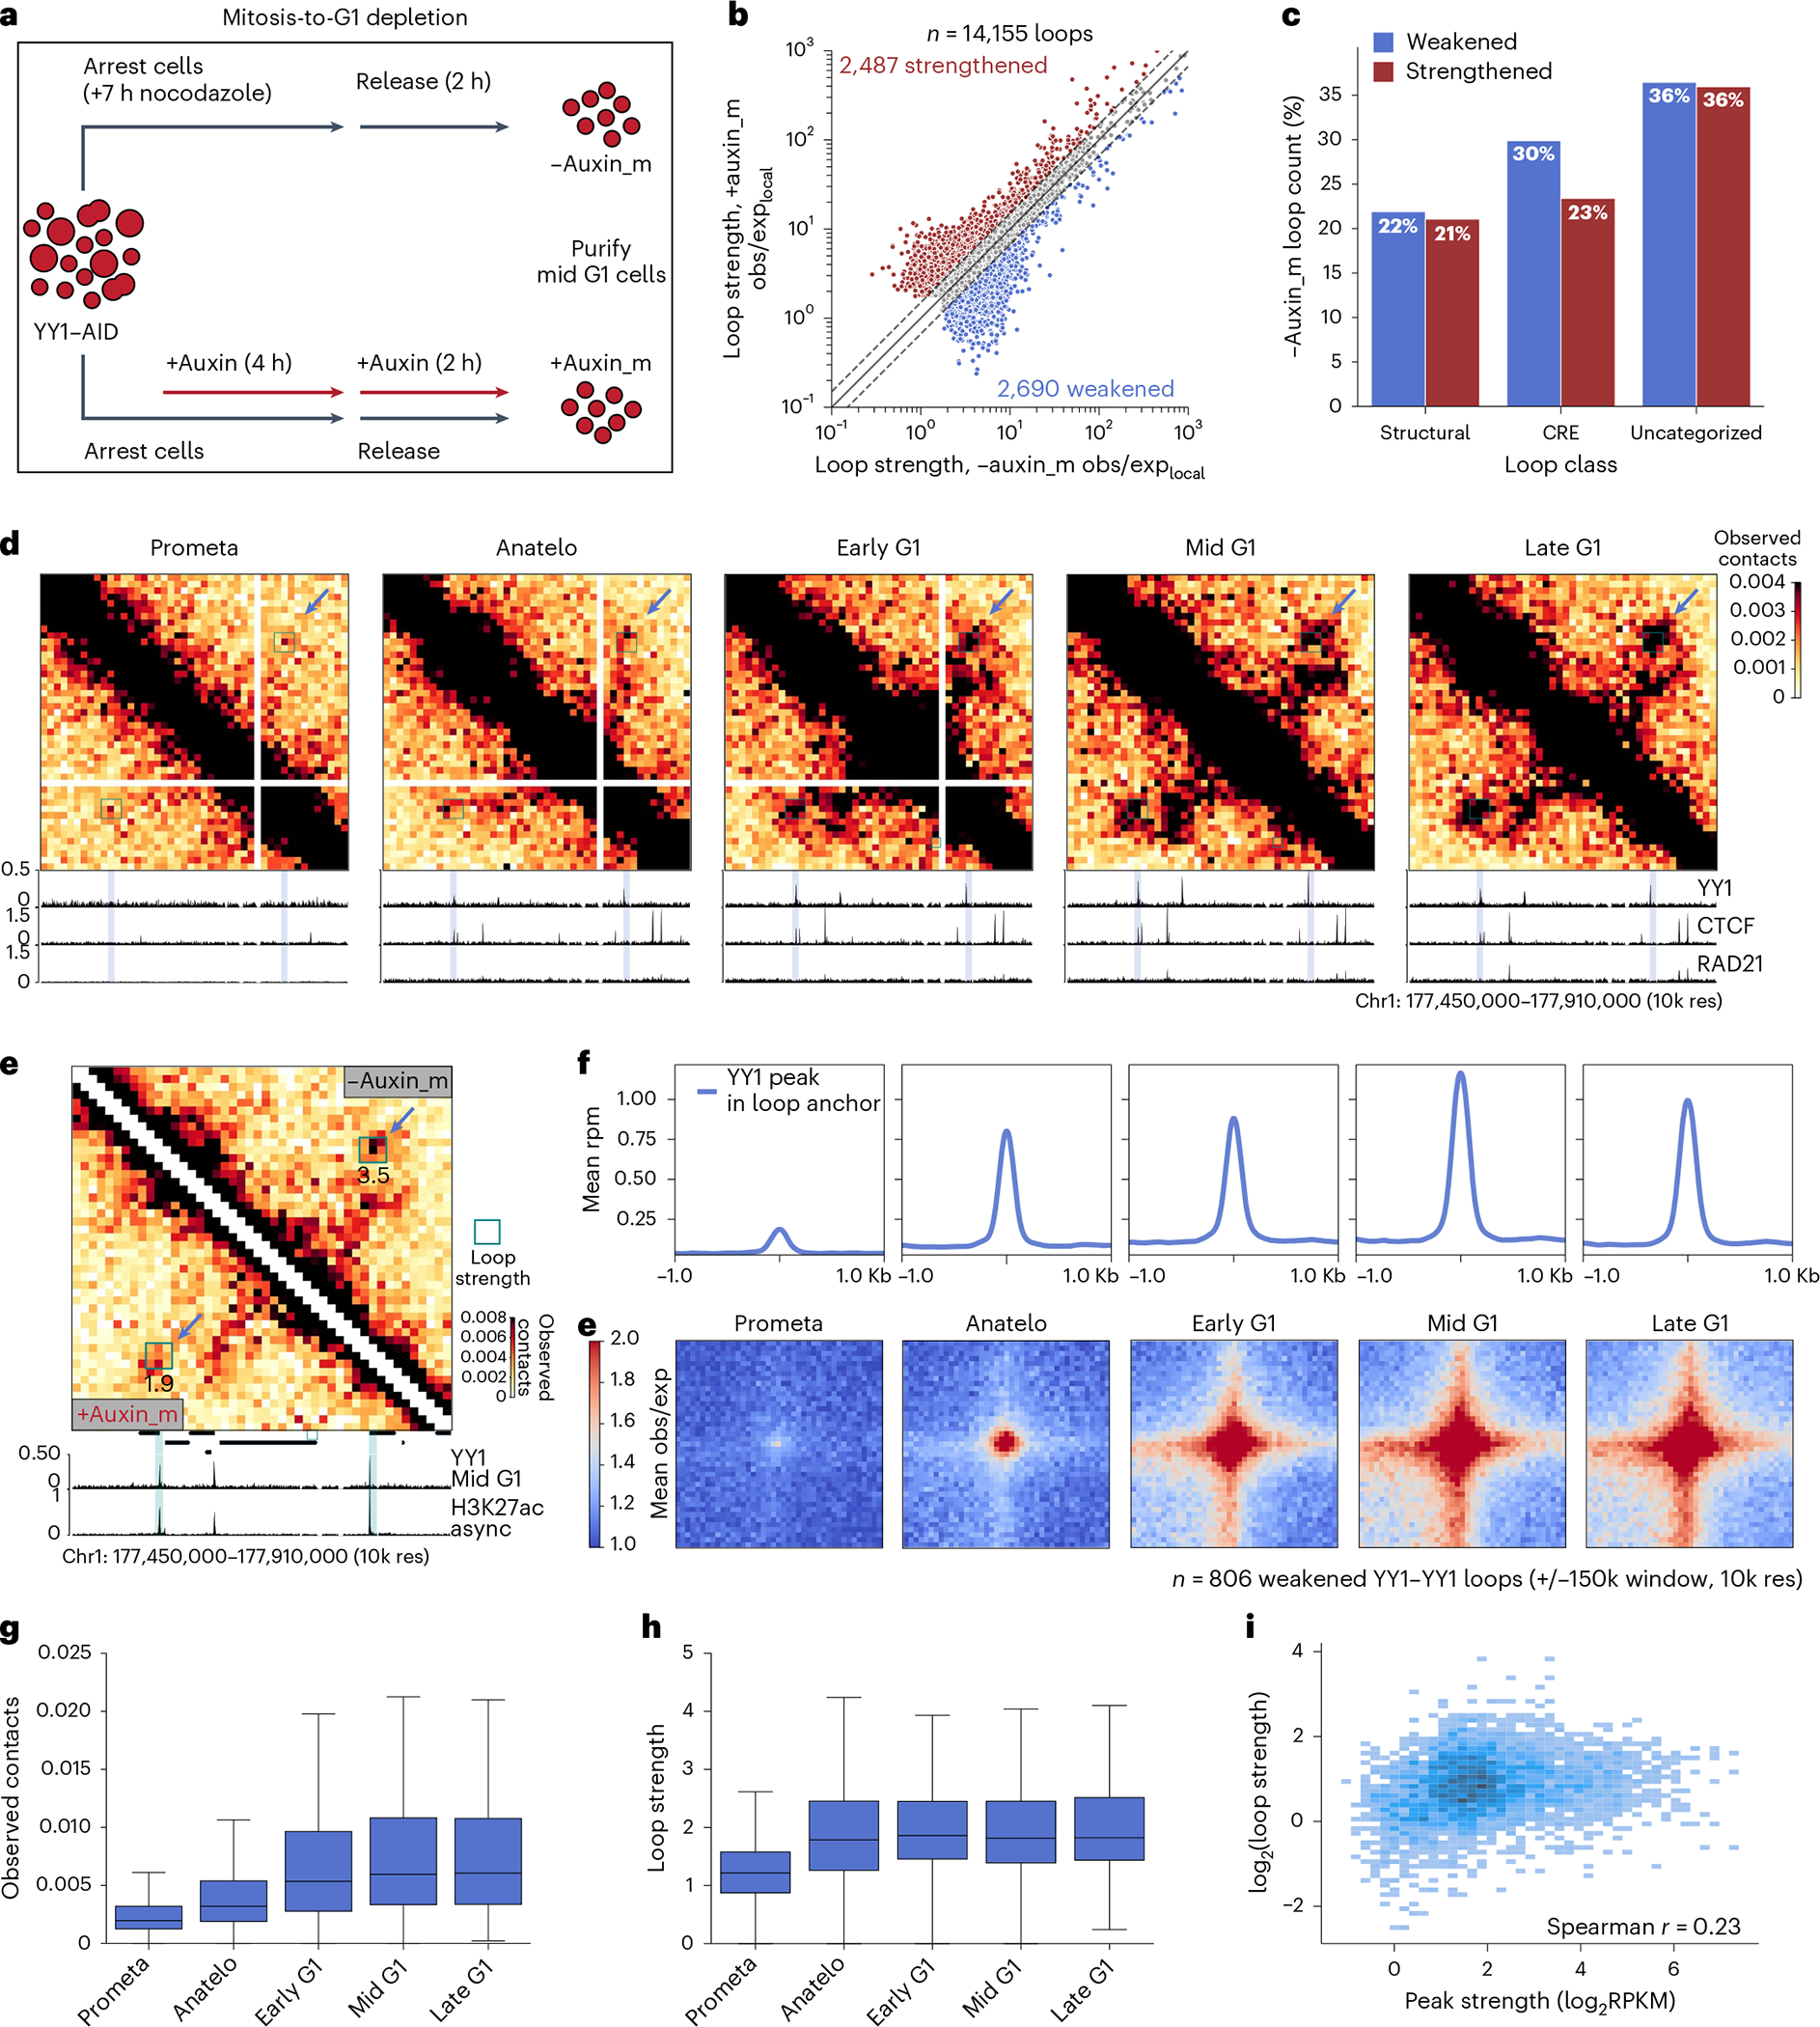
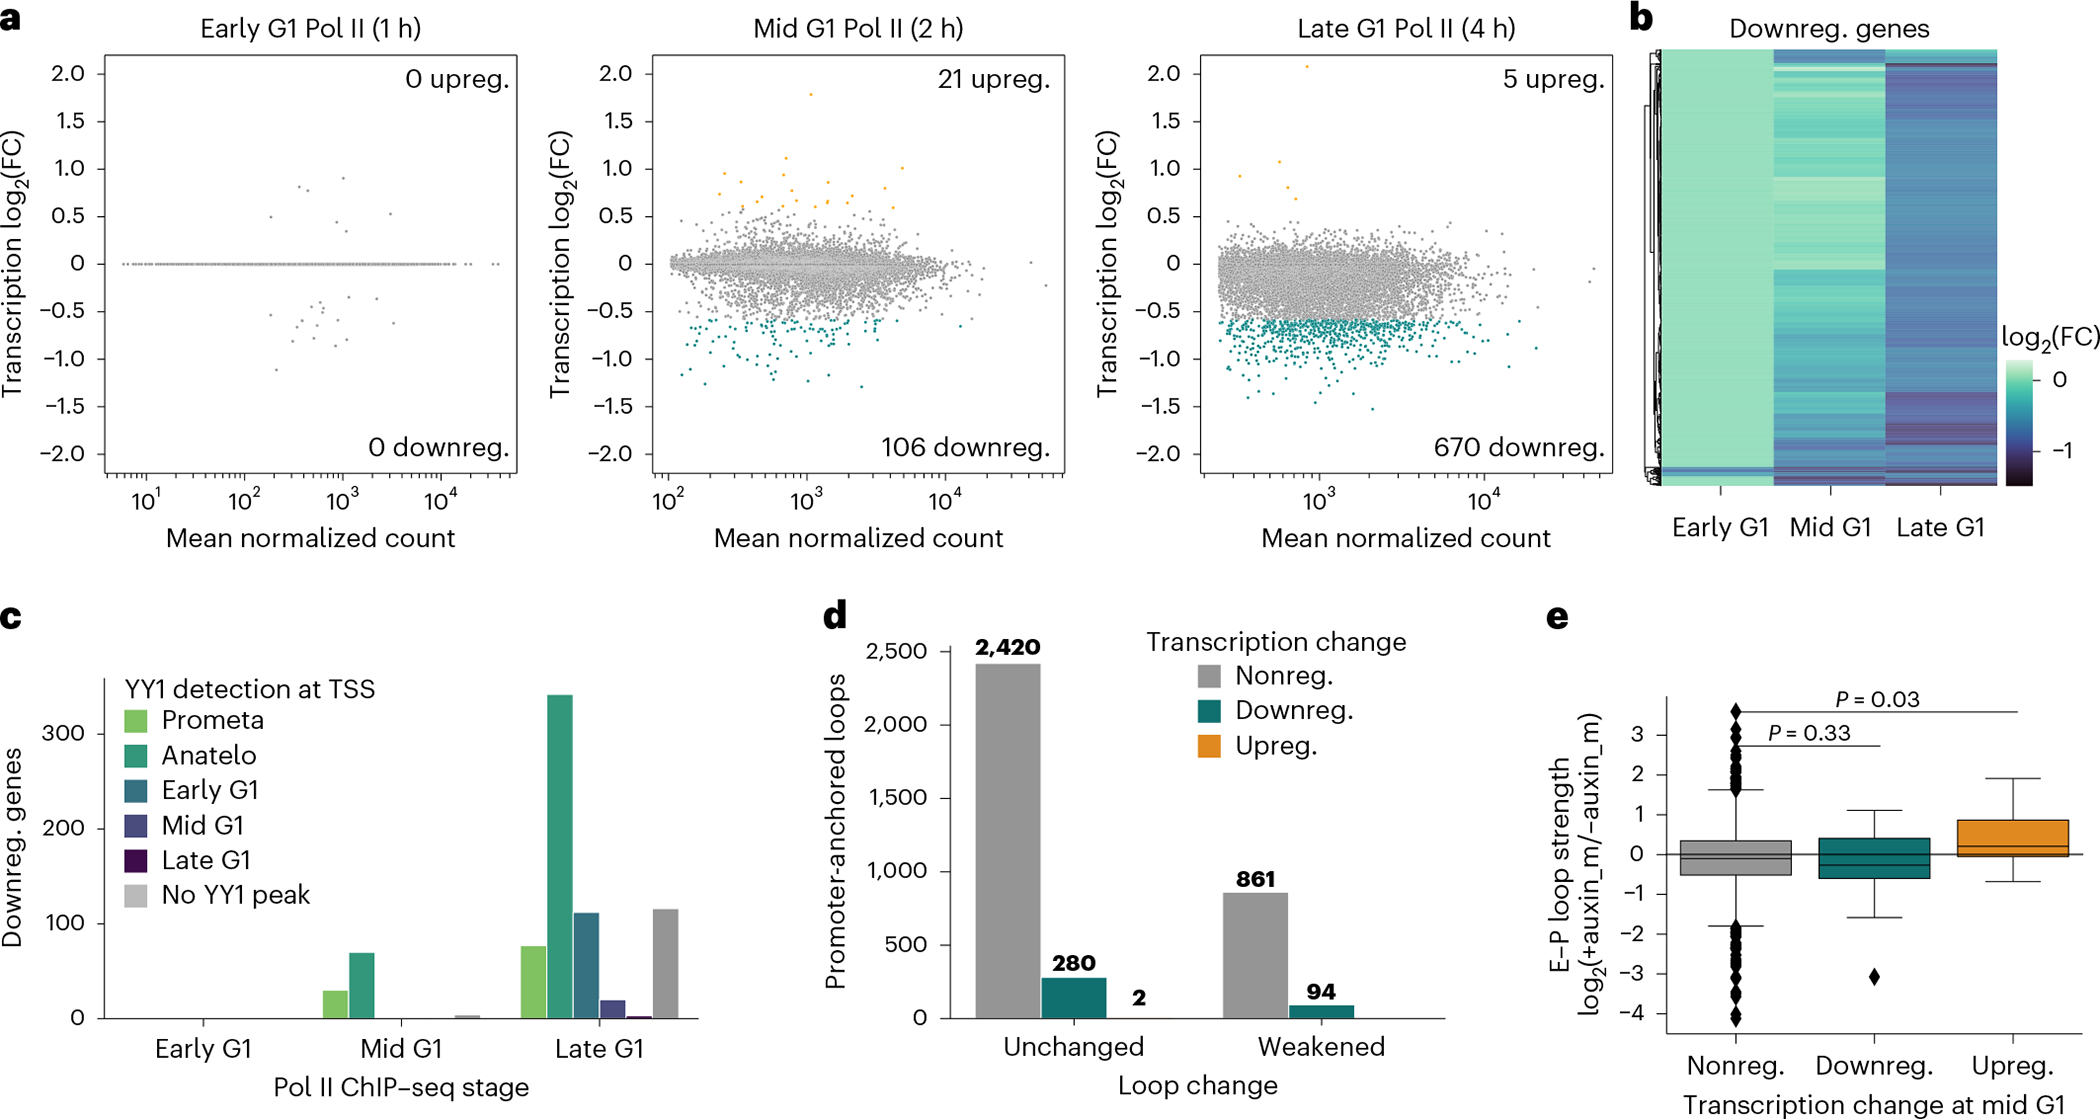
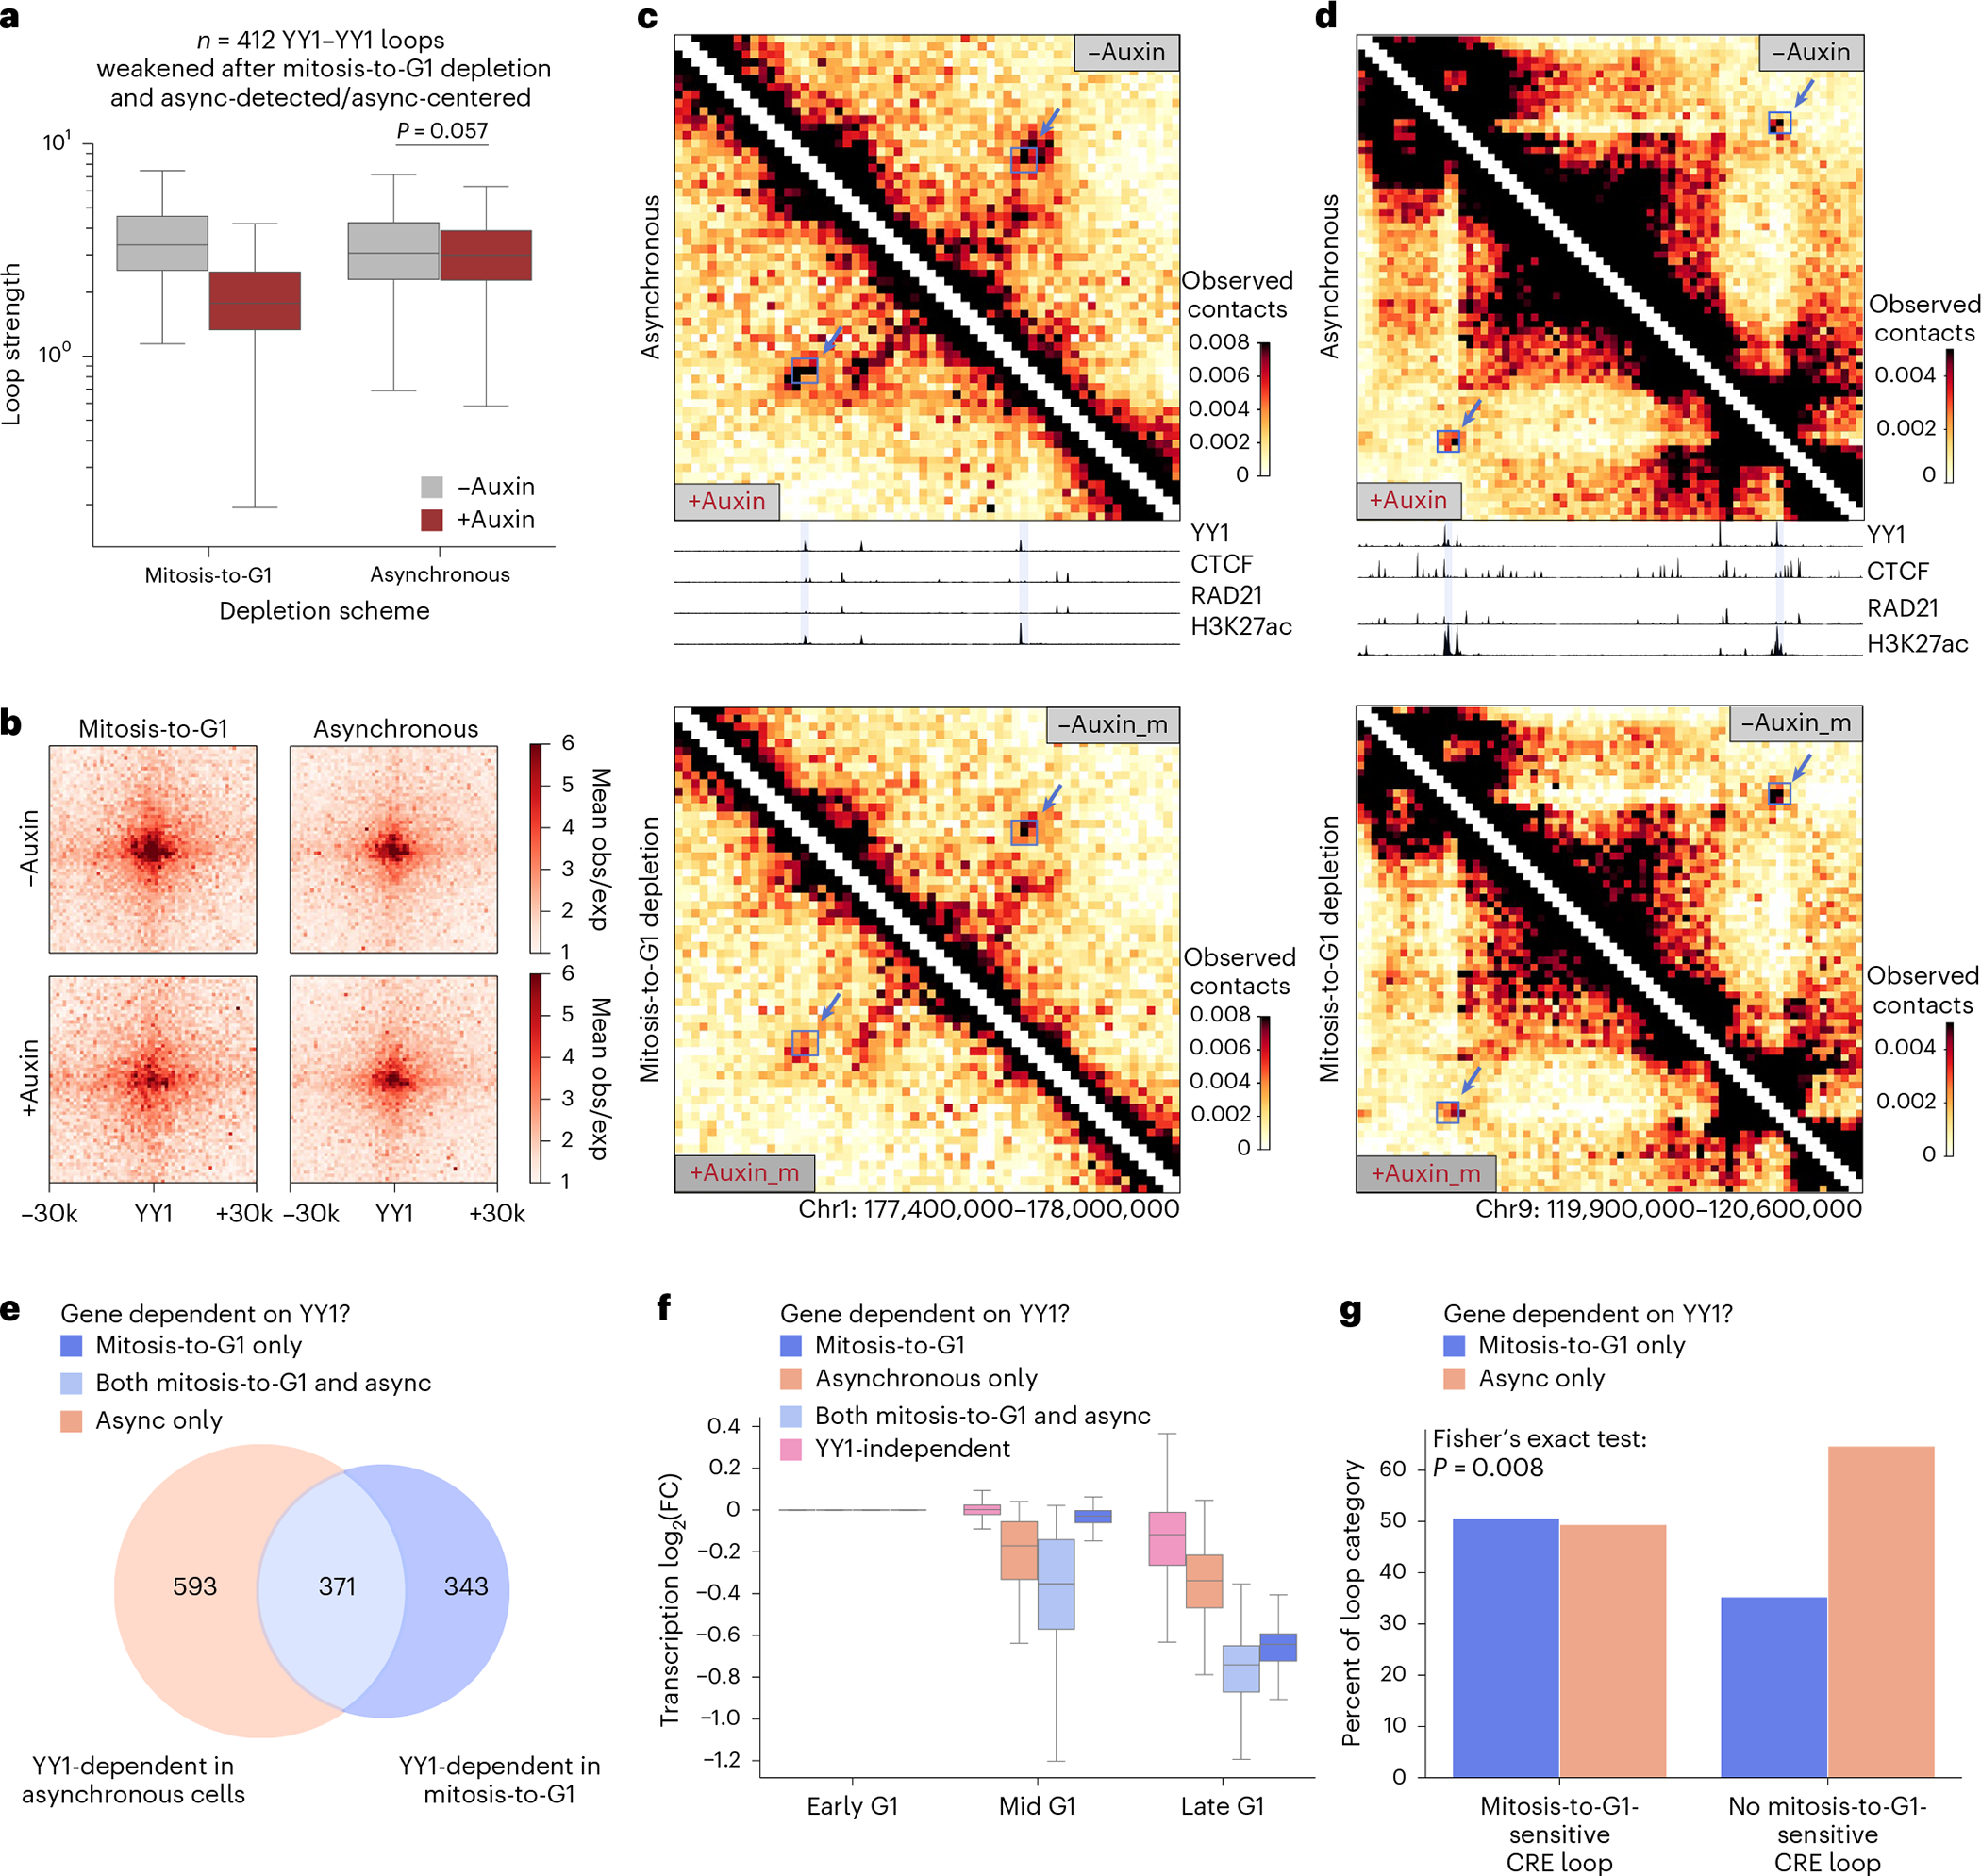
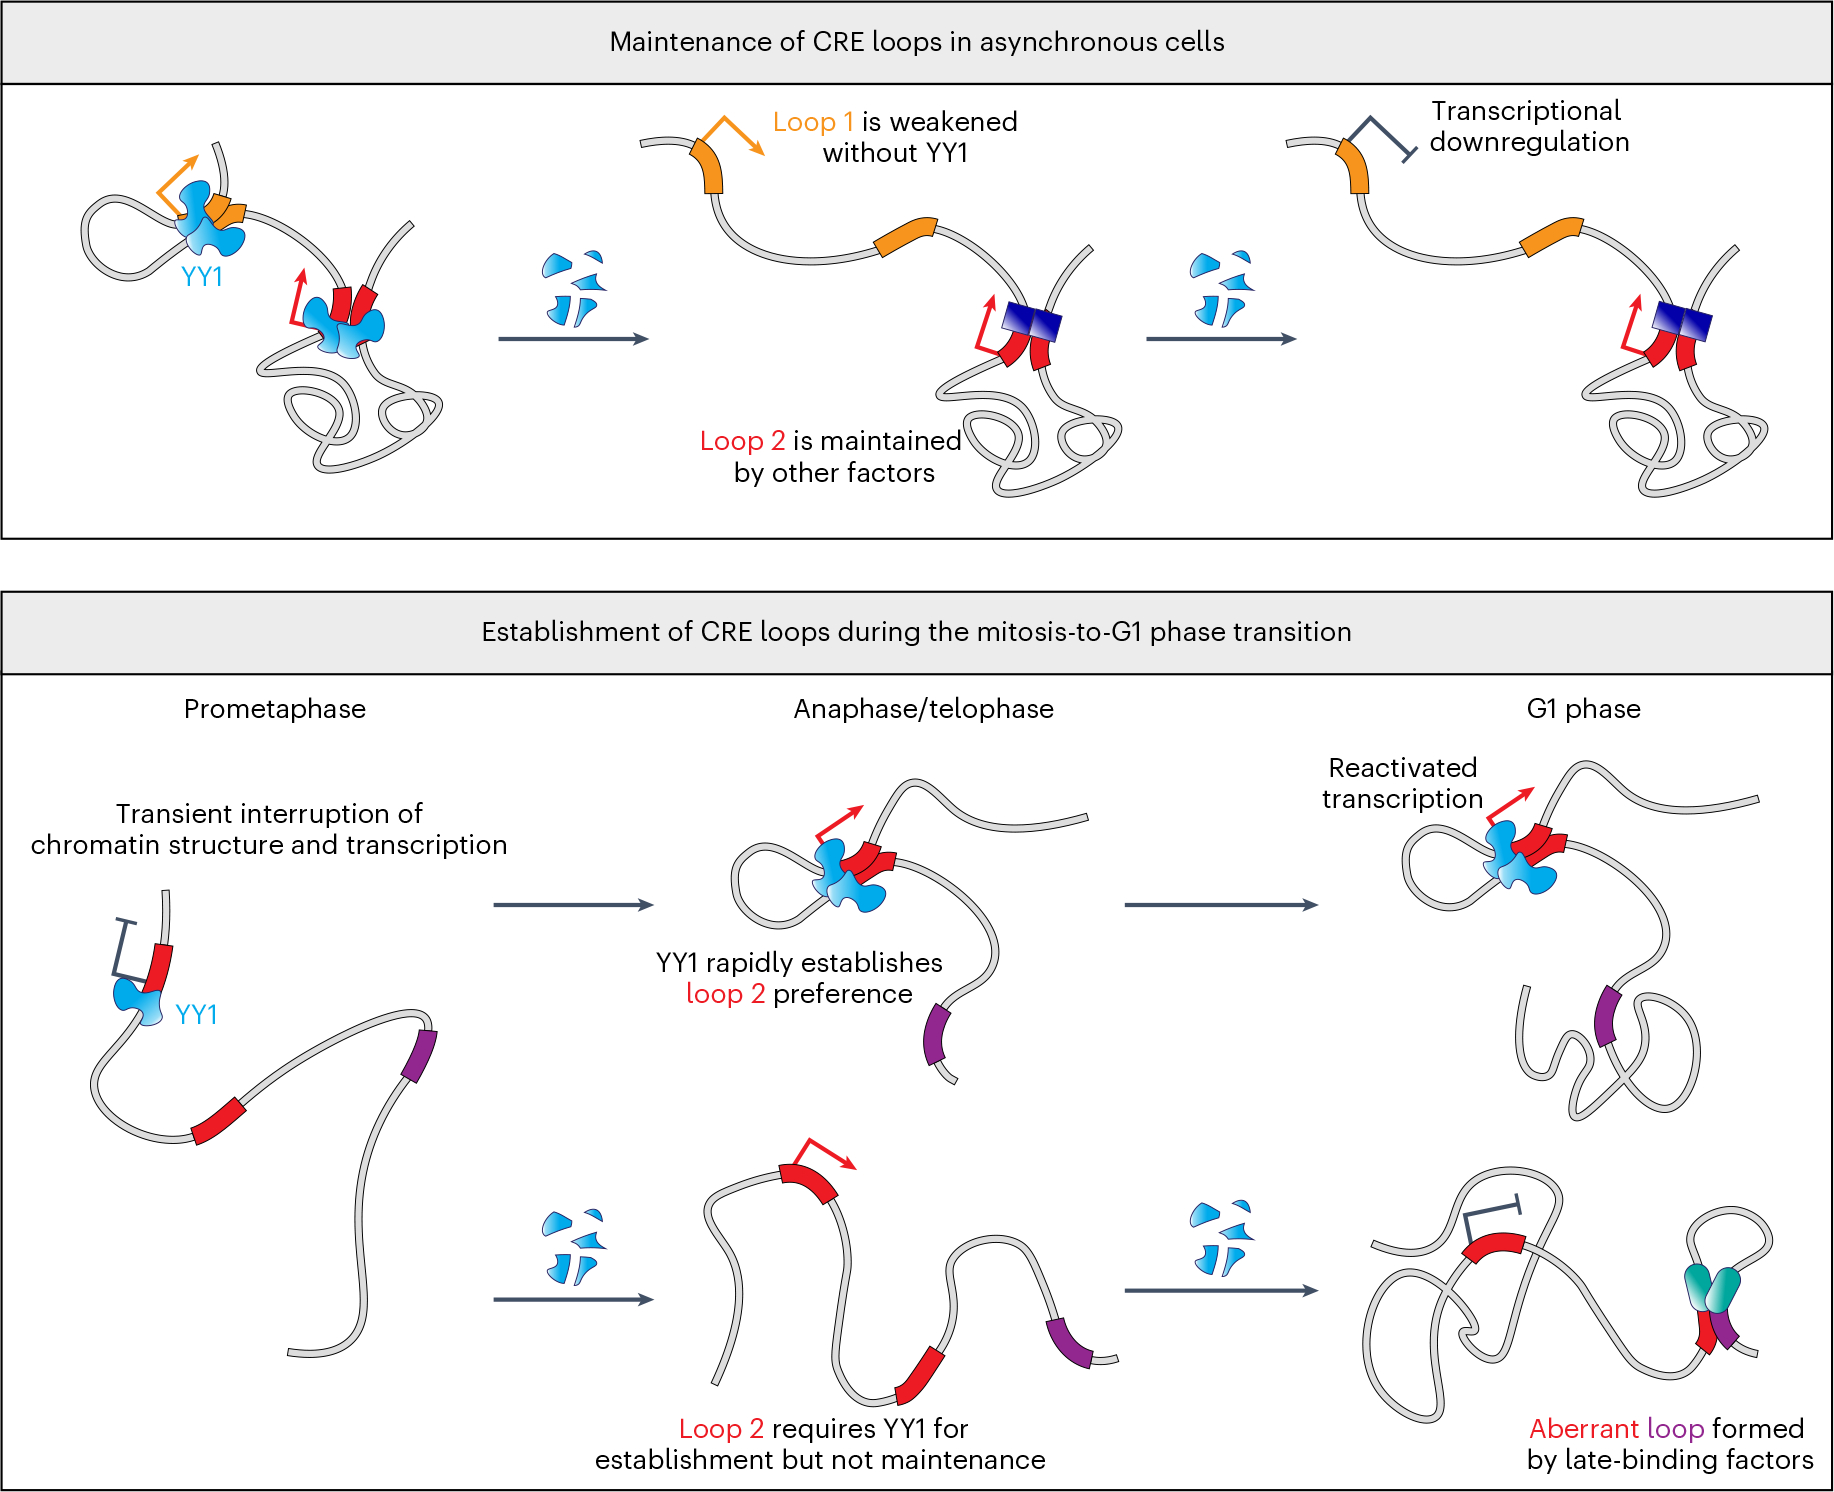
Few transcription factors have been examined for their direct roles in physically connecting enhancers and promoters. Here acute degradation of Yin Yang 1 (YY1) in erythroid cells revealed its requirement for the maintenance of numerous enhancer-promoter loops, but not compartments or domains. Despite its reported ability to interact with cohesin, the formation of YY1-dependent enhancer-promoter loops does not involve stalling of cohesin-mediated loop extrusion. Integrating mitosis-to-G1-phase dynamics, we observed partial retention of YY1 on mitotic chromatin, predominantly at gene promoters, followed by rapid rebinding during mitotic exit, coinciding with enhancer-promoter loop establishment. YY1 degradation during the mitosis-to-G1-phase interval revealed a set of enhancer-promoter loops that require YY1 for establishment during G1-phase entry but not for maintenance in interphase, suggesting that cell cycle stage influences YY1's architectural function. Thus, as revealed here for YY1, chromatin architectural functions of transcription factors can vary in their interplay with CTCF and cohesin as well as by cell cycle stage.


Conflict of interest statement

Competing interests

The authors declare no competing interests.

Figures

Extended Data Fig. 1 |
Extended Data Fig. 1 |. Compartments and domains are maintained in the absence of YY1.
a, YY1-AID cell counts for −auxin and +auxin conditions. Results are shown as mean ± s.d. (n = 3 biological replicates, two-sided independent t-test). b, Western blot for YY1 in parental cells and YY1-AID cells after an auxin time-course. c, Histogram of YY1 ChIP–seq signal at YY1 peaks for −auxin and +auxin conditions. d, ChIP–seq tracks for YY1 (Active Motif antibody), YY1 (Bethyl antibody) and H3K27ac from −auxin and +auxin conditions. e, Heatmaps of YY1 ChIP–seq signal (Bethyl antibody) and mean log2-fold change (+auxin/−auxin) centered on all YY1 peaks (n = 2 biological replicates). f, Micro-C contact versus distance curves for each biological replicate. g, Heatmap of Pearson correlations of compartment eigenvector 1 values (EV1) between biological replicates. h, Micro-C contact maps from −auxin (top) and +auxin (bottom) conditions along with tracks of compartment EV1, with positive values corresponding to A compartment and negative values corresponding to B compartment. i, Histogram of EV1 values from −auxin and +auxin contact maps (n = 25,257 bins). j, Aggregate domain plot for all domains called in the −auxin contact map, centered on upstream and downstream boundaries. k, Histogram of log2 insulation score values from −auxin and +auxin contact maps for all boundaries called across both conditions. l, Histogram of log2 insulation score values from −auxin and +auxin contact maps for the subset of boundaries that have YY1 binding within ±50 kb. m, Micro-C contact maps from −auxin (top) and +auxin (bottom) conditions, annotated with example TAD calls. Corresponding tracks show log2 insulation scores (IS).
Extended Data Fig. 2 |
Extended Data Fig. 2 |. Chromatin loop changes after YY1 depletion in asynchronous cells.
a, Venn diagram of loop calls from −auxin and +auxin contact maps. b, Bar plot of loop change counts, stratified by the condition in which the loop was called. c, Box plot of loop strengths in the −auxin contact map, stratified by loop change (two-sided Mann–Whitney U test). d, Box plot of loop strengths in the +auxin contact map, stratified by loop change (two-sided Mann–Whitney U test). e, Counts of uncategorized loops across categories of looping change and YY1 occupancy. f, Pileup plots of all H3K27ac-H3K27ac and YY1–YY1 loops detected in the −auxin condition, weakened YY1–YY1 loops and strengthened YY1–YY1 loops (1 kb resolution, ±30 kb window). g, Pileup plots of weakened YY1–YY1 loops for individual biological replicates. Loops are centered on YY1 ChIP–seq peaks (n = 555 loops, 1 kb resolution, ±30 kb window). h, Enrichment of different factor occupancy patterns in strengthened CRE loops (*padj < 0.05, two-sided Fisher’s exact test, Benjamini–Hochberg multiple testing correction).
Extended Data Fig. 3 |
Extended Data Fig. 3 |. CTCF, cohesin and LDB1 peaks remain stable upon YY1 depletion.
a, Heatmaps showing CTCF ChIP–seq signal at all CTCF peaks before and after YY1 depletion in asynchronous cells. b, Heatmaps showing RAD21 ChIP–seq signal at all RAD21 peaks before and after asynchronous YY1 depletion. c, Heatmaps showing LDB1 ChIP–seq signal at all LDB1 peaks before and after YY1 depletion in asynchronous cells. d, Heatmaps showing H3K27ac ChIP–seq signal at all H3K27ac peaks before and after YY1 depletion in asynchronous cells. e, Heatmaps showing CTCF, RAD21 and YY1 ChIP–seq signal at their respective peaks before and after CTCF depletion in asynchronous cells. f, Box plot of loop strength fold changes of YY1-independent structural loops after YY1, CTCF or SMC3 depletion. g, Box plot of loop strengths of YY1-independent CRE loops after YY1, CTCF or SMC3 degradation. h, Pileup plots of YY1-independent CRE loops, based on observed/expected signal from 10k resolution YY1-AID, CTCF-AID and SMC3-AID contact maps. i, Box plot of loop strength fold changes of YY1-independent CRE loops after YY1, CTCF or SMC3 depletion. j, Box plot of loop strength fold changes of YY1-dependent CRE loops after YY1, CTCF or SMC3 depletion.
Extended Data Fig. 4 |
Extended Data Fig. 4 |. Examples of YY1-dependent loops after cohesin depletion.
a, Contact maps showing an example of a YY1-dependent loop (blue arrows) that persists after SMC3 depletion. Upper heatmap shows interactions before/after YY1 depletion, and lower heatmap shows interactions before/after SMC3 depletion. Tracks show YY1, CTCF, RAD21 and H3K27ac ChIP–seq in untreated YY1-AID cells. b, A different example of a YY1-dependent loop that persists after SMC3 depletion. c, Histogram plot displaying CRE loop length versus the log2-fold change in loop strength after cohesin depletion in asynchronous cells. d, Box plot displaying CRE loop lengths, stratified for cohesin-dependence and YY1 dependence (two-sided Mann–Whitney U test).
Extended Data Fig. 5 |
Extended Data Fig. 5 |. Maintenance of transcription requires continuous presence of YY1.
a, Principal component analysis (PCA) of individual biological replicates of Pol II ChIP–seq. b, Representative tracks of RPM-normalized YY1 ChIP–seq from untreated YY1-AID cells and Pol II ChIP–seq before/after YY1 depletion from biological replicates of asynchronous cells. c, Histogram plot showing transcription change for genes versus YY1 peak strength at gene promoters (Spearman correlation coefficient = −0.41). d, Histogram of the multiplicity of active genes associated with CRE loops. e, Histogram of the multiplicity of CRE loops associated with active genes. f, Box plot showing transcription changes for different looping configurations at genes that do not have YY1 binding at the promoter (two-sided Mann–Whitney U test; from top to bottom: p = 1e−7, p = 1e−4, p = 0.28). g, Scatter plot showing loop strength change versus transcription change in asynchronous YY1-AID at loops that have YY1 at the distal enhancer but not at the promoter (Spearman correlation coefficient = 0.003). h, Box plot showing log2-fold change in traveling ratio for genes after YY1 depletion in asynchronous cells (two-sided Mann–Whitney U test).
Extended Data Fig. 6 |
Extended Data Fig. 6 |. YY1 chromatin binding dynamics during the mitosis-to-G1 transition.
a, Representative plots of the gating strategy for purification of mitosis-to-G1 populations. b, Heatmap showing the Pearson correlation in YY1 occupancy between biological replicates of YY1 ChIP–seq for mitosis-to-G1 stages. c, YY1 ChIP–qPCR in asynchronous (async) cells and synchronized/sorted prometaphase cells. Primers, labeled with the nearest or overlapping gene, include YY1 binding sites that display mitotic retention as well as sites that have no mitotic retention on ChIP–seq (n = 3 biological replicates). d, Prometaphase YY1 ChIP–seq track plotted alongside in silico generated tracks simulating prometaphase background and various levels of interphase contamination. e, Box plot showing YY1 binding at retained peaks genome-wide for different levels of simulated interphase contamination (two-sided Mann–Whitney U test).
Extended Data Fig. 7 |
Extended Data Fig. 7 |. Compartmentalization and TAD establishment following YY1 depletion.
a, YY1 ChIP–qPCR of synchronized, sorted prometaphase cells after mitosis-to-G1 depletion of YY1 (n = 3 biological replicates). b, Bar plot of the percent of cells in G1 after 2-hour release from nocodazole arrest after mitosis-to-G1 depletion of YY1, as assessed by DAPI signal from flow cytometry (two-sided Mann–Whitney U test). c, Micro-C contact probability curves for all biological replicates. d, Representative Micro-C contact maps with tracks of compartmentalization, with positive eigenvector 1 values (EV1) corresponding to A compartment and negative values corresponding to B compartment. e, Heatmap of Pearson correlations of subcompartment eigenvector 1 (EV1) values between biological replicates. f, Histogram plot of EV1 values after mitosis-to-G1 depletion. g, Histogram of log2 insulation score values for all boundaries detected in the −auxin_m contact map. h, Representative Micro-C contact map annotated with example TAD calls. Tracks show log2 insulation score values. i, Aggregate domain plot for all TADs called in control contact map, centered on upstream and downstream boundaries. j, Box plot showing loop strengths of all mid G1-detected YY1−YY1 loops weakened by mitosis-to-G1 depletion of YY1 (two-sided Mann–Whitney U test). k, Pileup plots corresponding to loops included in j.
Fig. 1 |
Fig. 1 |. YY1 binding is necessary for the maintenance of CRE loops in asynchronous cells.
a, Strategy for engineering a YY1–AID system and acutely depleting YY1 in asynchronous cells. b, YY1 ChIP–seq tracks from −auxin and +auxin conditions. Rectangles above tracks indicate peak calls (n = 3 biological replicates). c, Heatmaps of YY1 ChIP–seq signal and log2(FC) after 4-h YY1 depletion in asynchronous cells, centered on all YY1 peaks and ordered by −auxin peak strength (n = 3 biological replicates). d, Venn diagrams of the overlap between active promoters and YY1 peaks (top) and active enhancers and YY1 peaks (bottom). e, Scatter plot of loop strength in −auxin and +auxin conditions (n = 3 biological replicates). f, Table of loop counts, stratified by loop class, loop change and YY1 occupancy. g, Numbers of changed loops across different loop classes, expressed as a percentage of the total number of loops called in −auxin. h, Schematic representation illustrating examples of patterns of factor occupancy at paired loop anchors (left). Heatmap showing enrichment of different patterns of factor occupancy in weakened CRE loops versus unchanged CRE loops (right). *Padj < 0.05, two-sided Fisher’s exact test, Benjamini–Hochberg multiple testing correction. i, Contact maps from −auxin and +auxin samples with blue arrows/boxes indicating examples of weakened loops and the red box indicating a strengthened loop. Tracks show ChIP–seq from −auxin and +auxin conditions, with highlighted regions corresponding to loop anchors. FC, fold change.
Fig. 2 |
Fig. 2 |. YY1-anchored loops can form independently of CTCF and cohesin.
a, Venn diagram of CTCF, RAD21 and YY1 ChIP–seq peaks from asynchronous, untreated YY1–AID cells. b, Heatmap showing CTCF ChIP–seq peak signal before and after YY1 depletion (n = 2 biological replicates). The signal is centered on CTCF peaks, which overlap with YY1. c, Heatmap showing RAD21 ChIP–seq peak signal before and after YY1 depletion (n = 2 biological replicates). The signal is centered on RAD21 peaks, which overlap with YY1. d, Box plot of loop strengths of YY1-independent structural loops after YY1, CTCF or SMC3 degradation (two-sided Mann–Whitney U test; n = 5 biological replicates for YY1–AID, n = 2 for CTCF–AID and SMC3–AID; n = 4,895 loops). e, Box plot of loop strengths of YY1-dependent CRE loops after YY1, CTCF or SMC3 degradation (two-sided Mann–Whitney U test; n = 5 biological replicates for YY1–AID, n = 2 for CTCF–AID and SMC3–AID; n = 440 loops). f, Pileup plots of YY1-independent structural loops, based on observed/expected signal from 10k resolution YY1–AID, CTCF–AID and SMC3–AID contact maps. g, Pileup plots of YY1-dependent CRE loops, based on observed/expected signal from 1k resolution YY1–AID (left) and 10k resolution YY1–AID, CTCF–AID and SMC3–AID contact maps (right). h, Schematic representation of the approach to quantifying observed contacts within and surrounding loops. i, log2(FC) of observed contacts within and surrounding YY1-independent structural loops (two-sided Mann–Whitney U test; n = 4,895 loops). j, log2(FC) of observed contacts within and surrounding YY1-dependent CRE loops (two-sided Mann–Whitney U test; n = 440 loops). k, Table of the percentages of YY1-dependent loops with loop strength and/or observed contact frequency dependent on cohesin. l, Model of YY1-dependent CRE looping (left), how focal contacts are lost without YY1 (middle) and how the loss of extrusion intermediates can weaken some YY1-dependent CRE loops while some YY1-bound CREs can still connect through random movement of chromatin (right).
Fig. 3 |
Fig. 3 |. Promoter-proximal YY1 binding drives YY1-dependent transcription in asynchronous cells.
a, Volcano plot of changes in total Pol II signal in gene bodies following YY1 depletion in asynchronous cells (n = 3 biological replicates). Inset, a cartoon depicting how gene body was defined (TSS: transcription start site, TES: transcription end site). b, Bar plot of the numbers of active genes with YY1 binding at the promoter, stratified by their differential expression following depletion of YY1. c, Violin plot of YY1 ChIP–seq peak strength at the promoter of nonregulated active genes versus downregulated active genes (two-sided Mann–Whitney U test). d, Bar plot showing the number of CRE loops associated with each category of transcription change. e, Scatter plot showing transcription changes versus E–P loop changes after YY1 depletion.
Fig. 4 |
Fig. 4 |. YY1 is partially retained on mitotic chromatin and rapidly recruited to CRE loop anchors during G1 entry.
a, Schematic representation illustrating the approach to purifying cells at different stages of the mitosis-to-G1 transition. b, Violin plot of YY1 ChIP–seq signal at each timepoint across all YY1 binding sites (n = 3 biological replicates). c, YY1 ChIP–seq tracks across cell cycle stages. Arrows indicate peaks detected at different timepoints. d, Bar plot of the new peaks detected at each mitosis-to-G1 stage. e, Box plot of chromatin accessibility in mitosis for YY1 peaks, stratified by peak detection time. f, Bar graph of the percent of YY1 peaks overlapping with a YY1 motif (inset), stratified by peak detection time. g, Box plot of the motif scores associated with motif-containing YY1 peaks, stratified by peak detection time. h, Enrichment of active promoters relative to active enhancers overlapping with YY1 peaks. i, Heatmap of chromatin accessibility centered on promoter-associated YY1 peaks. j, Bar plot depicting fraction of YY1 peaks that overlap with CRE loop anchors. k, Bar plot depicting fraction of CRE loop anchors that contain YY1 peaks, stratified by YY1 detection timepoint. l, Enrichment of YY1 binding, at either one or both anchors, at CRE loops that emerge at different timepoints. m, Pie charts of YY1 occupancy at all CRE loops (left) and at CRE loops that emerge at anaphase/telophase (right). n, Pie charts of CRE loops that are occupied by YY1–RAD21 overlapping peaks, including peaks that are YY1–RAD21–CTCF cobound (left) and those exclusively occupied by YY1–RAD21 (right). o, Heatmap showing clusters of loop dynamics across the mitosis-to-G1 interval. Each row represents each loop, and each column represents one stage. p, Same as o, except only the loops that are dependent on YY1 in asynchronous cells. q, Line plots showing averaged YY1 ChIP–seq peak strengths throughout the mitosis-to-G1 transition for peaks overlapping with each CRE loop cluster.
Fig. 5 |
Fig. 5 |. YY1 recruitment dynamics and requirements for CRE loop establishment during the mitosis-to-G1 transition.
a, Experimental approach to mitosis-to-G1 depletion of YY1. b, Scatter plot of loop strengths in −auxin_m and +auxin_m samples for all loops detected in mid G1. c, Percent of loops changed within each loop class, expressed as a percentage of the loops called in the −auxin_m condition. d, Hi-C contact maps at mitosis-to-G1 stages showing the formation of a YY1-dependent loop (blue arrow), with stage-matched ChIP–seq tracks of YY1, CTCF and RAD21. e, Effects of mitosis-to-G1 depletion on the YY1-dependent loop depicted in d (blue arrow). f, Pileup plots of YY1-dependent loops based on mitosis-to-G1 Hi-C maps in the parental cell line (bottom) and the YY1 peaks located in their loop anchors (top). g, Box plot showing observed contacts of YY1-dependent loops that are included in the pileups in f. h, Box plot showing loop strengths of YY1-dependent loops that are included in the pileups in f. i, Scatter plot of YY1 peak strengths and associated loop strengths for YY1-dependent loops that are included in the pileups in f.
Fig. 6 |
Fig. 6 |. Transcriptional kinetics in G1 entry after depletion of YY1.
a, Scatter plots showing log2(FC) in gene body Pol II signal in early, mid and late G1 after YY1 depletion in the mitosis-to-G1 phase interval. b, Heatmap of log2(FC) for genes downregulated following mitosis-to-G1 depletion of YY1. Each row represents one gene. c, Bar plot of numbers of downregulated genes at each timepoint that has a YY1 ChIP–seq peak at the promoter, stratified by time of YY1 detection. d, Bar plot of the number of genes associated with weakened CRE loops versus unchanged CRE loops, stratified by the genes’ YY1 dependence. e, Box plot of E–P loop changes associated with nonregulated, downregulated and upregulated genes (two-sided Mann–Whitney U test).
Fig. 7 |
Fig. 7 |. Cell-cycle-dependent YY1 requirements for CRE loop formation.
a, Box plot showing loop strengths of YY1–YY1 loops weakened by mitosisto-G1 depletion of YY1 (two-sided Mann–Whitney U test). Only loops called in both mid G1 and asynchronous cells are included. Loop coordinates from asynchronous cells were used in instances where loop centers were adjacent but not identical. b, Pileup plots corresponding to loops included in a. c, Example of a loop insensitive to YY1 depletion in asynchronous cells (top) but sensitive to mitosis-to-G1 depletion (bottom). ChIP–seq tracks from asynchronous YY1–AID cells are shown. The same loop is highlighted in Fig. 5d. d, Another example of a loop that is more sensitive to mitosis-to-G1 depletion. e, Venn diagram of genes downregulated after YY1 depletion in asynchronous cells and genes downregulated after YY1 depletion in the mitosis-to-G1 transition. f, Box plot showing log2(+auxin/−auxin) transcriptional change at different G1 stages. Genes are stratified based on the depletion scheme in which they were YY1-dependent. g, Bar plot showing the percentage of genes that overlap with a CRE loop weakened only in the mitosis-to-G1 interval. Genes are stratified based on the depletion scheme in which they were YY1-dependent.
Fig. 8 |
Fig. 8 |. Model for CRE loop establishment and maintenance following mitosis.
In asynchronous cells (top), certain CRE loops are sensitive to YY1 depletion (for example, loop 1), while others can be maintained by other factors besides YY1 (for example, loop 2). Transcriptional downregulation can occur due to the loss of a CRE loop. In the mitosis-to-G1 transition (bottom), YY1 binding rapidly establishes the specificity of CRE pairing in anaphase/telophase and initiates transcription in G1. When YY1 is depleted throughout the mitosis-to-G1 transition, YY1-dependent CRE loops fail to establish, subsequently enabling late-binding factors to form aberrant loops. For certain loops (for example, loop 2), YY1 is required to establish looping and transcription after mitosis but is dispensable for their maintenance in interphase. Loops can dynamically form and dissolve within each stage, so the illustration of maintained loops represents the preserved frequency of looping rather than a stable structure across multiple timepoints.

Similar articles

Cited by

References

    1. Furlong EEM & Levine M Developmental enhancers and chromosome topology. Science 361, 1341–1345 (2018). - PMC - PubMed
    1. Zheng H & Xie W The role of 3D genome organization in development and cell differentiation. Nat. Rev. Mol. Cell Biol. 20, 535–550 (2019). - PubMed
    1. Zhang H & Blobel GA Genome folding dynamics during the M-to-G1-phase transition. Curr. Opin. Genet Dev. 80, 102036 (2023). - PMC - PubMed
    1. Fudenberg G et al. Formation of chromosomal domains by loop extrusion. Cell Rep. 15, 2038–2049 (2016). - PMC - PubMed
    1. Davidson IF et al. DNA loop extrusion by human cohesin. Science 366, 1338–1345 (2019). - PubMed

MeSH terms

Grants and funding