

Integration of mass cytometry and mass spectrometry imaging for spatially resolved single-cell metabolic profiling
- PMID: 39210066
- PMCID: PMC11466816
- DOI: 10.1038/s41592-024-02392-6
Integration of mass cytometry and mass spectrometry imaging for spatially resolved single-cell metabolic profiling
Abstract
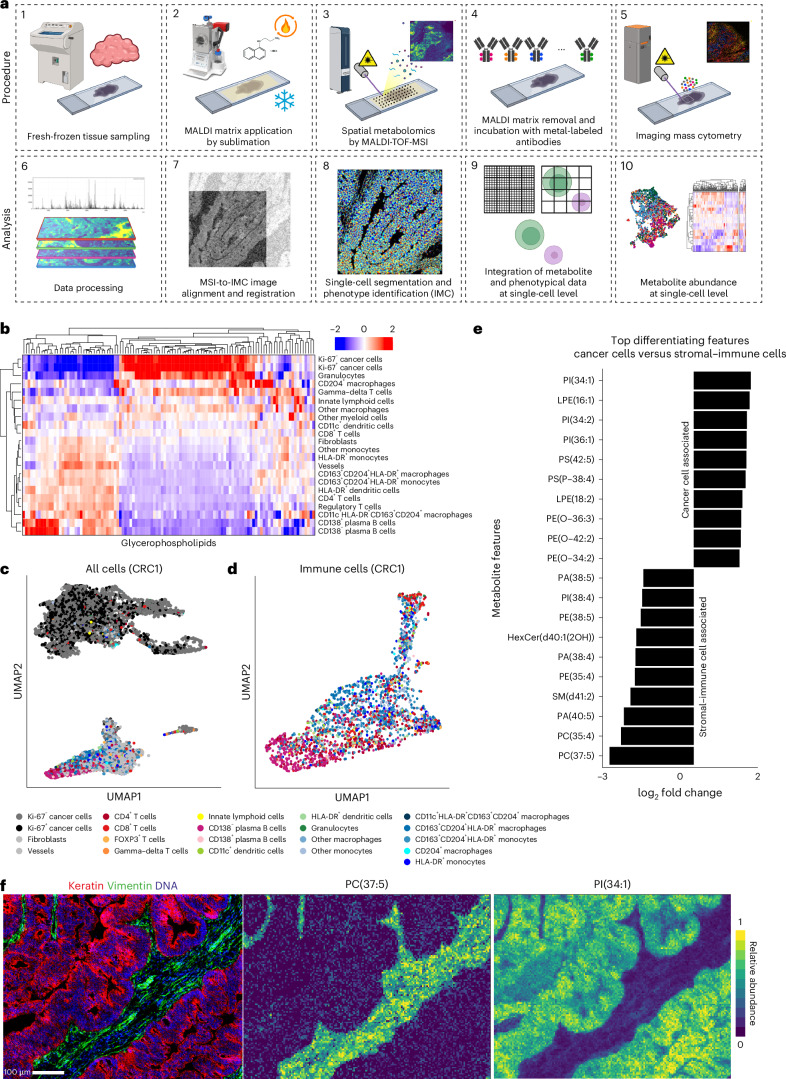
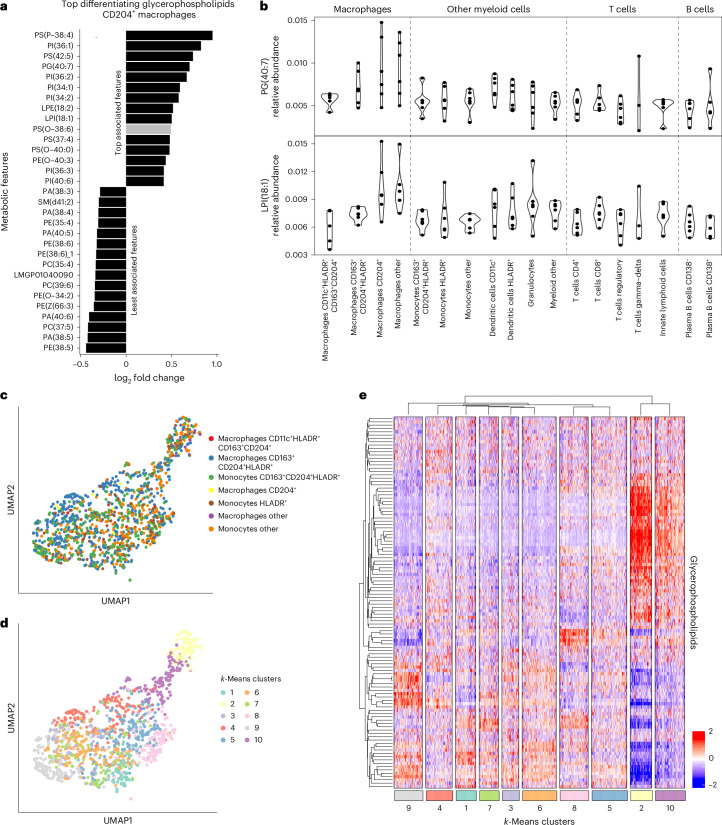
The integration of spatial omics technologies can provide important insights into the biology of tissues. Here we combined mass spectrometry imaging-based metabolomics and imaging mass cytometry-based immunophenotyping on a single tissue section to reveal metabolic heterogeneity at single-cell resolution within tissues and its association with specific cell populations such as cancer cells or immune cells. This approach has the potential to greatly increase our understanding of tissue-level interplay between metabolic processes and their cellular components.
© 2024. The Author(s).
Conflict of interest statement
B.H. is presently employed by Bruker Corporation; however, this affiliation was not in place at the time of submission. The other authors declare no competing interests.
Figures


Similar articles
-
De novo discovery of metabolic heterogeneity with immunophenotype-guided imaging mass spectrometry.Mol Metab. 2020 Jun;36:100953. doi: 10.1016/j.molmet.2020.01.017. Epub 2020 Feb 14. Mol Metab. 2020. PMID: 32278304 Free PMC article.
-
Spatially Resolved Mass Spectrometry at the Single Cell: Recent Innovations in Proteomics and Metabolomics.J Am Soc Mass Spectrom. 2021 Apr 7;32(4):872-894. doi: 10.1021/jasms.0c00439. Epub 2021 Mar 3. J Am Soc Mass Spectrom. 2021. PMID: 33656885 Free PMC article. Review.
-
Single-Cell Metabolomics by Mass Spectrometry.Methods Mol Biol. 2020;2064:1-8. doi: 10.1007/978-1-4939-9831-9_1. Methods Mol Biol. 2020. PMID: 31565762
-
Immunophenotyping by Mass Cytometry.Methods Mol Biol. 2019;2032:31-51. doi: 10.1007/978-1-4939-9650-6_2. Methods Mol Biol. 2019. PMID: 31522411
-
Metabolic Imaging at the Single-Cell Scale: Recent Advances in Mass Spectrometry Imaging.Annu Rev Anal Chem (Palo Alto Calif). 2019 Jun 12;12(1):201-224. doi: 10.1146/annurev-anchem-061318-115516. Epub 2019 Mar 8. Annu Rev Anal Chem (Palo Alto Calif). 2019. PMID: 30848927 Review.
Cited by
-
Multimodal bioimaging across disciplines and scales: challenges, opportunities and breaking down barriers.Npj Imaging. 2024 Mar 1;2(1):5. doi: 10.1038/s44303-024-00010-w. Npj Imaging. 2024. PMID: 40603654 Free PMC article. Review.
-
Omics-based Approach Towards Macrophages: New Perspectives of Biology and Function in the Normal and Diseased Heart.Int J Biol Sci. 2025 May 27;21(8):3666-3688. doi: 10.7150/ijbs.112061. eCollection 2025. Int J Biol Sci. 2025. PMID: 40520014 Free PMC article. Review.
-
MIMIC: a flexible pipeline to register and summarize IMC-MSI experiments.bioRxiv [Preprint]. 2025 Jul 23:2025.07.08.663623. doi: 10.1101/2025.07.08.663623. bioRxiv. 2025. PMID: 40672226 Free PMC article. Preprint.
-
Super Resolved Single-Cell Spatial Metabolomics from Multimodal Mass Spectrometry Imaging guided by Imaging Mass Cytometry.bioRxiv [Preprint]. 2024 Oct 24:2024.10.21.619323. doi: 10.1101/2024.10.21.619323. bioRxiv. 2024. PMID: 39484548 Free PMC article. Preprint.
-
Cell-type deconvolution methods for spatial transcriptomics.Nat Rev Genet. 2025 May 14. doi: 10.1038/s41576-025-00845-y. Online ahead of print. Nat Rev Genet. 2025. PMID: 40369312 Review.
References
-
- Wang, G. et al. Spatial dynamic metabolomics identifies metabolic cell fate trajectories in human kidney differentiation. Cell Stem Cell29, 1580–93 e7 (2022). - PubMed
MeSH terms
Grants and funding
- 852832/EC | EU Framework Programme for Research and Innovation H2020 | H2020 Priority Excellent Science | H2020 European Research Council (H2020 Excellent Science - European Research Council)
- 09150172110092/ZonMw (Netherlands Organisation for Health Research and Development)
- 21OK+015/Nierstichting (Dutch Kidney Foundation)
- NNF21CC0073729/Novo Nordisk Fonden (Novo Nordisk Foundation)
LinkOut - more resources
Full Text Sources
