. 2024 Oct;27(10):1892-1903.
doi: 10.1038/s41593-024-01743-y. Epub 2024 Aug 29.

Characteristics of blood-brain barrier heterogeneity between brain regions revealed by profiling vascular and perivascular cells

Affiliations

Characteristics of blood-brain barrier heterogeneity between brain regions revealed by profiling vascular and perivascular cells

Sarah J Pfau et al. Nat Neurosci. 2024 Oct.

Abstract

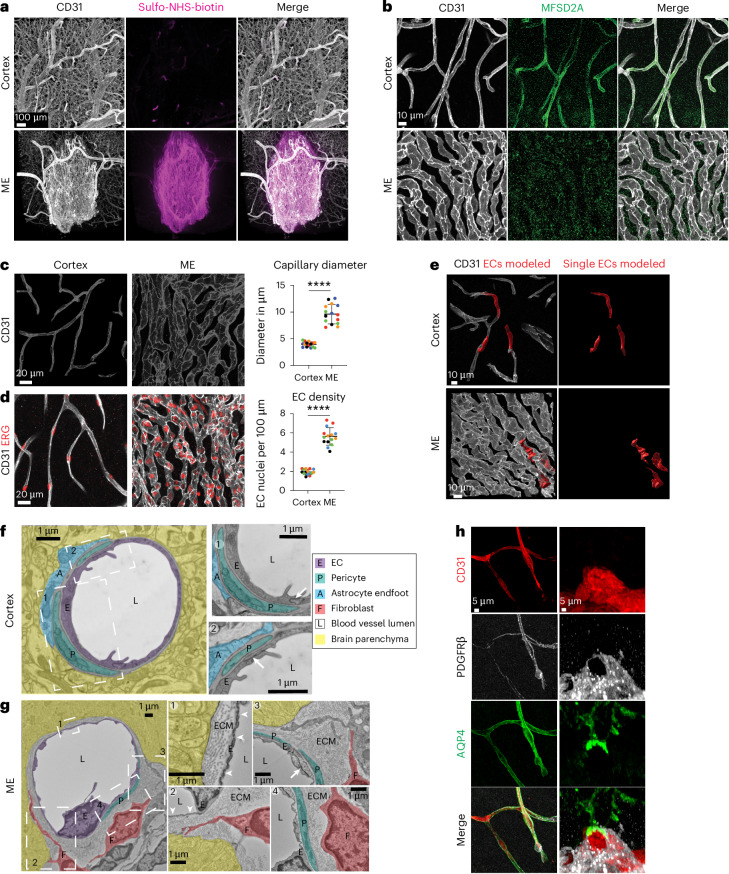
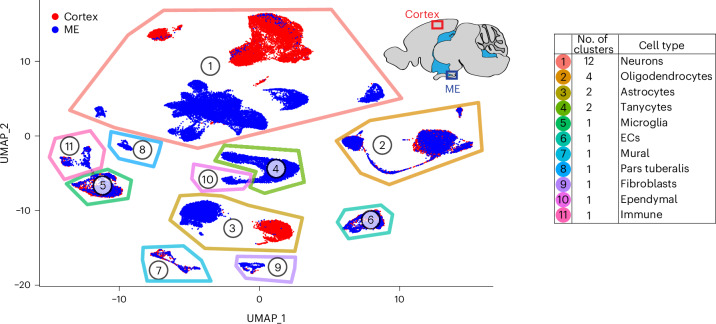
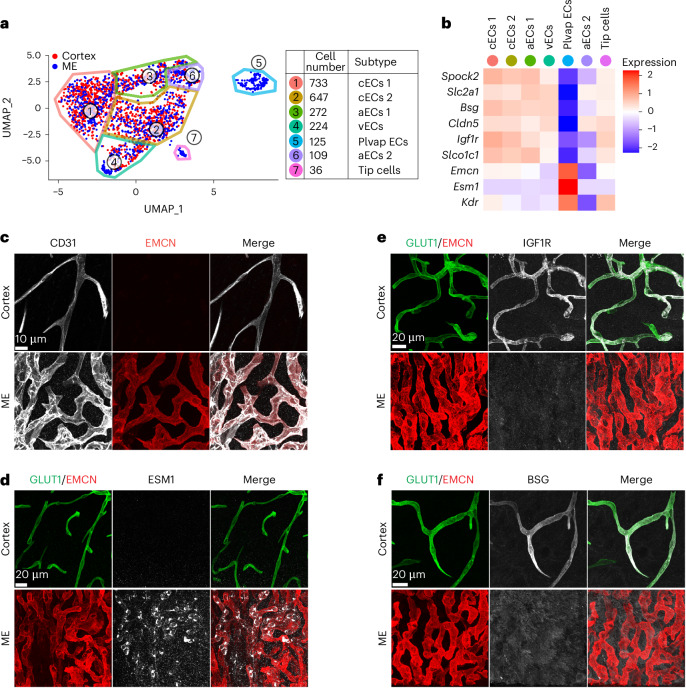
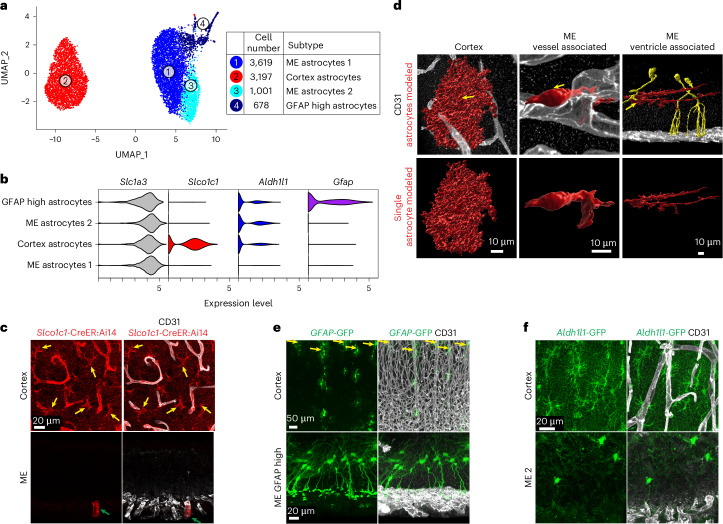
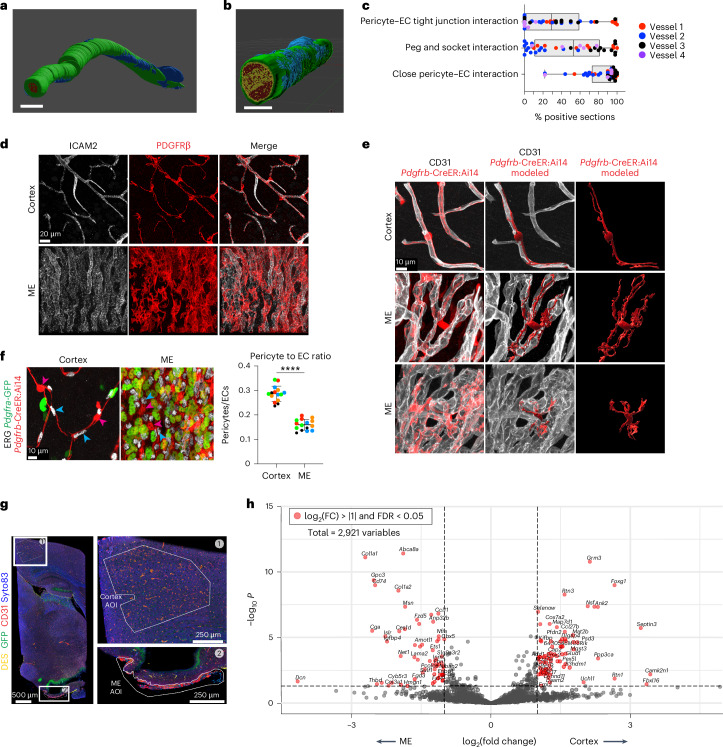
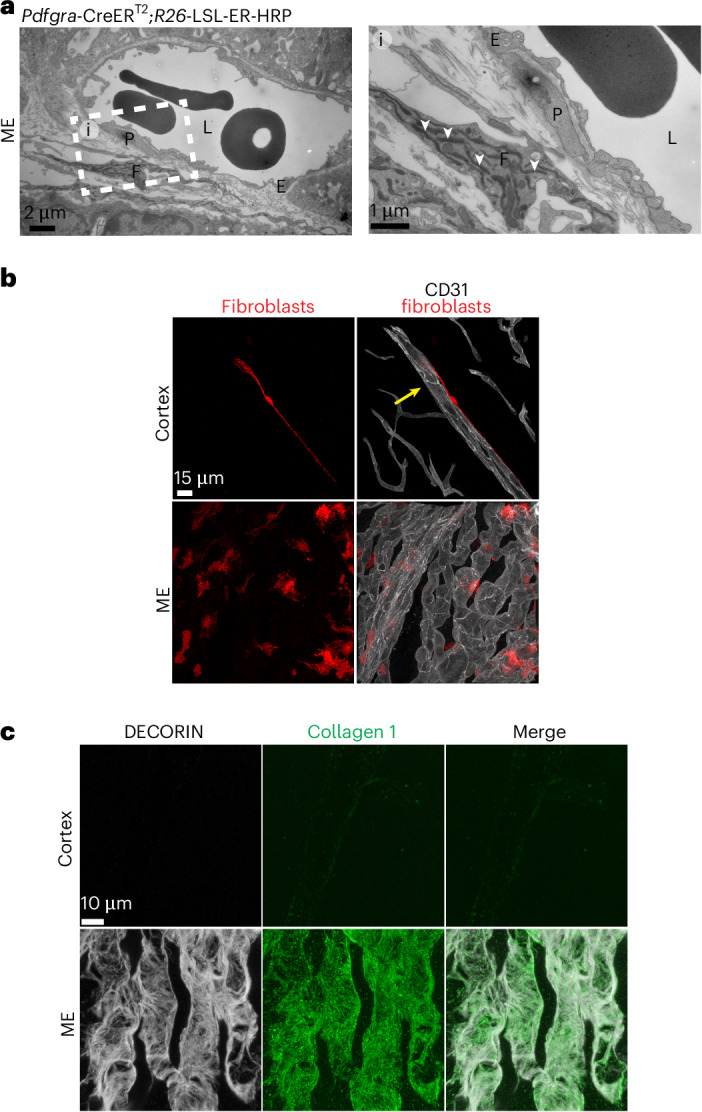
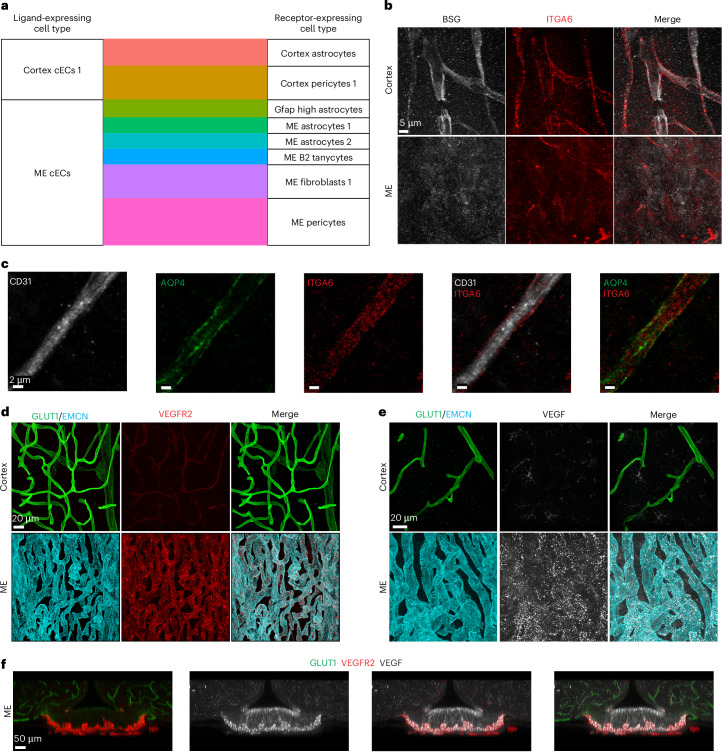
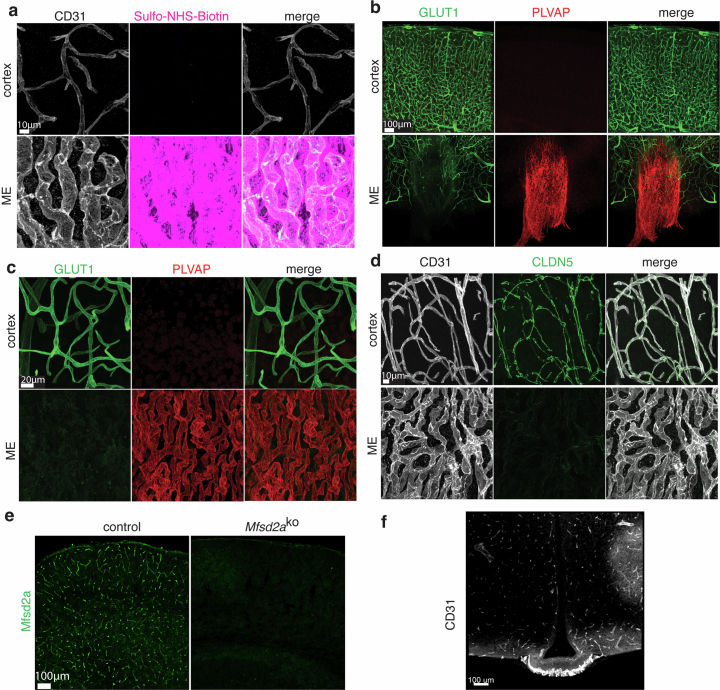
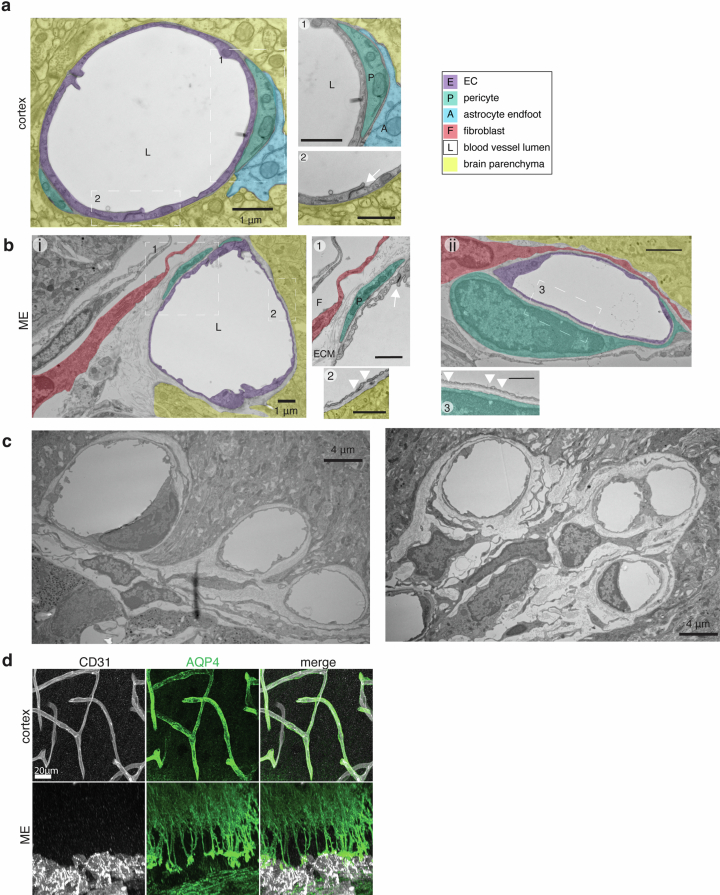
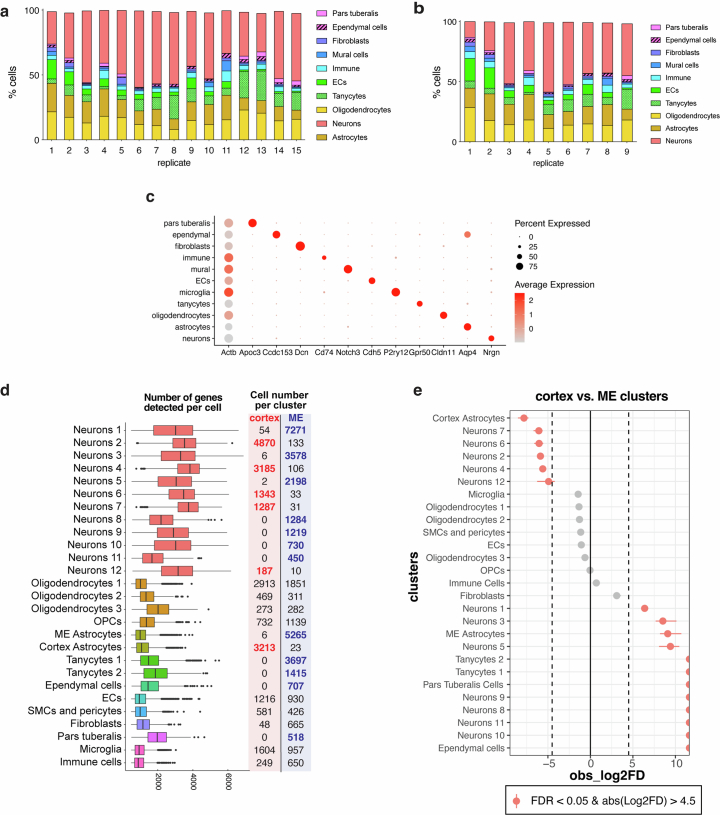
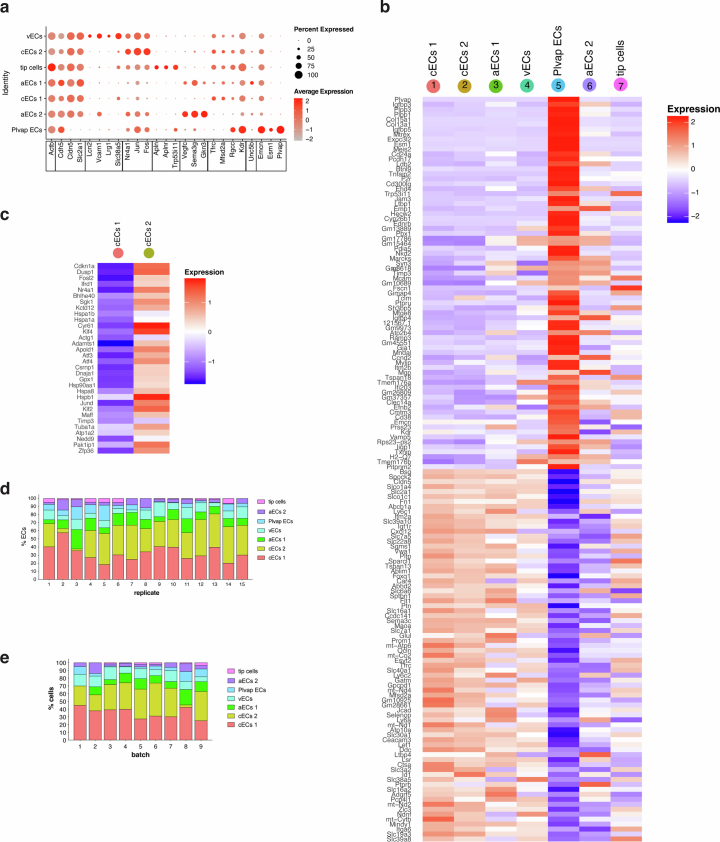
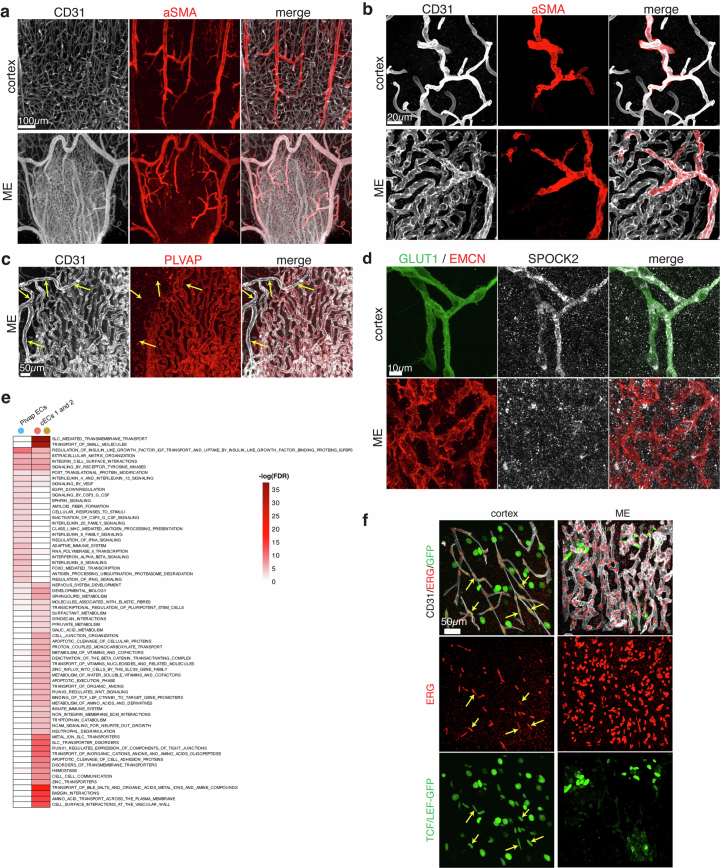
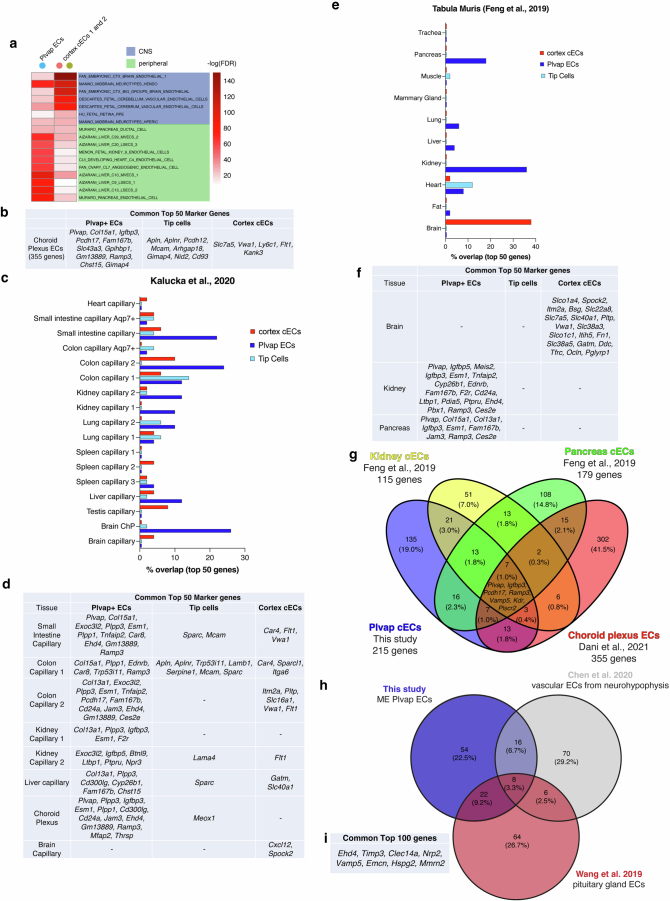
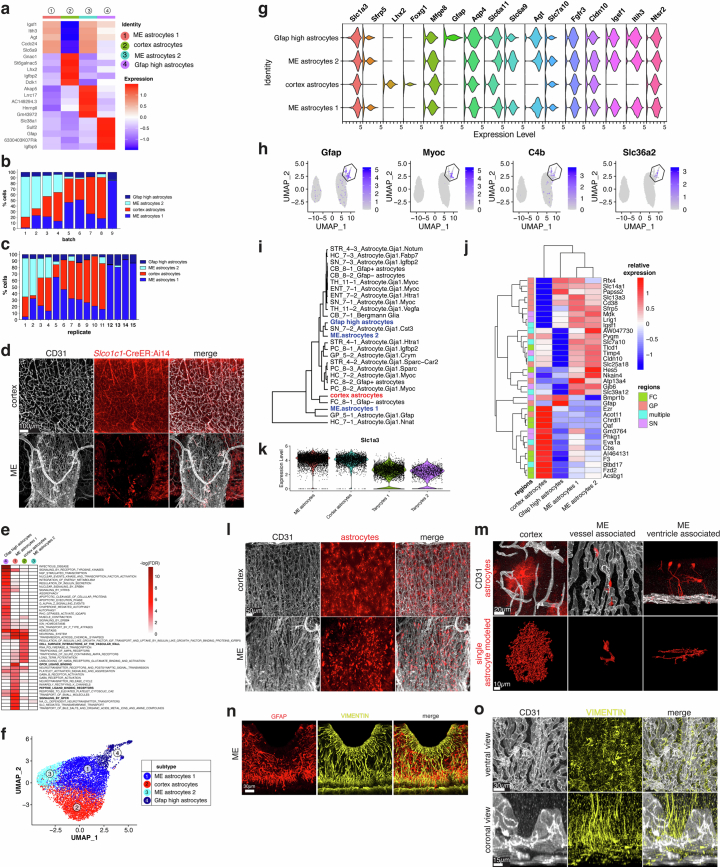
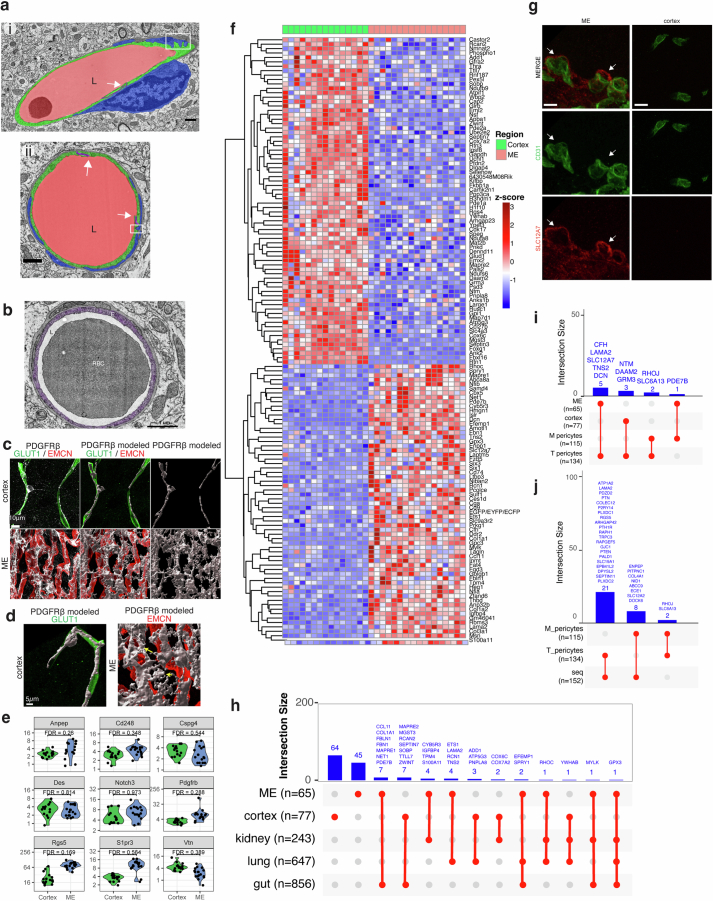
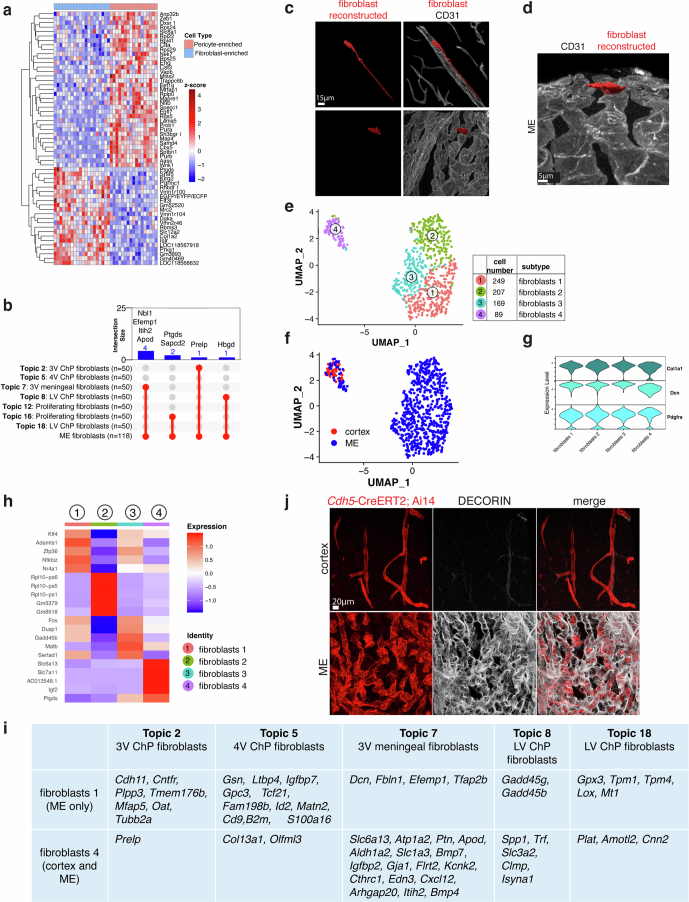
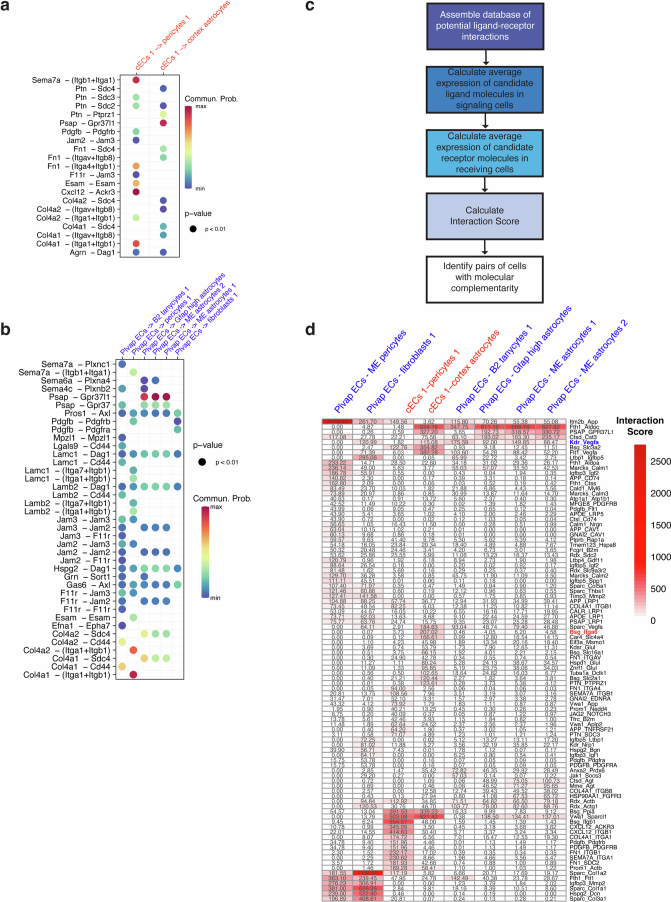
The blood-brain barrier (BBB) protects the brain and maintains neuronal homeostasis. BBB properties can vary between brain regions to support regional functions, yet how BBB heterogeneity occurs is poorly understood. Here, we used single-cell and spatial transcriptomics to compare the mouse median eminence, one of the circumventricular organs that has naturally leaky blood vessels, with the cortex. We identified hundreds of molecular differences in endothelial cells (ECs) and perivascular cells, including astrocytes, pericytes and fibroblasts. Using electron microscopy and an aqueous-based tissue-clearing method, we revealed distinct anatomical specializations and interaction patterns of ECs and perivascular cells in these regions. Finally, we identified candidate regionally enriched EC-perivascular cell ligand-receptor pairs. Our results indicate that both molecular specializations in ECs and unique EC-perivascular cell interactions contribute to BBB functional heterogeneity. This platform can be used to investigate BBB heterogeneity in other regions and may facilitate the development of central nervous system region-specific therapeutics.


Conflict of interest statement

The authors declare no competing interests.

Figures

Fig. 1
Fig. 1. Morphological and functional differences of the vasculature between the ME and cortex.
a, Tracer leakage assay with tracer sulfo-NHS-biotin (magenta) and immunostaining for blood vessels (CD31, white) in cortex (upper panel) and ME (lower panel) following U.Clear. Tracer in circulation was washed out by perfusion before analysis. b, Co-immunostaining of CD31 (white) and MFSD2A (green) in cortex and ME. c, High-magnification images of capillaries (CD31) highlighting vessel morphology in cortex and ME (left) and quantification of vessel diameter (right) (n = 5 mice, three images per region in each mouse, with the same colors showing points from the same mice). Data presented as mean ± s.d., P = 3.604601 × 10−6, nested two-tailed t-test. d, High-magnification images of capillaries (CD31, white) and EC nuclei (ERG, red) in the cortex and ME (left). Quantification shows EC density, number of endothelial cell nuclei (ERG+) over the length of capillaries (n = 5 mice, three images per region in each mouse, with the same colors showing points from the same mice). Data presented as mean ± s.d., P = 4.569415 × 10−6, nested two-tailed t-test. e, Immunostaining and 3D reconstruction of three single Tomato+ ECs (red) within capillaries (CD31, white) in cortex and ME. Single ECs were labeled by a single low-dose injection of 4OH-tamoxifen in adult Cdh5-CreER:Ai14 mice 1 week before analysis. f, TEM images of a cortex capillary. Pseudocolors highlight different cells: cEC (E), pericyte (P), astrocyte endfoot (A), lumen (L) and neuropil. Insets show cEC tight junctions (white arrows), pericyte cells and astrocyte endfeet. g, TEM images of an ME blood vessel. Pseudocolors (as in f) highlight different cells: cECs, pericyte, fibroblast, lumen and neuropil. Insets show capillary fenestrations (white arrowheads), cEC tight junctions (white arrows), extracellular matrix-filled perivascular space (ECM), pericyte cells and fibroblast cells. h, Immunostaining for CD31 (red), mural cell marker PDGFRβ (white) and astrocyte endfoot marker aquaporin 4 (AQP4, green) in cortex (left) and ME (right).
Fig. 2
Fig. 2. ME and cortex cell types profiled by scRNA-seq.
a, Uniform manifold approximation and projection (UMAP) plot of 58,238 single-cell transcriptomes (35,934 from ME and 22,304 from cortex). Cell-type clusters were annotated post hoc based on their transcriptional profiles (Methods). The number of clusters identified for each cell type is indicated in the plot legend.
Fig. 3
Fig. 3. ME contains region-specific cECs.
a, UMAP plot of 2,284 EC transcriptomes. Seven subtypes of ECs were identified with an unbiased analysis based on their transcriptional profiles (see Extended Data Fig. 4a). The number of each cell subtype profiled is indicated in the plot legend. b, Heatmap illustrating the average relative expression of regionally enriched genes in each subtype cluster identified in a that were validated by immunostaining. Regionally enriched genes show an average log2(fold change) > 0.6 (>1.5-fold change in expression) with an adjusted P < 0.05 by two-sided Wilcoxon test. c, Co-immunostaining for ME cEC-enriched EMCN (red) with CD31 (white) in cortex and ME. d, Co-immunostaining for ME cEC-enriched ESM1 (white), EMCN (red) and cortex cEC-enriched protein GLUT1 (green) in cortex and ME. e, Co-immunostaining for cortex cEC-enriched IGF1R (white), ME cEC-enriched protein EMCN (red) and cortex cEC-enriched protein GLUT1 (green) in cortex and ME. f, Co-immunostaining for cortex cEC-enriched BSG (white), GLUT1 (green) and EMCN (red) in cortex and ME.
Fig. 4
Fig. 4. Distinct ME astrocyte subtypes observed with unique interactions with blood vessels.
a, UMAP plot of 8,508 astrocyte transcriptomes. Astrocyte subtypes were identified with an unbiased analysis. The number of each cell subtype profiled is indicated in the plot legend. b, Violin plot showing the expression level of a subset of differentially expressed genes in each cluster identified in a. Differentially expressed genes show an average log2(fold change) of >0.6 (>1.5-fold change in expression) with an adjusted P value of <0.05 by two-sided Wilcoxon test. For comparison of ME astrocyte populations, coronal orientation is shown in each ME panel in cf, with blood vessels on the bottom and the third ventricle toward the top. c, Left: Tomato in the cortex and ME of Slco1c1-CreER:Ai14 mice. Tomato (red) indicates Slco1c1 expression. Right: co-staining of CD31 (blood vessels, white). Note Tomato expression in cortex capillaries and astrocytes, but not ME capillaries and astrocytes. Single Tomato+ vessel in ME (green arrow) is arterial. Yellow arrows point at astrocytes in the cortex. d, Fluorescent labeling of astrocytes in cortex and ME using Glast-CreER:Ai14 mice after low-dose 4OH-tamoxifen to achieve sparse cell labeling. Top row shows immunostaining for Tomato+ astrocytes (red) and blood vessels (CD31, white). Yellow arrow indicates the location of the cell body, as determined by DAPI staining. Bottom row displays 3D reconstructions of astrocytes (red). Cells modeled in yellow are tanycytes. For a comparison of different astrocyte populations with the same scales, see Extended Data Fig. 7b. e, Left: GFP (green) in the cortex and ME of GFAP-GFP mice. Right: co-staining for CD31 (white, vessels). In the cortex, GFP only sparsely labeled peri-arterial astrocytes (yellow arrows). Scale bar, 50 µm in the top row and 20 µm in the middle and lower rows. f, Left: fluorescent labeling (green) of cortex astrocytes and ventricle-associated ME 2 astrocytes using Aldh1l1-GFP mice. Right: co-staining for CD31 (white) to label capillaries.
Fig. 5
Fig. 5. Pericytes associated with cortex and ME blood vessels show distinct molecular, morphological and anatomical features.
a,b, Serial TEM reconstruction of EC and pericyte interactions in two cortex blood vessels. ECs are shown in green, pericytes in blue and the blood vessel lumen in red. Scale bars, 5 µm. c, Quantification of three features of pericyte–EC interaction in vessels in a and b and two additional vessels (n = 4 total vessels from one animal), displayed as a percentage of sections showing each feature. Each point represents a 50-section increment. Whiskers span the smallest and largest values, and the boxplot shows the median and first and third quantiles. d, Co-immunostaining for pan-pericyte marker PDGFRβ (red) and pan-EC marker ICAM2 (white) in cortex and ME. e, Immunostaining and 3D reconstruction of single Tomato+ pericytes (red) in touch with capillaries (CD31, white) in cortex and ME (two examples). Single pericytes labeled by single low-dose injection of 4OH-tamoxifen in adult Pdgfrb-CreER:Ai14 mice 1 week before analysis. f, Left: co-immunostaining for EC nuclei marker ERG (white) and pericytes labeled using Pdgfrb-CreER:Ai14; Pdgfra-GFP mice. Magenta arrowheads point at GFPTomato+ pericytes; cyan arrowheads point at ERG+ EC nuclei. Right: quantification of pericyte (GFPTomato+) to EC (ERG+) ratio using Pdgfra-H2B-GFP; Pdgfrb-CreER:Ai14 mice (n = 5 mice, for quantification three images per region and mouse were taken, same colors refer to same mice, data presented as mean ± s.d., P = 4.793057 × 10−6, nested two-tailed t-test). g, Co-immunostaining for pericyte marker desmin (DES, yellow), GFP (to visualize Pdgfra-H2B-EGFP in fibroblasts, green), EC marker CD31 (red) and nuclear marker Syto83 (blue) for GeoMX area of interest morphological identification. h, Volcano plot of differentially expressed genes between ME and cortex pericyte-enriched region of interest from GeoMX whole transcriptome profiling (also shown in Extended Data Fig. 8f). Differential expression was determined by linear mixed model analysis and significance assessed by FDR. Red points show log2(fold change) > |1| and FDR < 0.05 between cortex and ME pericyte-enriched regions of interest.
Fig. 6
Fig. 6. ME contains capillary-associated fibroblasts.
a, TEM images of Pdgfra-CreER HRP reporter after DAB reaction in the ME. HRP is detected in the endoplasmic reticulum (white arrowheads) of Pdgfra-expressing fibroblast cells. b, Fluorescent labeling of fibroblasts in the cortex and ME using Pdgfra-CreER:Ai14 mice after low-dose 4OH-tamoxifen to achieve sparse cell labeling. Left: Tomato+ fibroblasts (red). Right column: merged with immunostaining for CD31 (white). Yellow arrow indicates artery. c, Co-immunostaining for fibroblasts with DECORIN (white) and collagen 1 (green) in cortex and ME.
Fig. 7
Fig. 7. Differential intercellular signaling capacity identified in the ME and cortex.
a, Alluvial plot showing the number of significant (P < 0.05) co-expressed EC ligands and perivascular receptors. b, Co-immunostaining for BSG (white) and its receptor integrin α6 (ITGA6, red) in cortex and ME, validating elevated expression of ligand (BSG) and receptor (ITGA6) in cortex. c, Co-immunostaining for CD31 (white), AQP4 (green) and ITGA6 (red) in cortex. d, Co-immunostaining for VEGFR2 (red), EMCN (cyan, ME ECs) and GLUT1 (green, cortex ECs) in cortex and ME. EMCN and GLUT1 were used to label ECs instead of CD31 owing to antibody compatibility with VEGFR2. e, Co-immunostaining for VEGF (white), EMCN (cyan, ME ECs) and (GLUT1, green, cortex ECs) in cortex and ME. EMCN and GLUT1 were used to label ECs instead of CD31 owing to antibody compatibility with VEGF. f, Immunostaining illustrating complementary spatial distribution of ligand VEGF (white) and receptor VEGFR2 (red) in ME. Non-ME vessels are labeled in green (GLUT1).
Extended Data Fig. 1
Extended Data Fig. 1. Morphological, molecular and functional differences of the vasculature between the ME and cortex.
(a) Tracer leakage assay with Sulfo-NHS-Biotin (magenta) and immunostaining for blood vessels (CD31, white) in cortex (upper panel) and ME (lower panel). Tracer in circulation was washed out by perfusion prior to analysis. Scale bar 10 µm. (b) Co-immunostaining of GLUT1 (green) and PLVAP (red) in ME and cortex. Scale bar 100 µm. (c) High magnification images of capillaries showing distinct Glut1 (green) and Plvap (red) expression pattern and vessel morphology in the cortex and ME. Scale bar 20 µm. (d) Co-immunostaining of CD31 (white) and tight junction protein Cldn5 (green) in cortex and ME. Scale bar 10 µm. (e) Validation of specificity of newly generated polyclonal antibody against MFSD2A (green) by immunostaining of cortex from wild type and Mfsd2ako mice. Scale bar 100 µm. (f) Immunostaining of CD31 (white) in the ME in thick tissue section. Scale bar 100 µm.
Extended Data Fig. 2
Extended Data Fig. 2. TEM reveals differences in organization of the vasculature and cellular environment in the ME and cortex.
(a) TEM images of a cortical capillary. As outlined in the legend, pseudocolors highlight different cells: cEC (purple), pericyte (teal), astrocyte endfoot (cyan), lumen (L, white) and neuropil (yellow). Insets show cEC tight junctions (white arrows), pericyte cells (P, teal) and astrocyte endfeet (A, cyan). Scale bar represents 1 µm (left). (b) TEM images of two blood vessels in the ME, (i) and (ii). As outlined in the legend, pseudocolors highlight different cells: cEC (purple), pericyte (teal), fibroblast (red), lumen (L, white) and neuropil (yellow). Insets show capillary fenestrations (white arrowheads), cEC tight junctions (white arrows), extracellular matrix-filled perivascular space (ECM), pericyte cells (P, teal) and fibroblast cells (F, red). Scale bar represents 1 µm. (c) TEM images of two groups of ME blood vessels. Scale bar represents 4 µm. (d) Co-immunostaining for astrocyte endfoot marker Aqp4 (green) and CD31 (white) in cortex and ME. Scale bar 20 µm.
Extended Data Fig. 3
Extended Data Fig. 3. Single cell RNA sequencing of median eminence and a size-matched region of somatosensory cortex reveals unique cell types in each brain region.
(a) Bar plot showing distribution of cells in each cell type for each experimental replicate. Replicates 12–15, in bold, are from the ME region only. (b) Bar plot showing distribution of cells in each cell type for each library batch preparation. Batch 9, highlighted in bold, is comprised of libraries from the ME region only. (c) Dot plot showing average expression of one cell type-specific transcript used to annotate cluster cell types in Fig. 2. Additional transcripts used for annotation are detailed in Methods. (d) Tukey box and whisker plot depicting the number of genes detected per cell in all identified clusters in Fig. 2. Box shows the median and first and third quartiles, whiskers represent 1.5 times the interquartile range. The cell number in each cluster per sample region is indicated at the right of each plot, with cortex-enriched clusters highlighted in red and ME-enriched clusters highlighted in blue (as determined in (e)). Data was collected on 15 separate days, with two technical replicates from ME and cortex samples in each replicate (except for replicates 12–15, which were ME only). ME and cortex regions were isolated from the same 5 mice in each replicate and pooled by region prior to dissociation. (e) Point-range plot showing the relative differences in cell proportions for each cluster in (d) between the ME and cortex. Regional enrichment was determined by permutation test, with significance assessed by false discovery rate following bootstrapping (implemented by the scProportionTest R package). Clusters showing regional enrichment (log2 fold-change greater than |4.5| and FDR < 0.05) are labeled and shown in red.
Extended Data Fig. 4
Extended Data Fig. 4. Novel regionally enriched genes identified in cECs in the ME and cortex.
(a) Dot plot of average expression of vascular zonation markers and several transcripts used to annotate cluster cell types in Fig. 3a. Actb and Cdh5 are expressed in all populations, and Cldn5 and Slc2a1 are cortex-enriched transcripts, as illustrated in Extended Data Fig. b-d. Lcn2, Vcam1, Lrg1, and Slc38a5 are enriched in vECs; Nr4a1, Jun and Fos are enriched in cECs 2; Apln, Aplr and Trp53i11 are enriched in tip cells; Vegfc, Sema3g and Gkn3 are enriched in aECs 1 and 2; Tfrc and Mfsd2a are enriched in cECs 1 and 2; Emcn, Esm1, and Plvap are enriched in ME cECs; Unc5b is enriched in aECs 1; Rgcc and Kdr are enriched in capillary ECs (cECs 1 and 2 and ME cECs). (b) Heatmap illustrating the top 75 differentially expressed genes from each group when comparing cortex-derived cECs 1 and cECs 2 with ME cECs. Differentially expressed genes were determined by two-sided Wilcoxon test in Seurat (minimum percentage = 25%, log2-fold change > 0.6, adjusted p-value < 0.05). (c) Heatmap illustrating endothelial activity-induced transcripts (reported in Hrvatin, et al.) that are differentially expressed between cECs 1 and cECs 2. Differentially expressed genes were determined by two-sided Wilcoxon test in Seurat (minimum percentage = 10%, log2-fold change > 0.25, adjusted p-value < 0.05). (d) Percentage of EC subtypes sequenced by experimental replicate. Experimental replicates with only ME samples are highlighted in blue. (e) Percentage of EC subtypes sequenced by library batch. Library batches with only ME samples are highlighted in blue.
Extended Data Fig. 5
Extended Data Fig. 5. Immunostaining reveals ME capillary boundary and validates differential gene expression across regions.
(a) Co-immunostaining with anti-CD31 (white) and anti-SMA (red) antibodies to visualize arteries in the cortex and ME. Scale bar 200 µm. (b) High magnification images of blood vessels (CD31, white), highlighting vessels interacting with SMA-positive smooth muscle cells (red) in cortex (top) and ME (bottom). Scale bar 20 µm. (c) Co-immunostaining with anti-CD31 (white) and anti-PLVAP (red) antibodies in the ME. Yellow arrows indicate arteries in this region. Scale bar 50 µm. (d) Co-immunostaining of SPOCK2 (white), GLUT1 (green) and EMCN (red) in the cortex and ME of P5 wild type mouse. Scale bar 10 µm. (e) Heatmap showing significantly upregulated Reactome pathways for the top 115 differentially expressed genes in cortex-derived cECs 1 and 2 and ME cECs. Differentially expressed genes were determined by two-sided Wilcoxon test in Seurat comparing cortex-derived cECs 1 and 2 with ME cECs (minimum percentage = 25%, log2-fold change > 0.6, adjusted p-value < 0.05). p-value was calculated with a one-sided Fisher’s exact test, and -log(FDR) values are shown. Upregulated pathways from other pathway databases can be found in Supplementary Table 1. (f) Co-immunostaining for CD31 (white), endothelial nuclei marker ERG (red), and GFP in cortex and ME of TCF/LEF-GFP Wnt-signaling reporter mice. GFP expression (green) indicates activation of the Wnt-signaling pathway. Arrows indicate ERG and GFP double positive nuclei. Scale bar 50 µm.
Extended Data Fig. 6
Extended Data Fig. 6. Comparison of scRNAseq of ME-derived Plvap + ECs to published ECs from the mouse neurohypophysis, pituitary gland and peripheral organs.
(a) Heatmap showing the top 10 most similar cell types when analyzing the top 115 differentially expressed genes for each cEC subtype. Differentially expressed genes were determined by two-sided test in Seurat comparing each subcluster to all other astrocyte cell subclusters with min.pct=0.25 and logFC>0.6. Hypergeometric p-value was calculated and -log(FDR) values are shown. Brain cell types are highlighted in blue, while peripheral cell types are highlighted in green. (b) Table showing genes common between the top 50 differentially expressed genes in Plvap ECs, tip cells and cECs1 (calculated by two-sided Wilcoxon test in Seurat comparing each EC subtype to all other ECs with min.pct=0.25 and logFC>0.6) and marker genes of ECs from the choroid plexus from Dani et al.. (c) Bar plot showing the percentage overlap of the top 50 enriched genes from Plvap ECs, tip cells and cECs 1 EC subtypes (calculated by two-sided Wilcoxon test in Seurat comparing each EC subtype to all other ECs with min.pct=0.25 and logFC>0.6) and each of the top 50 enriched genes in ECs reported from Kalucka et al.. (d) Table showing genes common between Plvap+ ECs, tip cells and cECs 2 in the organs with the highest level of overlap in (c). (e) Bar plot showing the percentage overlap of the top 50 enriched genes from Plvap ECs, tip cells and cECs 1 EC subtypes (calculated by two-sided Wilcoxon test in Seurat comparing each EC subtype to all other ECs with min.pct=0.25 and logFC>0.6) and each of the top 50 enriched genes in ECs reported from Feng et al.. (f) Table showing genes common between Plvap+ ECs, tip cells and cECs 1 in the organs with the highest level of overlap in (e). (g) Venn diagram showing the overlap between EC marker genes from the kidney and pancreas from Feng et al. and the choroid plexus from Dani et al. with marker genes of Plvap ECs (calculated by two-sided Wilcoxon test in Seurat comparing Plvap ECs to all other ECs with min.pct=0.25 and logFC>0.6). The 9 genes common to all samples are listed in the center. (h) The top 100 genes enriched in ME-derived Plvap+ ECs when compared to cortex-derived cECs (as in (a), blue) were compared to the top 100 genes enriched in vascular ECs from the mouse neurohypophysis (gray) and the top 100 genes enriched in ECs isolated from the mouse pituitary gland (red). Plvap+ EC enriched genes were calculated by two-sided Wilcoxon test in Seurat comparing each EC subtype to all other ECs. (i) Table containing the identities of the 8 genes expressed by all samples compared in (h).
Extended Data Fig. 7
Extended Data Fig. 7. Astrocyte subtypes and their interactions with blood vessels are distinct between the ME and cortex and from published datasets.
(a) Heatmap illustrating the top 5 genes differentiating each astrocyte cell subcluster. Differentially expressed genes were determined by two-sided Wilcoxon test in Seurat comparing each subcluster to all other astrocyte cell subclusters. (b) Percentage of astrocyte subtypes sequenced by experimental replicate. Experimental replicates with only ME samples are highlighted in bold (12–15). (c) Percentage of astrocyte subtypes sequenced by library batch. Library batches with only ME samples are highlighted in bold (9). (d) Fluorescent labeling of cortex blood vessels and astrocyte populations (Tomato, red) in cortex and ME using Slco1c1-CreER:Ai14 mice. Co-staining for blood vessels (CD31, white). Scale bar 100 µm. (e) Heatmap showing the significance of upregulated pathways for the top 50 differentially expressed genes for each astrocyte subtype. Differentially expressed genes were determined by two-sided Wilcoxon test in Seurat comparing each subcluster to all other astrocyte cell subclusters with min.pct=0.25 and logFC>0.6. p-value was calculated with a one-sided Fisher’s exact test, and -log(FDR) values are shown. (f) UMAP projections of astrocyte transcriptomes following Harmony cross-correlation analysis. (g) Violin plots showing the expression of GLAST (Slc1a3), Sfrp5, and of markers reported previously of telencephalon astrocytes, expressed in cortex astrocytes (Lhx2, Foxg1, Mfge8) and diencephalon astrocytes expressed in ME astrocytes (Gfap, Aqp4, Slc6a11, Agt, Slc7a10, Fgfr3, Cldn10, Igsf1, Itih3, Ntsr2). (h) UMAP plots highlighting the expression of markers (purple) reported previously of Myoc-expressing astrocytes in Gfap high population (outlined in black). (i) Clustergram showing similarity of ME and cortex astrocyte subtypes to those reported previously. The expression patterns of the top 25 differentially expressed genes in the 4 astrocyte subtypes (calculated by two-sided Wilcoxon test in Seurat comparing each astrocyte subtype to all other astrocytes, with min.pct = 0.25 and logFC > 0.6) were clustered in aggregate metacells using the pheatmap R package with the default parameters. (j) Heatmap (scaled by row) illustrating the top 15 genes distinguishing the FC_8-1_Gfap- astrocytes (FC), GP_5-1.Astrocyte.Gja1.Gfap (GP), and SN_7-2_Astrocyte.Gja1.Cst3 (SN) subtypes previously reported. Genes expressed in at least 2 of the above astrocyte subtypes are labeled as ‘multiple.’ (k) Violin plot showing expression of Slc1a3, which encodes GLAST, in astrocyte and tanycyte populations. (l) Fluorescent labeling of astrocyte populations (Tomato, red) in cortex and ME using Glast-CreER:Ai14 mice with a high dose of tamoxifen. Co-staining for blood vessels (CD31, white). Scale bar 50 µm. (m) Fluorescent labeling of astrocyte populations in the cortex and ME using Glast-CreER:Ai14 mice after a low dose of tamoxifen to achieve sparse cell labeling. Upper row: immunostaining for Tomato-positive astrocytes (red) and blood vessels (CD31, white). Lower row displays 3D reconstructions of astrocytes (red). Scale bar 20 µm (upper) and 10 µm (lower). (n) Co-immunostaining for GFAP-enriched astrocyte population (GFAP, red) and tanycyte marker Vimentin (yellow). Scale bar 30 µm. (o) Co-immunostaining for tanycyte marker VIMENTIN (yellow) and pan EC marker CD31 (white) in ME. Ventral and coronal view of ME shown, note tanycyte protrusions in touch with ME vessels. Scale bar 30 µm (upper panel) and 15um (lower panel).
Extended Data Fig. 8
Extended Data Fig. 8. Mural cells associated with cortex and ME blood vessels show distinct morphology and transcriptomic differences.
(a) Representative cross section images of (i) vessel 1 and (ii) vessel 2 reconstruction by serial TEM. Pseudocolors show reconstructed regions: blood vessel lumen (L, red); EC (green); and pericyte cell (blue). White arrows indicate EC tight junctions (purple), and white boxes highlight ‘peg and socket’ pericyte-EC interactions. Scale bar represents 1 µm. (b) Representative image of cortex vessel 4 from serial TEM dataset. Scale bar represents 1 µm. (c) Immunostaining for PDGFRβ (white, left panels) and Imaris 3D reconstruction of pericytes (white, middle and right panels) in cortex and ME. Co-staining for Glut1 (green) and Emcn (red) to mark capillaries in the cortex and ME, respectively. Scale bar 10 µm. (d) High magnification images of reconstructed pericytes (PDGFRβ, white) in contact with capillaries (Glut1, green and Emcn, red) in cortex and ME. Arrows point at ME pericyte protrusions not in contact with capillaries. Scale bar 5 µm. (e) Violin plots showing expression of published markers of brain pericytes in both ME and cortex areas of interest from GeoMX whole transcriptome profiling. (f) Heatmap of differentially expressed genes (log2 fold-change greater than |1| and FDR < 0.05) between cortex and ME pericyte-enriched regions of interest from GeoMX whole transcriptome profiling (also shown in Fig. 5h). Differential expression was determined by linear mixed model analysis and significance assessed by false discovery rate (FDR). (g) Immunostaining for CD31 (green) and SLC12A7 (red) in ME and cortex in coronal tissue sections. Scale bar 10 µm. (h) Upset plot showing overlap between human pericyte cell type signatures and differentially expressed genes in ME and cortex pericyte-enriched regions. (i) Upset plot showing overlap between human brain pericyte cell type signatures and ME and cortex pericyte-enriched differentially expressed genes (Fig. 5h). (j) Upset plot showing overlap between human pericyte cell type signatures and pericyte marker genes from our scRNAseq dataset (calculated by two-sided Wilcoxon test in Seurat comparing pericytes to other mural cells, with min.pct=0.25 and logFC>0.6).
Extended Data Fig. 9
Extended Data Fig. 9. Fibroblasts in the ME.
(a) Heatmap of differentially expressed genes between ME pericyte- and fibroblast-enriched areas of interest from GeoMX whole transcriptome profiling. (log2 fold-change greater than |1| and FDR < 0.05). Differential expression was determined by linear mixed model analysis and significance assessed by false discovery rate (FDR). (b) Upset plot showing overlap between ME fibroblast-enriched regions from GeoMx whole transcriptome profiling and fibroblasts from choroid plexus in Dani et al.. (c) 3D reconstructions of fibroblasts in the ME and cortex are shown in red (based on Pdgra-CreER:Ai14 Tomato expression). Immunostaining for CD31 is shown in white. Scale bar 15 µm. (d) Another 3D view of (g) showing the location of fibroblasts below ME blood vessels. Scale bar 5 µm. (e) UMAP plot of 714 fibroblast transcriptomes. Fibroblast subtype clusters were identified with an unbiased analysis. The number of cells identified for each subtype is indicated in the plot legend. (f) UMAP plot in (a) colored by sample region. (g) VlnPlot showing the expression of Cola1a, Dcn and Pdgfra in fibroblast subclusters. (h) Heatmap illustrating the top 5 genes differentiating each fibroblast subcluster. Differentially expressed genes were determined by two-sided Wilcoxon test in Seurat comparing each subcluster to all other mural cell subclusters with min.pct=0.25 and log2_FC > 0.6 thresholds. (i) Table showing overlap of fibroblasts 1 and 4 subtypes with fibroblast topics from Dani et al.. Differentially expressed genes were determined by two-sided Wilcoxon test in Seurat comparing the fibroblast 1 subcluster to the fibroblast 4 subcluster, with min.pct =0.25 and log2_FC > 0.6 thresholds. (j) Co-immunostaining for fibroblast-enriched protein, DECORIN (white) and Tomato in cortex and ME. Blood vessels labelled with Tomato using Cdh5-CreERT2:Ai14 mice. Scale bar 20 µm.
Extended Data Fig. 10
Extended Data Fig. 10. Differences in perivascular cell signaling capacity in the ME and cortex.
(a, b) Bubble plots from CellChat analysis showing ligand-receptor pairs between (b) cortex ECs and pericytes and astrocytes and (c) ME Plvap ECs and astrocytes, tanycytes, pericytes and fibroblasts. ME pericyte data is from the scRNAseq dataset. p-values were calculated by permutation test in the CellChat R package. (c) Overview of ligand-receptor analysis methodology and workflow. (d) EC ligand-receptor interaction scores with pericyte, astrocyte, tanycyte and fibroblast receptors in the ME or cortex with values > 40 and p-values < 0.01. Candidate, ME-enriched ligand-receptor interaction investigated in Fig. 7 is highlighted in blue. Candidate, cortex-enriched ligand-receptor interaction investigated in Fig. 7 is highlighted in red. Uppercase ligand-receptor pairs are from Kumar et al. database. ME pericyte data is from GeoMX spatial transcriptomic profiling.

Similar articles

Cited by

References

    1. Sweeney, M. D., Sagare, A. P. & Zlokovic, B. V. Blood–brain barrier breakdown in Alzheimer disease and other neurodegenerative disorders. Nat. Rev. Neurol.14, 133–150 (2018). - PMC - PubMed
    1. Kaur, C. & Ling, E.-A. The circumventricular organs. Histol. Histopathol.32, 879–892 (2017). - PubMed
    1. Jiang, H. et al. MCH neurons regulate permeability of the median eminence barrier. Neuron107, 306–319.e9 (2020). - PMC - PubMed
    1. Hicks, A.-I., Kobrinsky, S., Zhou, S., Yang, J. & Prager-Khoutorsky, M. Anatomical organization of the rat subfornical organ. Front. Cell. Neurosci.15, 691711 (2021). - PMC - PubMed
    1. Montagne, A. et al. Blood–brain barrier breakdown in the aging human hippocampus. Neuron85, 296–302 (2015). - PMC - PubMed