. 2024 Oct;6(10):1963-1975.
doi: 10.1038/s42255-024-01119-3. Epub 2024 Aug 29.

Global 13C tracing and metabolic flux analysis of intact human liver tissue ex vivo

Affiliations

Global 13C tracing and metabolic flux analysis of intact human liver tissue ex vivo

Nina Grankvist et al. Nat Metab. 2024 Oct.

Abstract

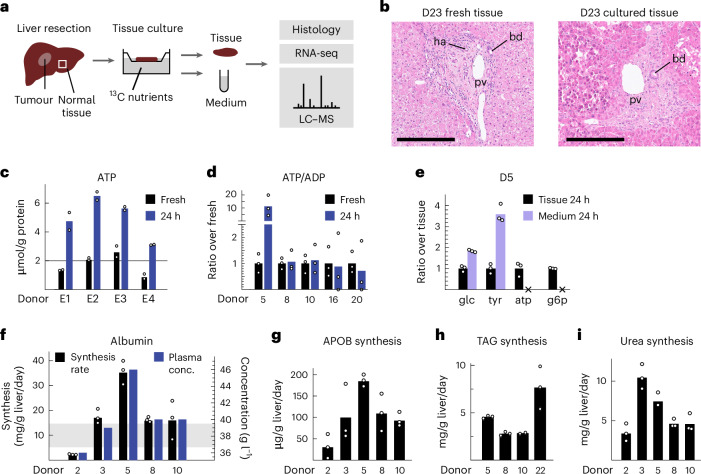
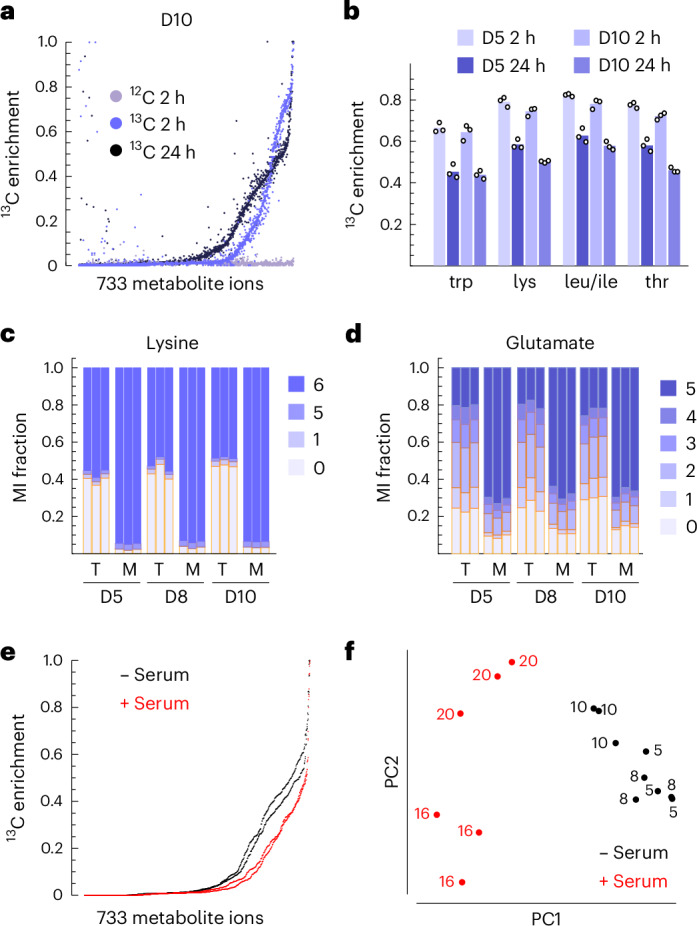
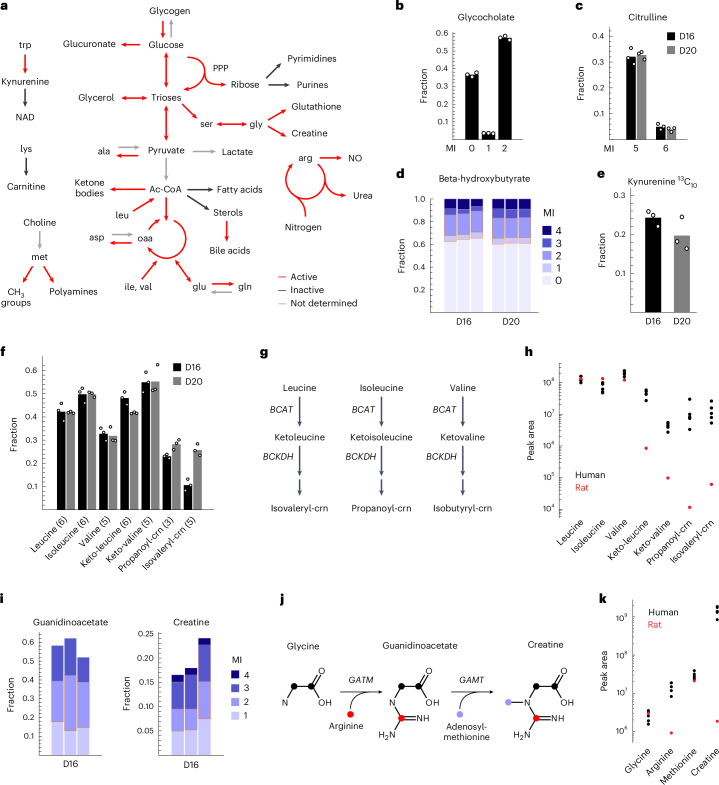
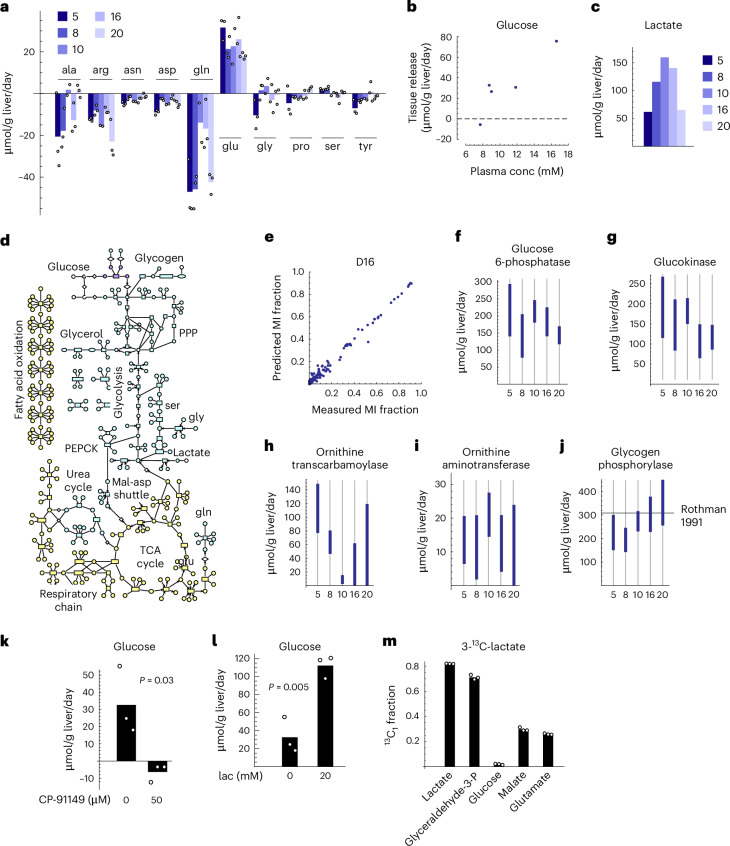
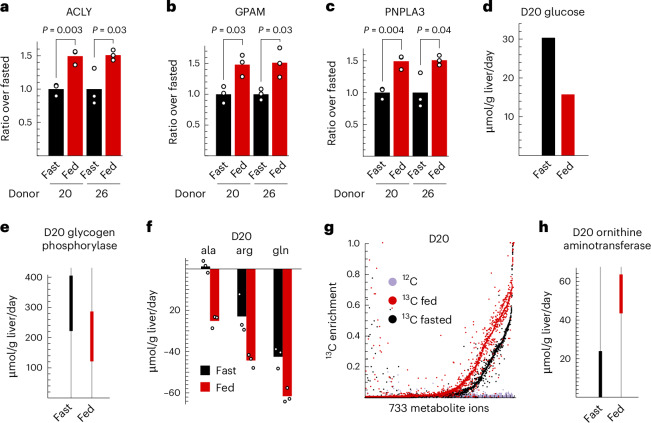
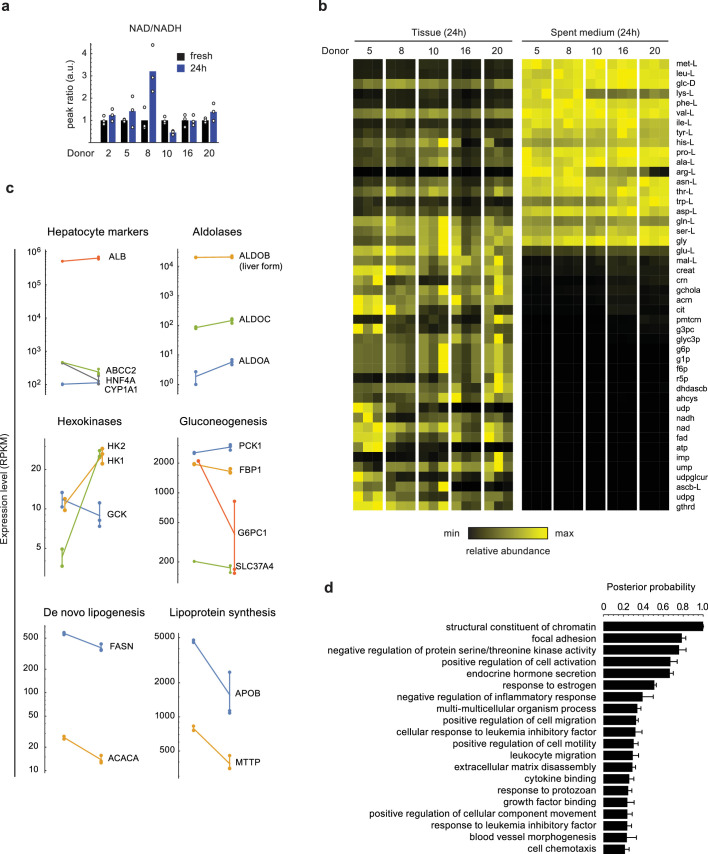
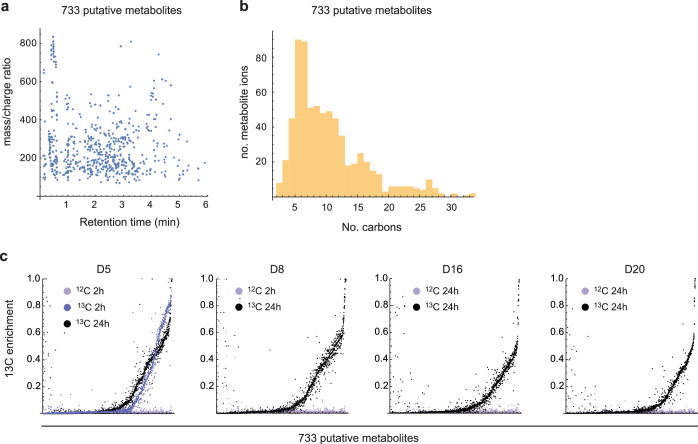
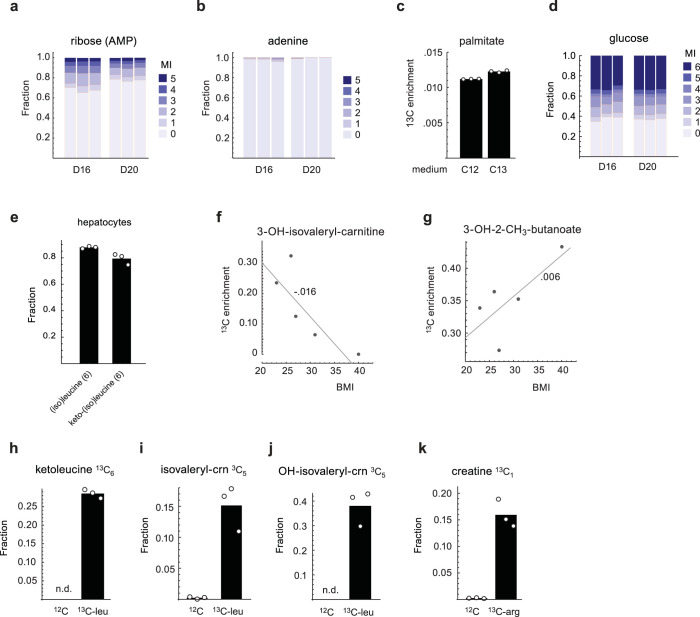
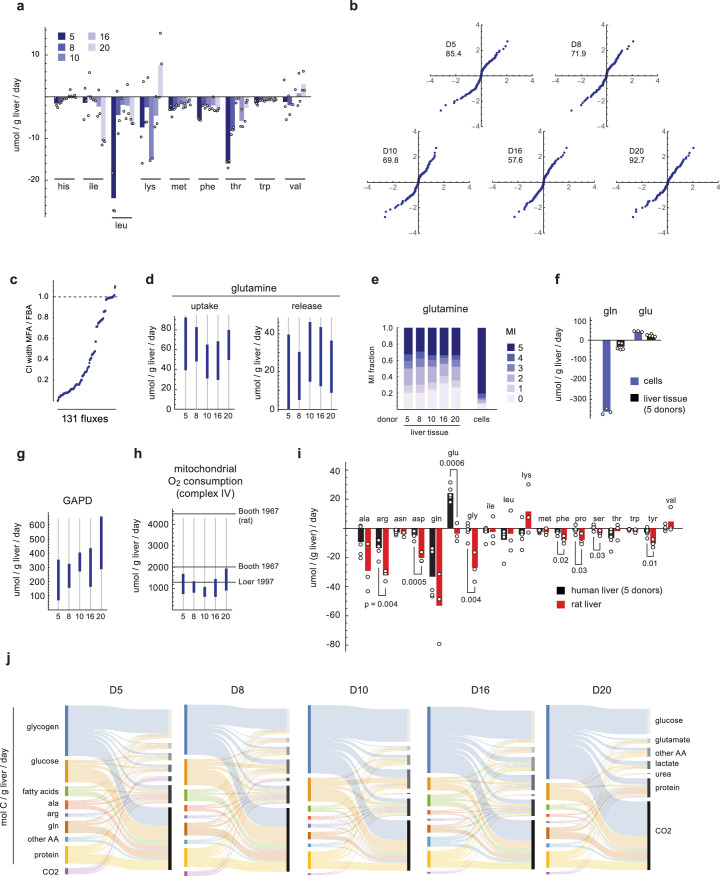
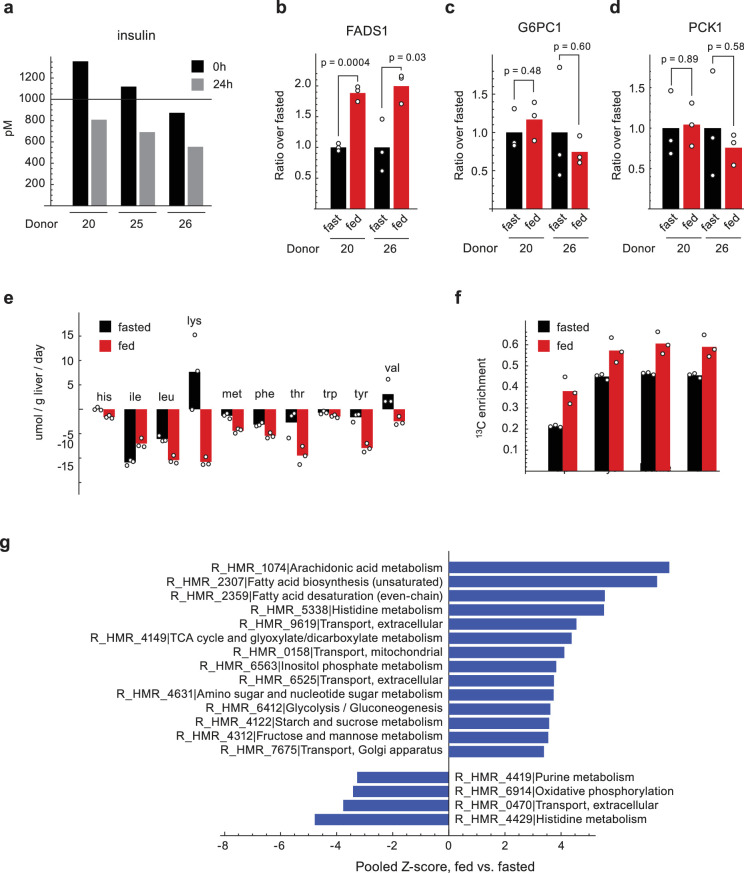
Liver metabolism is central to human physiology and influences the pathogenesis of common metabolic diseases. Yet, our understanding of human liver metabolism remains incomplete, with much of current knowledge based on animal or cell culture models that do not fully recapitulate human physiology. Here, we perform in-depth measurement of metabolism in intact human liver tissue ex vivo using global 13C tracing, non-targeted mass spectrometry and model-based metabolic flux analysis. Isotope tracing allowed qualitative assessment of a wide range of metabolic pathways within a single experiment, confirming well-known features of liver metabolism but also revealing unexpected metabolic activities such as de novo creatine synthesis and branched-chain amino acid transamination, where human liver appears to differ from rodent models. Glucose production ex vivo correlated with donor plasma glucose, suggesting that cultured liver tissue retains individual metabolic phenotypes, and could be suppressed by postprandial levels of nutrients and insulin, and also by pharmacological inhibition of glycogen utilization. Isotope tracing ex vivo allows measuring human liver metabolism with great depth and resolution in an experimentally tractable system.


Conflict of interest statement

M.J. is an employee at Sapient Bioanalytics, and holds equity in the company. The other authors declare no competing interests.

Figures

Fig. 1
Fig. 1. Cultured human liver retains metabolic function.
a, Schematic of liver tissue sampling, culture and analysis. RNA-seq, RNA sequencing. b, Representative histology images of freshly resected (left) and 24-h cultured human liver tissue (right), from a total of 12 images. pv, portal vein; ha, hepatic artery; bd, bile duct. Scale bars, 250 µm. c, ATP content of freshly resected and 24-h cultured liver slices. d, ATP/ADP content, as in c. e, relative abundance of indicated metabolites in liver tissue and conditioned medium. g6p, glucose-6-phosphatase. f, Liver tissue synthesis rate (left scale) and plasma concentration (right scale) of albumin. Shaded area indicates the range of in vivo synthesis rate from previous reports (Supplementary Table 4). g, Synthesis rate of APOB. h, Synthesis rate of triacylglycerides (TAGs). i, Synthesis rate of urea. Data from n = 3 independent tissue slices are shown for each donor in ci. Source data
Fig. 2
Fig. 2. Global 13C tracing in human liver tissue.
a, Distribution of 13C enrichment across putative metabolites in indicated conditions. Dots represent values for individual metabolites, from three tissue slices per condition. b, 13C enrichment in tissue slices for the indicated AAs. c, Mass isotopomer (MI) distribution of lysine in tissue (T) and medium (M). d, MI distribution of glutamate, as in c. e, Distribution of 13C enrichment in tissues cultured with (+) and without (−) human serum. Dots indicate the median of three slices per donor for each metabolite. f, The first two principal components (PCs) of 13C enrichment for 733 metabolites. Dots indicate individual liver slices; numbers indicate donors. Data from n = 3 independent tissue slices are shown for each donor in ad and f. Source data
Fig. 3
Fig. 3. Systematic assessment of liver metabolic activities.
a, Schematic indicating liver pathways whose activity in tissue slices could be inferred from untargeted 13C analysis. NAD, nicotinamide adenine dinucleotide; PPP, pentose phosphate pathway; Ac-CoA, acetyl-coenzyme A; NO, nitric oxide. b, Mass isotopomer (MI) fractions of glycocholate. c, MI fractions of citrulline. d, MI fractions of beta-hydroxybutyrate. e, 13C10 MI fraction of kynurenine. f, MI fraction of indicated BCAA metabolites, with MI number in parentheses. crn, carnitine. g, Simplified schematic of BCAA catabolism pathways. h, LC–MS peak areas of indicated metabolites in human liver from five donors (black) and in rat liver (red). Mean values across three tissue slices are shown. i, MI fractions of guanidinoacetate and creatine. j, Schematic of the creatine synthesis pathway; colour indicates origin of atoms. k, LC–MS peak areas of indicated metabolites, as in h. Data from n = 3 independent tissue slices are shown for each donor in bf and i. Source data
Fig. 4
Fig. 4. Metabolic flux analysis in liver tissue.
a, Uptake (negative) and release (positive) fluxes for indicated metabolites from culture medium. Numbers indicate individual donors. b, Glucose release flux versus donor plasma glucose concentration. c, Lactate release flux. d, Schematic of the model used for 13C MFA, with pathways and compartments indicated. Blue, cytosol; red, mitochondrion; green, endoplasmic reticulum. e, Model-predicted versus measured MI fractions for all included metabolites. fj, 90% confidence intervals for flux through glucose-6-phosphatase (f), glucokinase (g), ornithine transcarbamoylase (h), ornithine aminotransferase (i) and glycogen phosphorylase (j). Solid line in j indicates literature values from source publications listed in Supplementary Table 4. k, Glucose release flux in liver tissue with and without the glycogen phosphorylase inhibitor CP-91149. l, Glucose release flux in liver tissue incubated with indicated concentrations of lactate (lac). m, 13C1 MI fractions of indicated metabolites in liver slices incubated with 20 mM 3-13C-lactate. Confidence intervals in fj were obtained by the profile likelihood method (Methods) based on n = 3 independent tissue slices. P values were calculated using Student’s two-sided t-test from n = 3 tissue slices. Source data
Fig. 5
Fig. 5. Metabolic response of liver tissue to nutrients and insulin.
ac, Expression level of mRNAs for ATP-citrate lyase (ACLY; a), glycerol-3-phosphate acetyltransferase (GPAM; b) and patatin-like phospholipase domain containing 3 (PNPLA3; c) in fasted and fed conditions. d, Glucose release flux. e, 90% confidence intervals for glycogen phosphorylase flux. f, Uptake (negative) fluxes for indicated AAs. g, Distribution of 13C enrichment in the indicated conditions. Dots represent values for individual metabolites, from three tissue slices per condition. h, 90% confidence intervals for ornithine aminotransferase flux. Confidence intervals in e and h were obtained by the profile likelihood method (Methods) based on n = 3 independent tissue slices. P values were calculated using Student’s two-sided t-test from n = 3 tissue slices. Source data
Extended Data Fig. 1
Extended Data Fig. 1. Metabolic state of culture liver slices.
a, Relative NAD/NADH ratios in fresh liver tissue and cultured liver slices, normalized to fresh tissue ratio for each donor. b, Relative abundances of metabolites in cultured liver tissue and spent medium, normalized by maximum for each row. c, Expression of selected genes in freshly resected liver tissue and cultured liver slices, measured by RNA sequencing. Individual data points are shown, with vertical lines indicating the range of variation for clarity. d, GeneOntology enrichment analysis of mRNAs with increased expression in cultured liver slices vs. fresh tissue. Error bars indicate standard error of the posterior probability, as estimated by the MGSA R package. Data from n = 3 independent tissue slices are shown for each donor in a–c. Source data
Extended Data Fig. 2
Extended Data Fig. 2. Properties of global isotope tracing data.
a, Mass-charge ratio and retention time of 733 ions representing putative metabolites. b, Distribution of carbon number for all putative metabolites. c, 13C enrichment distribution in tissues after 2 h or 24 h labeling, and unlabeled (12C) controls. Dots represent values for individual metabolites, from three tissue slices per condition. Source data
Extended Data Fig. 3
Extended Data Fig. 3. Isotope labeling of reporter metabolites and branched-chain amino acid products.
a, Liver tissue MI fractions of the ribose moiety of AMP, deconvoluted. b, MI fractions of adenine. c, 13C enrichment in liver tissue palmitate, from cultures with 12C (unlabeled) and 13C (deep labeling) medium. d, MI fractions in glucose. e, MI fraction of indicated branched-chain amino acid (BCAA) metabolites, with mass isotopomer number in parentheses, in human hepatocytes. f-g, Liver tissue 13C enrichment in branched-chain AA metabolites 3-OH-isovaleryl-carnitine (f) and 2-OH-3-CH3-butanoate (g) vs. donor BMI. hj, Indicated MI fractions of ketoleucine (h), isovaleryl-carnitine (i) and hydroxy-isovaleryl-carnitine (j) in liver tissue incubated with U-13C-leucine or unlabeled (12C) control. k, 13C1 MI fraction of creatine in liver tissue incubated with U-13C-arginine or unlabeled (12C) control, corrected for naturally occurring 13C. Data from n = 3 independent tissue slices are shown for each donor in a–e and h–k. Source data
Extended Data Fig. 4
Extended Data Fig. 4. Uptake/release rates and metabolic fluxes in liver slices.
a, Uptake (negative) and release (positive) rates of essential amino acids in liver tissue. Numbers indicate individual donors. b, Quantile-quantile plots of 149 residual MI errors from model fitting. Numbers in top left quadrants indicate χ2 statistic for each fitted model. c, Comparison of confidence intervals (CIs) for 131 fluxes from models fitted with (MFA) and without (FBA) mass isotopomer information. Ratio of confidence interval width is shown. d, 90% confidence intervals for glutamine uptake and release flux. e, MIDs of glutamine in liver tissue from indicated donors (left) and in hepatocytes (right). f, uptake/release of glutamine (gln) and glutamate (glu) in human tissue and hepatocytes. gh, 90% confidence intervals for flux through glycerol-3-phosphate dehydrogenase (g) and mitochondrial complex IV (h). Solid lines in (h) indicate literature values from source publications listed in Supplementary Table 3. i, uptake/release of indicated amino acids in human liver (black) and rat liver (red). Dots indicate mean value per donor for human samples, and individual tissue slices for rat. p-values are indicated where p < 0.01, calculated using Student’s two-sided t-test from n = 3 rat tissue slices vs. n = 5 human liver donors. j, Sankey diagram of carbon flow from substrates (left) to products (right) in liver tissue from indicated donors. Confidence intervals in d,g,h were obtained by the profile likelihood method (see Methods) based on n = 3 independent tissue slices. Source data
Extended Data Fig. 5
Extended Data Fig. 5. Gene expression and metabolic properties in fasted and fed liver slices.
a, Insulin concentration in fresh (0 h) and spent (24 h) medium from liver slice cultures. Line indicates nominal fresh medium concentration (1 nM). bd, Expression level of mRNAs for fatty acid desaturase 1 (FADS1, b), glucose-6-phosphatase catalytic subunit 1 (G6PC1, c) and phosphoenolpyruvate carboxykinase 1 (PCK1, d) in fasted and fed conditions. e, Uptake (negative) and release (positive) rates of essential amino acids in fasted and fed conditions. f, 13C enrichment in indicated amino acids in fasted and fed conditions. g, Reactions from the hepatocyte genome-scale model predicted to be up- or downregulated by insulin based on mRNA expression in fasted and fed liver tissue. p-values in b–d were calculated using Student’s two-sided t-test from n = 3 tissue slices. Data from n = 3 independent tissue slices are shown in e–f. Source data

Similar articles

Cited by

References

    1. Samuel, V. T. & Shulman, G. I. Nonalcoholic fatty liver disease as a nexus of metabolic and hepatic diseases. Cell Metab.27, 22–41 (2018). - PMC - PubMed
    1. Felig, P. Amino acid metabolism in man. Annu. Rev. Biochem.44, 933–955 (1975). - PubMed
    1. Jang, C. et al. Metabolite exchange between mammalian organs quantified in pigs. Cell Metab.30, 594–606 (2019). - PMC - PubMed
    1. Sun, S. Z. & Empie, M. W. Fructose metabolism in humans—what isotopic tracer studies tell us. Nutr. Metab.9, 89 (2012). - PMC - PubMed
    1. Smith, G. I. et al. Insulin resistance drives hepatic de novo lipogenesis in nonalcoholic fatty liver disease. J. Clin. Invest.130, 1453–1460 (2020). - PMC - PubMed