. 2024 Oct;43(20):4786-4804.
doi: 10.1038/s44318-024-00210-5. Epub 2024 Aug 29.

Human genomic DNA is widely interspersed with i-motif structures

Affiliations

Human genomic DNA is widely interspersed with i-motif structures

Cristian David Peña Martinez et al. EMBO J. 2024 Oct.

Abstract

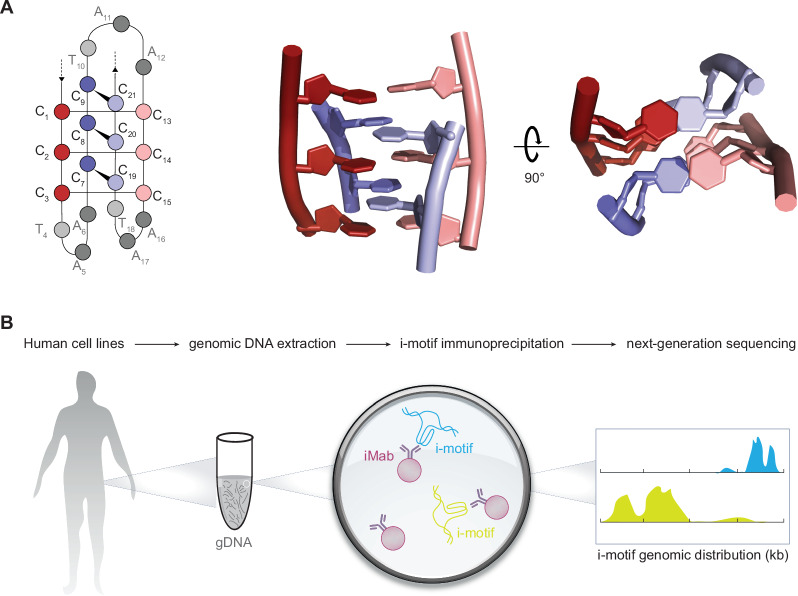
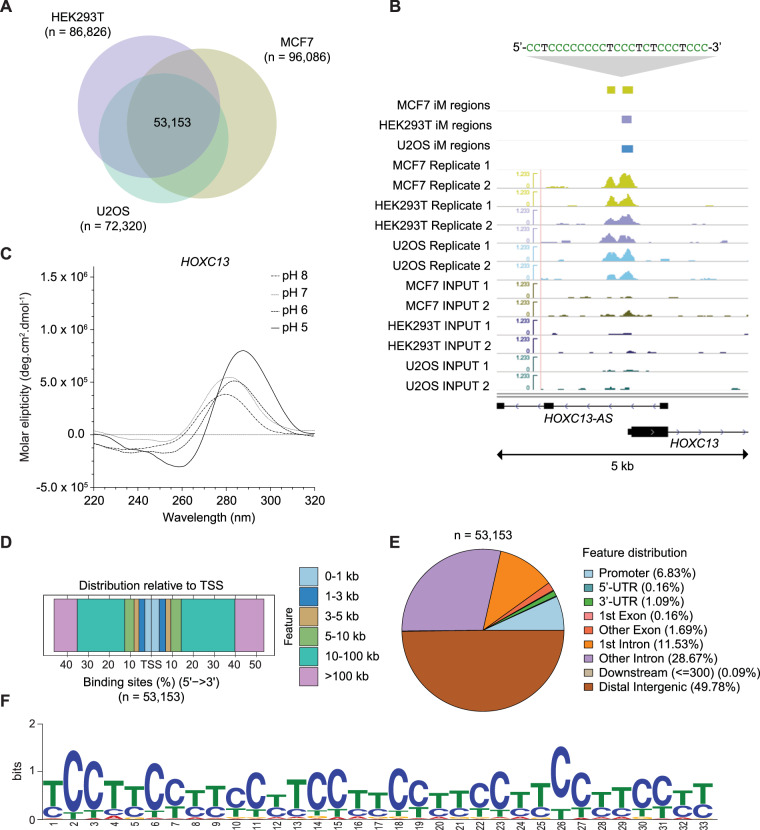
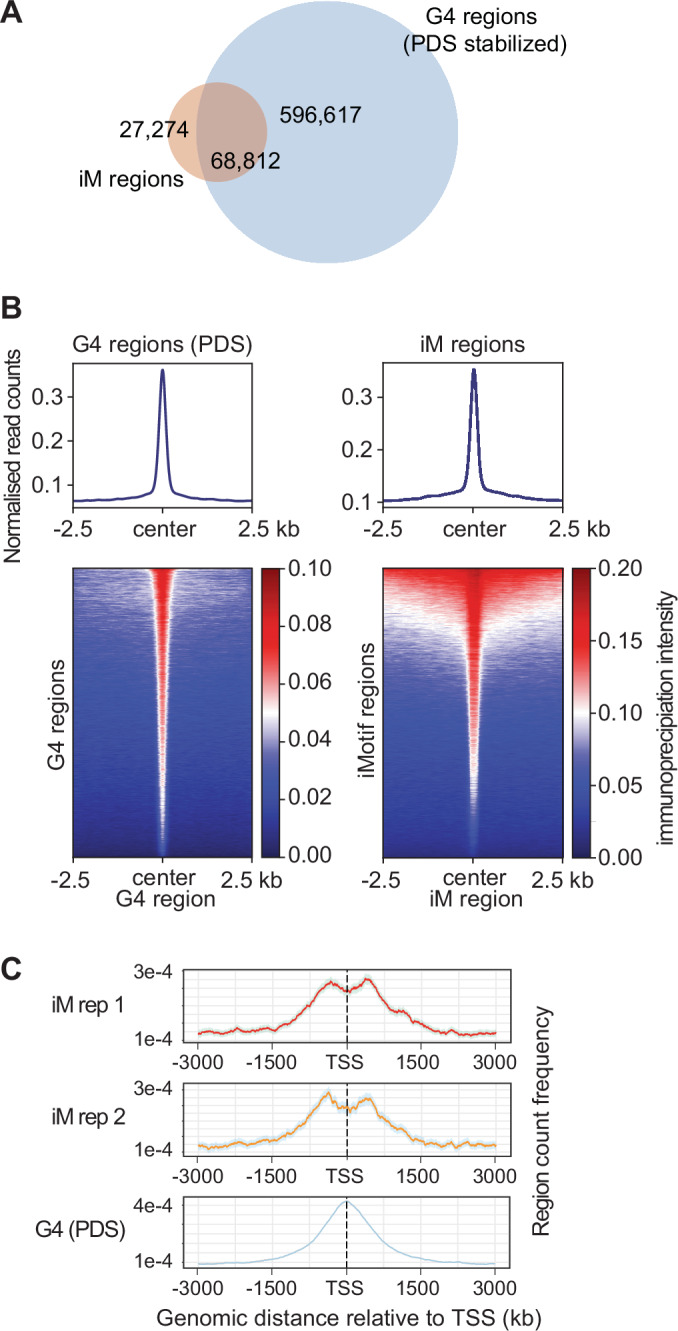
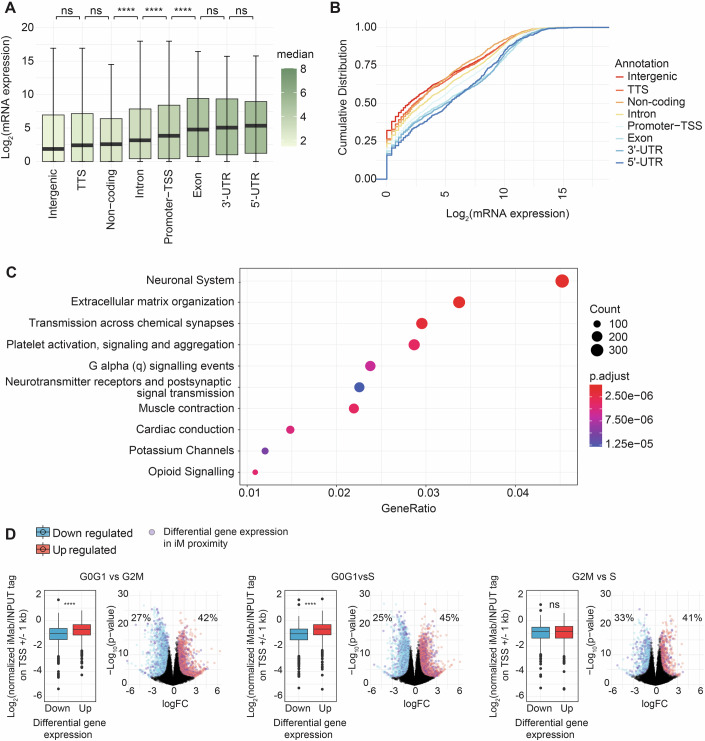
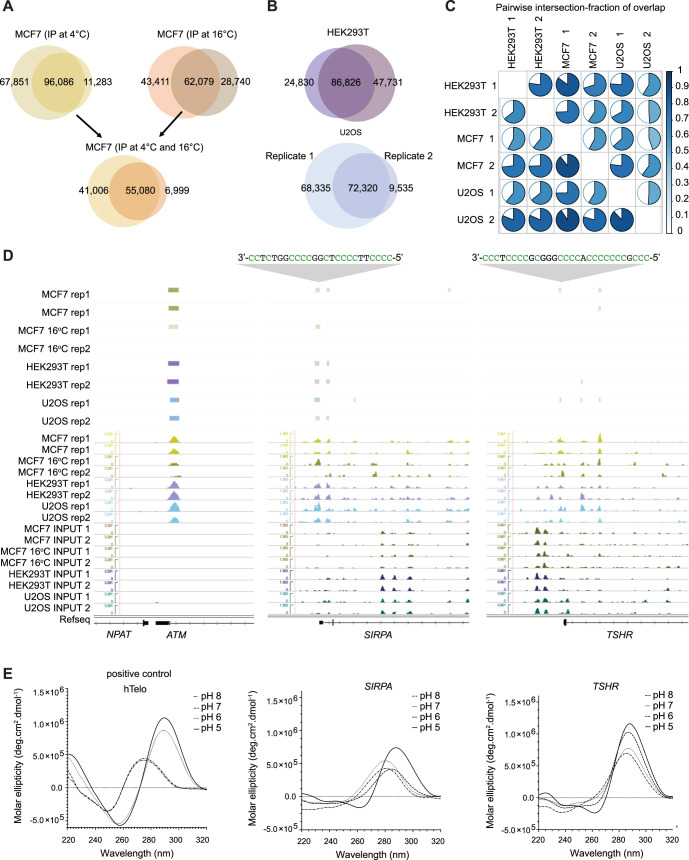
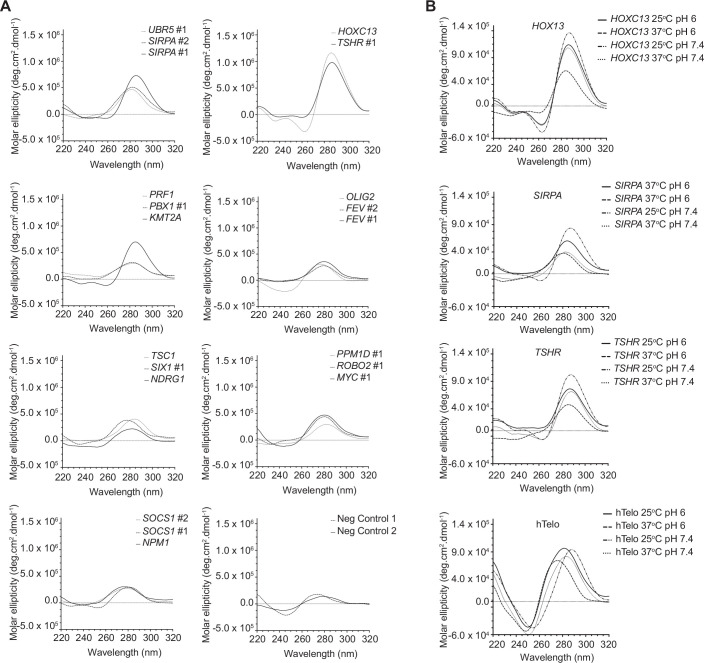
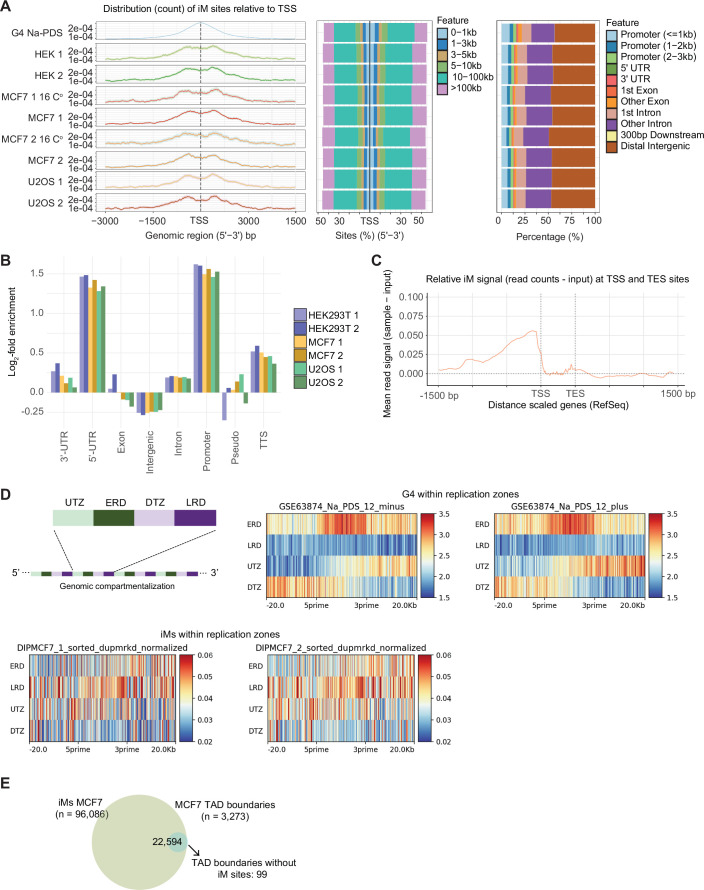
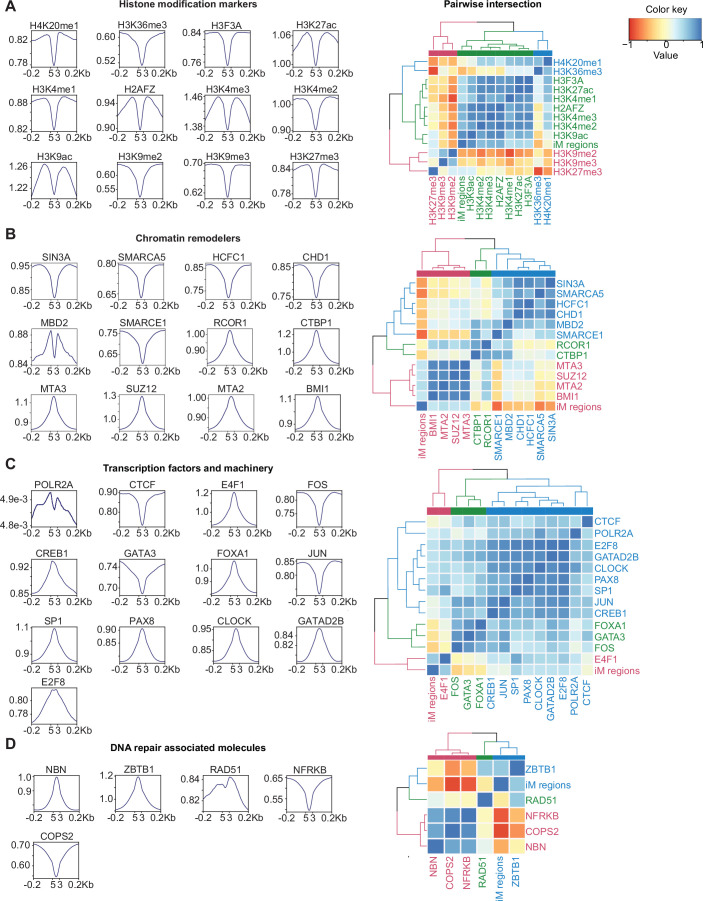
DNA i-motif structures are formed in the nuclei of human cells and are believed to provide critical genomic regulation. While the existence, abundance, and distribution of i-motif structures in human cells has been demonstrated and studied by immunofluorescent staining, and more recently NMR and CUT&Tag, the abundance and distribution of such structures in human genomic DNA have remained unclear. Here we utilise high-affinity i-motif immunoprecipitation followed by sequencing to map i-motifs in the purified genomic DNA of human MCF7, U2OS and HEK293T cells. Validated by biolayer interferometry and circular dichroism spectroscopy, our approach aimed to identify DNA sequences capable of i-motif formation on a genome-wide scale, revealing that such sequences are widely distributed throughout the human genome and are common in genes upregulated in G0/G1 cell cycle phases. Our findings provide experimental evidence for the widespread formation of i-motif structures in human genomic DNA and a foundational resource for future studies of their genomic, structural, and molecular roles.

Keywords: Antibody; DNA Quadruplex Structures; Immunoprecipitation; i-motif; iMab.


Conflict of interest statement

The authors declare no competing interests.

Figures

Figure 1
Figure 1. Identification of iM structures in human genomic DNA.
(A) Schematic representation of intramolecular iM cytosine base pairing (C–C+) and of canonical four-stranded iM structure (based on previously reported NMR structure (PDB: 1i9k)). (B) Immunoprecipitation and next-generation sequencing strategy used to identify iMs in human genomic DNA.
Figure 2
Figure 2. iM structures are detectable and broadly distributed across human genomic DNA.
(A) Total intersected iM regions observed after immunoprecipitation of protein-depleted purified DNA from three different human cell lines (53,153). Each cell line experiment was conducted twice using biological replicates. Coloured circles represent the regions intersected between cell line replicates (HEK293T; n = 86,826) (MCF7; n = 96,086) (U2OS; n = 72,320), (B) Genomic view highlighting an iM structure upstream of the HOXC13 oncogene and downstream the transcription initiation site of HOXC13-AS. iM regions from each cell line replicate are shown (green tracks: MCF7, purple tracks: HEK293T, blue tracks: U2OS, lower tracks: control input profiles). (C) Validation of identified iM upstream of HOXC13 by and circular dichroism spectroscopy under variable pH conditions (pH 5–8) and a temperature of 25 °C. (D) Distribution of iM structures across human genomic DNA. Percentage of genomic features. (E) Distribution relative to transcription starting sites. Represented regions (E, F) are the intersection across all three cell line experiments, n = 53,153. (F) Most frequently identified sequence motif observed in MCF7 DNA (MEME suite (Bailey et al, 2009)). NMR: Nuclear Magnetic Resonance, PDB: Protein Data Bank, MEME: Multiple Expectation maximisations for Motif Elicitation. All data shown from immunoprecipitated iMs at 4 °C and pH 7.4.
Figure 3
Figure 3. Comparison of iM and G4 annotations.
(A) Overlap of iM regions observed in protein-depleted DNA purified from MCF7 replicates and G4 regions previously reported (PDS stabilised) (Chambers et al, 2015). (B) Tag density histograms and heatmaps representing the occupancy of reads after iMab immunoprecipitation. Representative replicate from MCF7 purified DNA in proximity to published G4 regions stabilised by PDS (Chambers et al, 2015) (left panel) and occupancy of G4 reads in proximity to iM regions (right panel). Datasets are centred with 2.5 Kbp flanks. (C) Count frequency and distance (bp) of iMs and previously reported (PDS stabilised) G4s regions relative to TSS. MCF7 data shown from immunoprecipitated iMs at 4 °C and pH 7.4. PDS pyridostatin.
Figure 4
Figure 4. iMs are distributed across human genes and are observed preferentially in the proximity of genes upregulated during early cell cycle phases.
(A) Box plots of Log2 (average mRNA expression) from three independent MCF7 cell bulk RNA seq experiments and the association with iMs regions at different human genomic annotations. The line representing the median and each boxplot is colour-coded for the median value and IQRs (interquartile range, box edges), with whiskers ranging at quantiles ± (1.5 × IQR). (TSS – intergenic; P = 0.04, intron—5’ UTR; P = 0.006, 3’ UTR—exon; P = 0.003), (Wilcoxon rank-sum test). (B) Cumulative distribution plot of iMab regions at different human genomic annotations. Plots represent the cumulative probability versus log2 (average mRNA expression) of three independent bulk RNA experiments in MCF7 cells. (C) Reactome pathway enrichment analysis. Ten most significant pathways shown with P value adjusted represented in a colour gradient and gene counts represented in the dot size. (D) Box plots and scatter plots of differentially expressed genes from nascent RNA (GRO-seq data: GSE94479 (Liu et al, 2017)) between G0/G1 vs G2/M, G0/G1 vs S, or G2/M vs S cell cycle phases in MCF7 cells and their relation against iMab reads near each gene transcription initiation site. Box plots for each differential analysis show upregulated and downregulated genes. Box plots indicate Log2(normalised iMab/INPUT tag on TSS ± 1 kbp) median values and IQRs with whiskers and outstanding data represented as points. Statistical significance was determined by the Wilcoxon rank-sum test between groups. (G0/G1 vs G2/M) and (G0/G1 vs S); P < 2.2 × 10−16 while (G2/M vs S); P = 0.735 Differential expression data (Volcano plots): log2 FC (fold change) on the x axis; y axis log10 (P value). Volcano plots show genes in purple dots which have iMs regions in proximity to the gene body, including TSS, 5’ UTR, promoter, 3’ UTR and exon-related annotations. Percentages show the ratio of genes with proximal iMs over total differentially expressed genes in each group (upregulated or downregulated). Differentially expressed genes (statistically significant) with log2 FC > 0.5 (G0/G1 vs G2/M; n = 1587 upregulated and n = 1430 downregulated genes) (G0/G1 vs S < 2; n = 1951 upregulated and n = 1623 downregulated) (G2/M vs S < 2; n = 734 upregulated and n = 571 downregulated genes).
Figure EV1
Figure EV1. iM immunoprecipitation (controls, repeats).
(A) Regions observed across replicate experiments, intersected iM regions observed after immunoprecipitation of protein-depleted purified DNA from the MCF7 cell-line protein-depleted DNA. Immunoprecipitation experimental repeats using an incubation temperature of 16 °C or 4 °C. (B) Regions observed across experiment repeats in DNA from two different cell-lines. Replicates for HEK293T and U2OS protein-depleted DNA from pulldowns conducted at 4 °C. (C) Pairwise intersection-fraction of overlap pie charts of all-vs-all experiments conducted. (D) Genomic view highlighting an iM structure upstream of the oncogenes ATM, SIRPA, and TSHR. iM regions from each cell line replicates are shown (green tracks: MCF7, brown tracks: MCF7 DNA incubated at 16 °C, purple tracks: HEK293T, blue tracks: U2OS, lower tracks: immunoprecipitation negative control input profiles). (E) hTelo positive control CD curve under variable pH conditions (left panel) and validation of an identified iM candidate upstream of SIRPA and TSHR by DNA synthesis following CD spectroscopy under variable pH (pH 5–8) and a temperature of 25 °C. CD Circular Dichroism.
Figure EV2
Figure EV2. Biophysical validation of iM folding.
(A) Validation of identified iMs by DNA synthesis and circular dichroism spectroscopy at pH 6.0 and a temperature of 25 °C of selected sequences proximal of promoter regions in known oncogenes. NC1(5’-CAGACTGTCGATGAAGCCCTG-3’) and NC2 (5’-CTAGTTATTGCTCAGCGGTG-3’) negative control sequences. (B) Effects of Temperature (25 °C or 37 °C) and pH (pH 6 or pH 7.4) on CD spectroscopy using identified iM regions associated to the genes HOXC13, SIRPA, TSHR, and the positive control hTelo sequence.
Figure EV3
Figure EV3. Distribution and sequences of iM regions in common genomic features, DNA replication zones and TAD boundaries.
(A) Distribution of genomic DNA iM structures across the human genome features. Left panels show the distribution of iM pulldown relative to all TSS regions (Refseq). Centre panels show the percentage of occupancy of iM sites relative to TSS distance. Right panels represent the percentage in relationship with the common gene body features. (B) log2 fold enrichment of iM regions distributed across most common genomic annotations. (C) Relative immunoprecipitated DNA mean signal normalised (sample-input) in relationship to RefSeq gene coordinates. (D) Genomic partition of replication zones (analyses based on repetition of up transition zones (UTZ), early replication zones (ERD), down transition zones (DTZ) and late replication domains (LRD); Tag count heatmaps of G4 (Chambers et al, 2015) (upper panels) and iMs (lower panels; two biological replicates shown). (E) Overlap of iM regions found in DNA purified from MCF7 replicates and previously reported MCF7 TAD boundaries (GSE66733).
Figure EV4
Figure EV4. iM regions occupy transcription machinery and active transcription histone modification sites.
Read count occupancy of iMab pulldowns relative to reported ChIP-sequencing from transcription factors and histone modifications in MCF7 cells (ENCODE) and pairwise intersection of iM regions in MCF7 cells (spearman correlation values shown). (A) Histone modification markers. (B) Chromatin remodelers. (C) Transcription factors and transcription-related machinery. (D) DNA repair-associated molecules.
Figure EV5
Figure EV5. Pathway enrichment across sample sets.
Reactome pathway enrichment analysis across samples from the different cell-lines and conditions. Ten most significant pathways shown with P value adjusted and scaled to highlight ratio of genes.

References

    1. Andrews S (2010) FastQC: a quality control tool for high throughput sequence data. http://www.bioinformatics.babraham.ac.uk/projects/fastqc
    1. Abou Assi H, Garavís M, González C, Damha MJ (2018) i-Motif DNA: structural features and significance to cell biology. Nucleic Acids Res 46:8038–8056 - PMC - PubMed
    1. Amemiya HM, Kundaje A, Boyle AP (2019) The ENCODE blacklist: identification of problematic regions of the genome. Sci Rep 9:9354 - PMC - PubMed
    1. Bailey TL, Boden M, Buske FA, Frith M, Grant CE, Clementi L, Ren J, Li WW, Noble WS (2009) MEME SUITE: tools for motif discovery and searching. Nucleic Acids Res 37:W202–208 - PMC - PubMed
    1. Balasubramanian S, Hurley LH, Neidle S (2011) Targeting G-quadruplexes in gene promoters: a novel anticancer strategy? Nat Rev Drug Discov 10:261–275 - PMC - PubMed