. 2024 Nov;4(11):1544-1561.
doi: 10.1038/s43587-024-00695-z. Epub 2024 Aug 29.

Ribosomal S6 kinase 1 regulates inflammaging via the senescence secretome

Affiliations

Ribosomal S6 kinase 1 regulates inflammaging via the senescence secretome

Suchira Gallage et al. Nat Aging. 2024 Nov.

Abstract

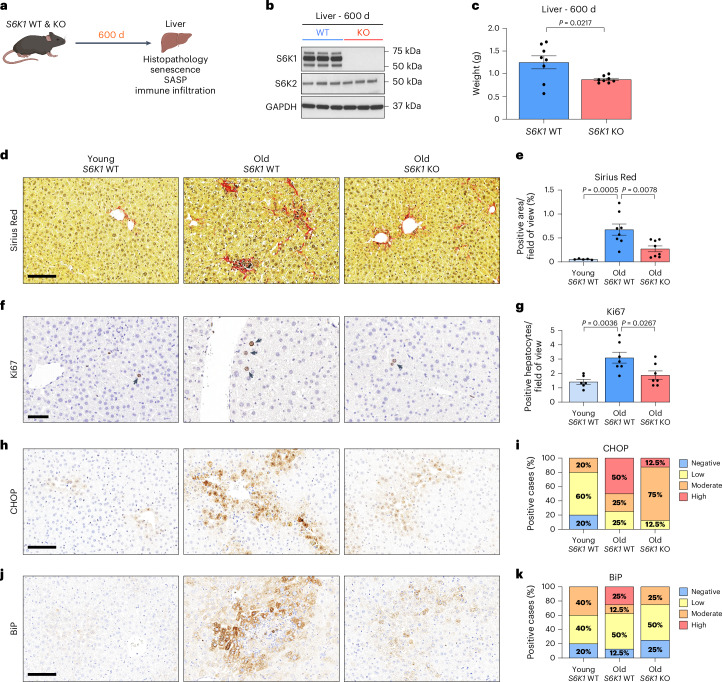
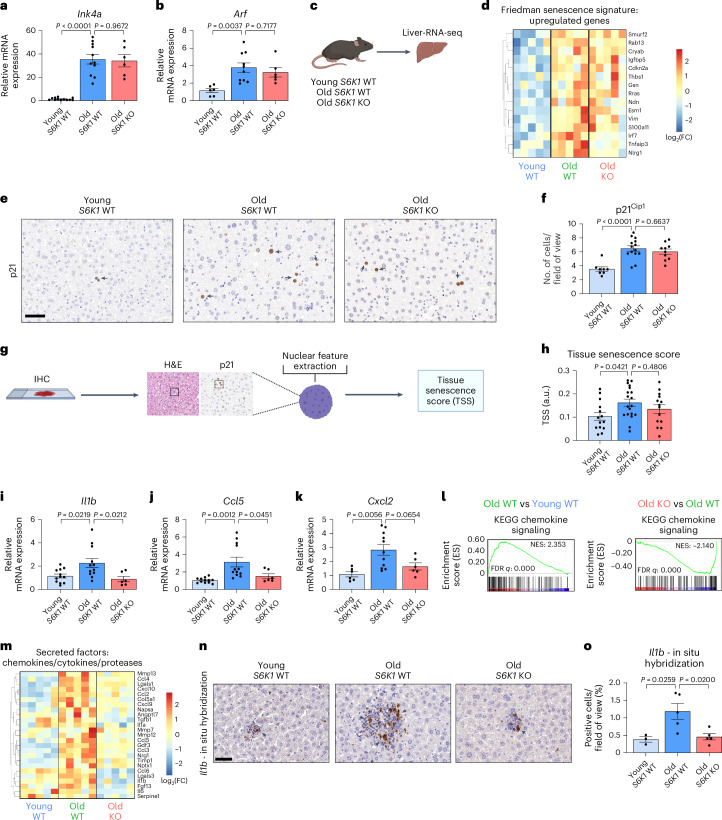
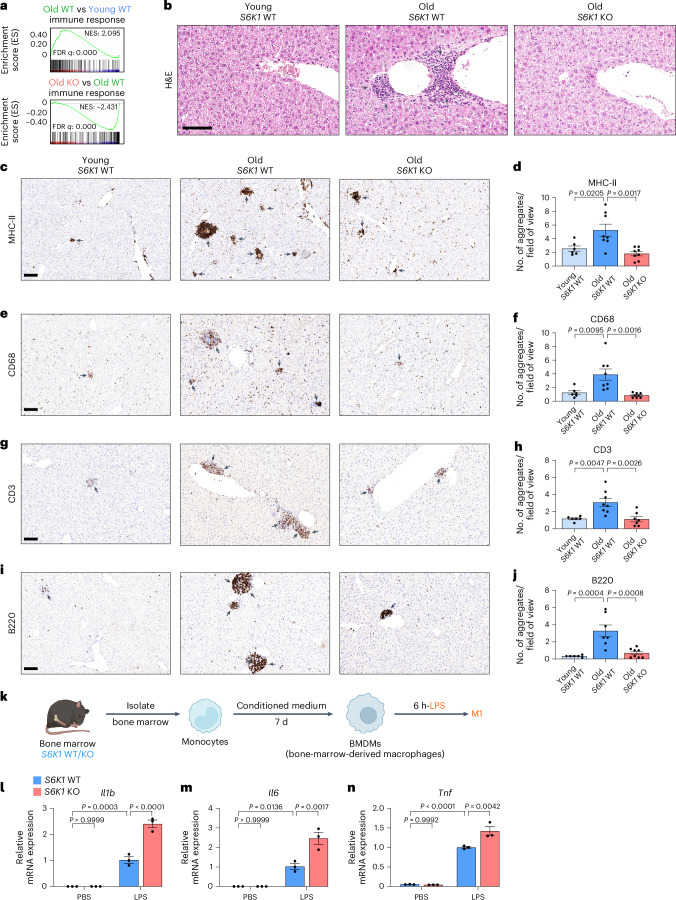
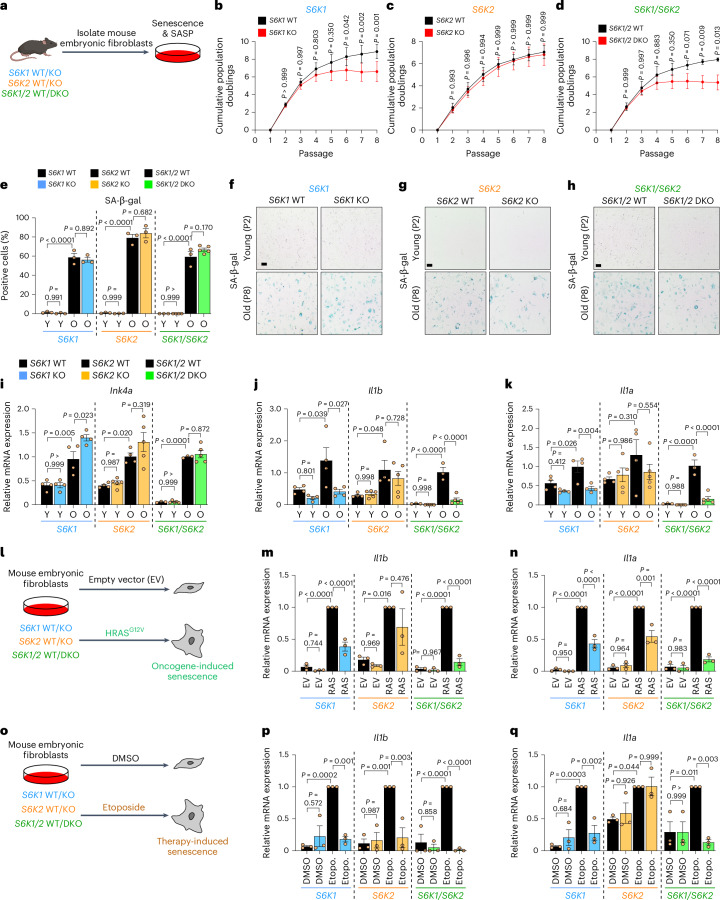
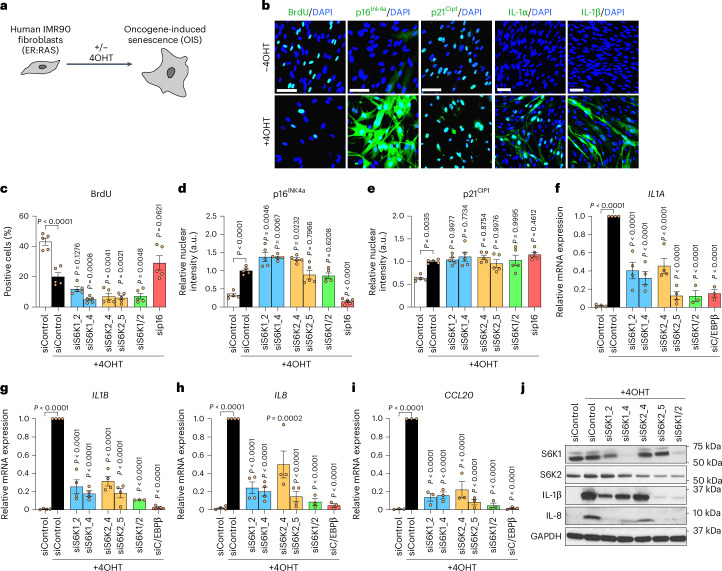
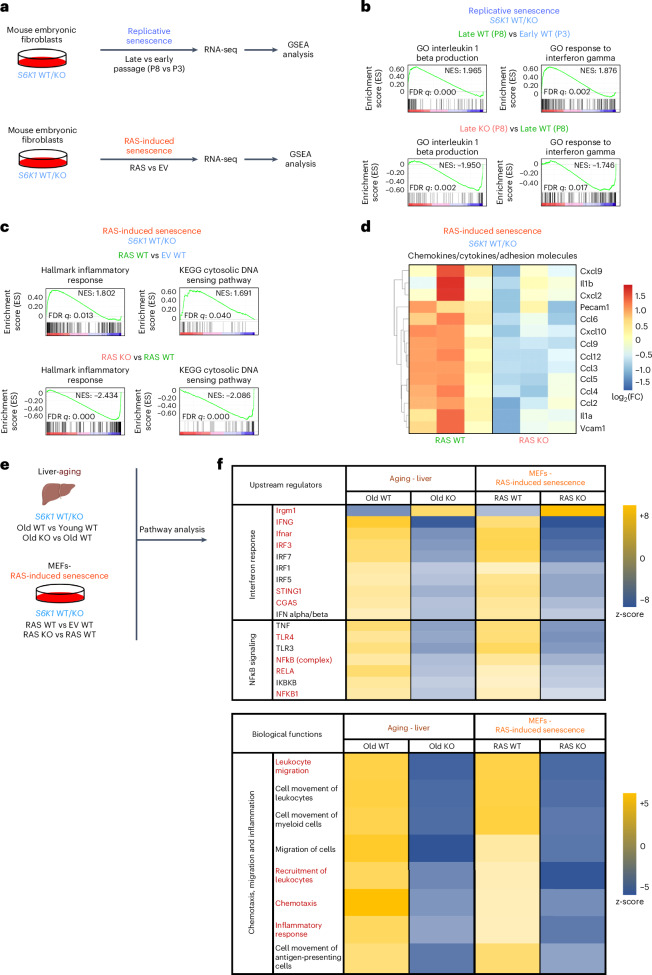
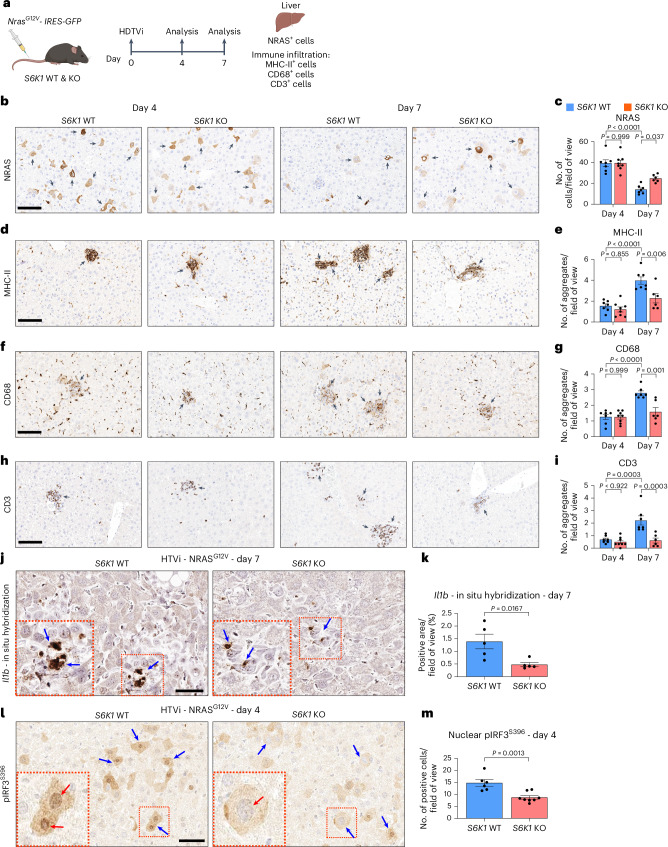
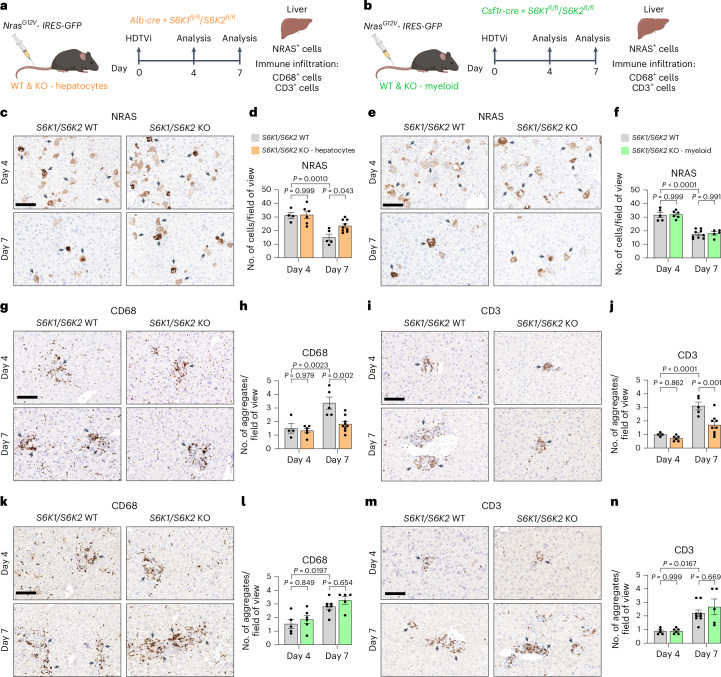
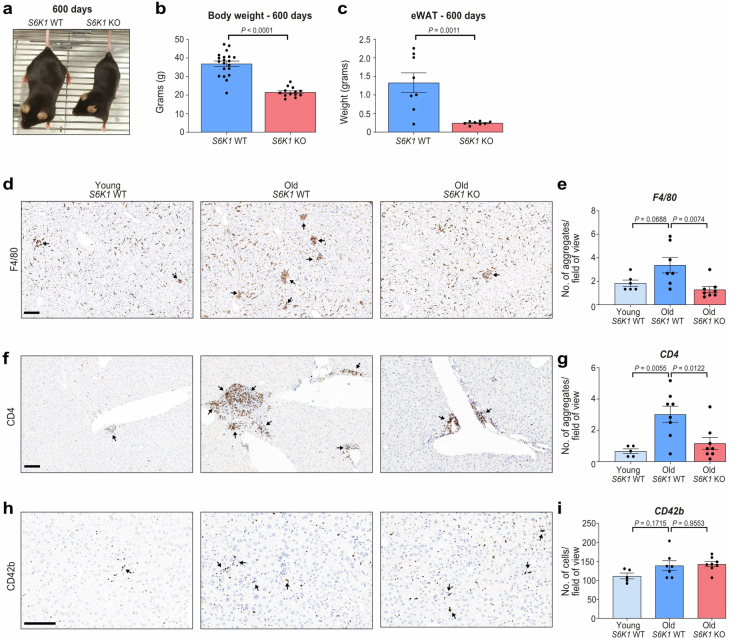
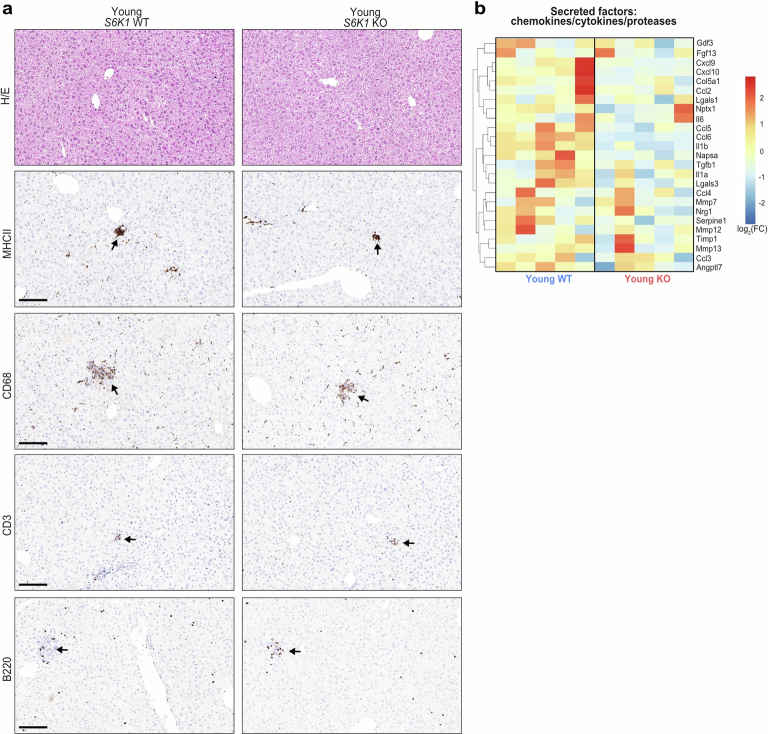
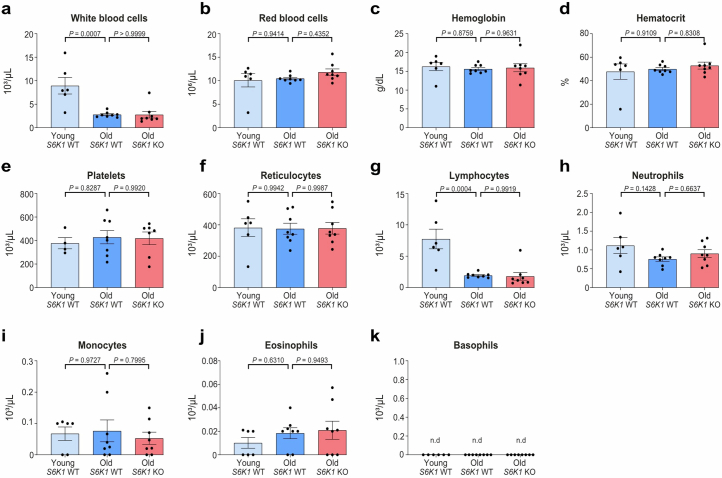
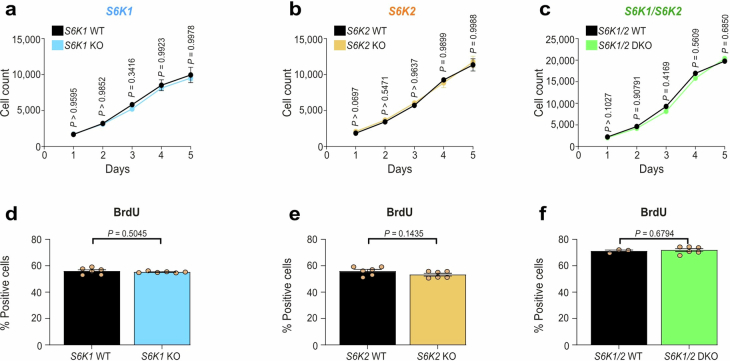
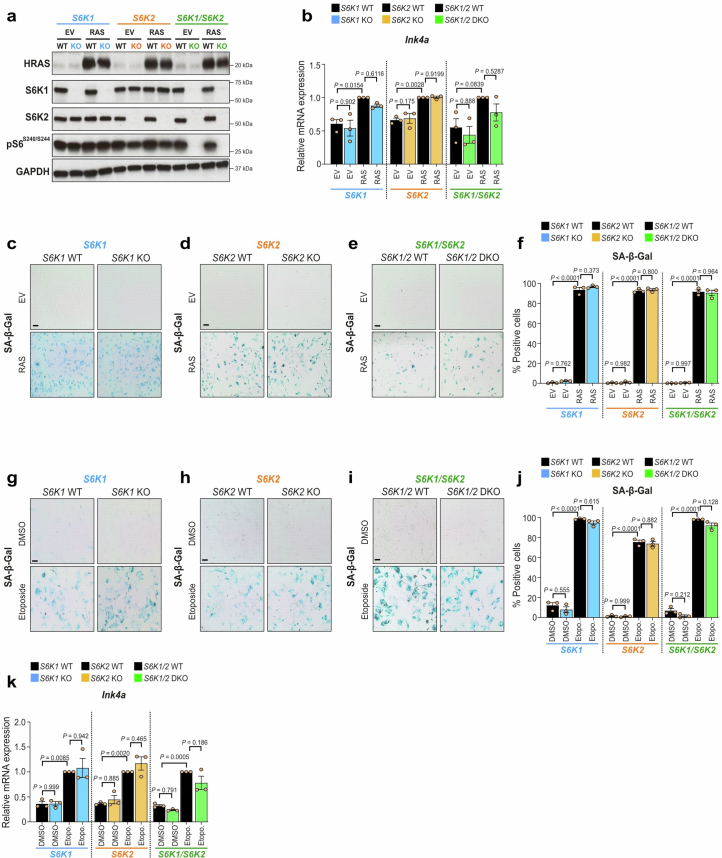
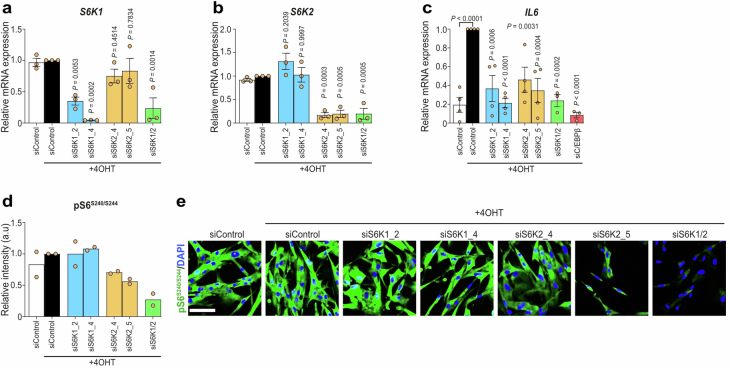
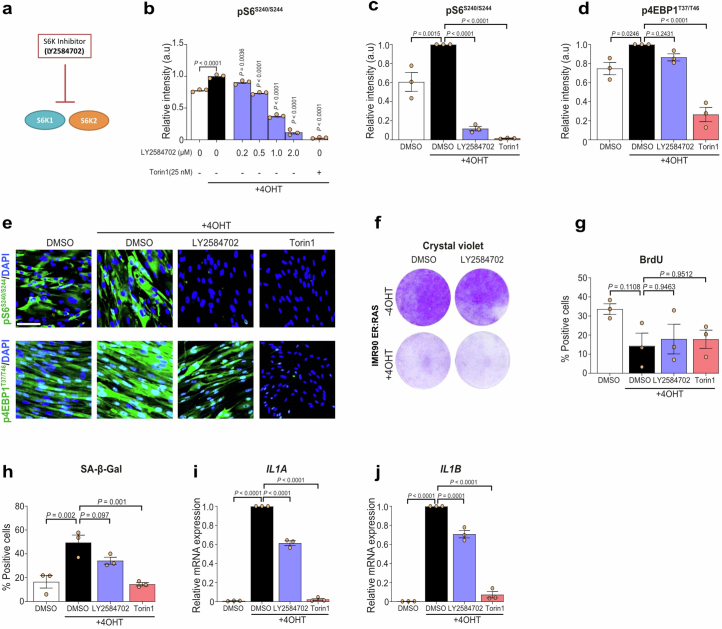
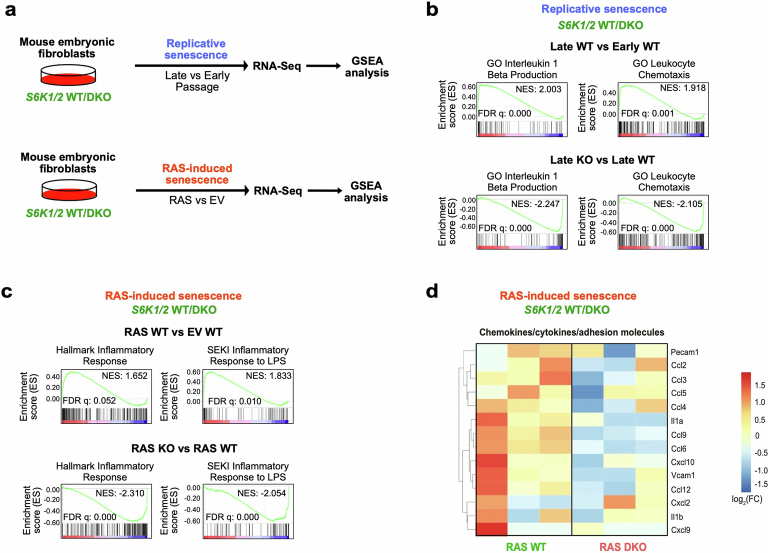
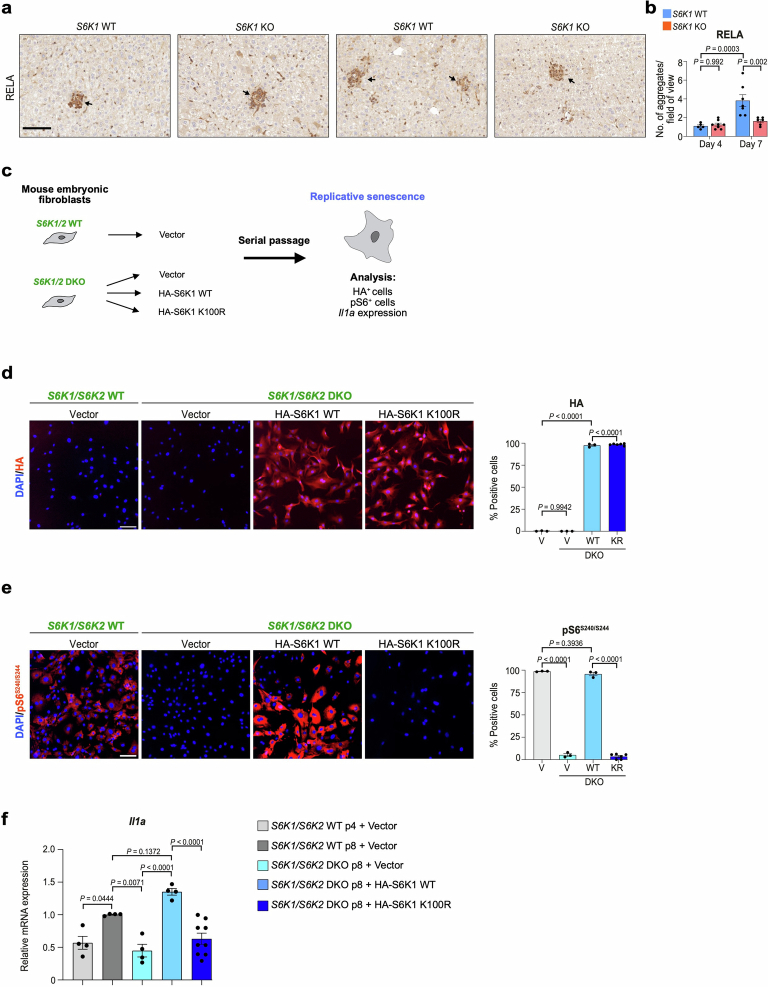
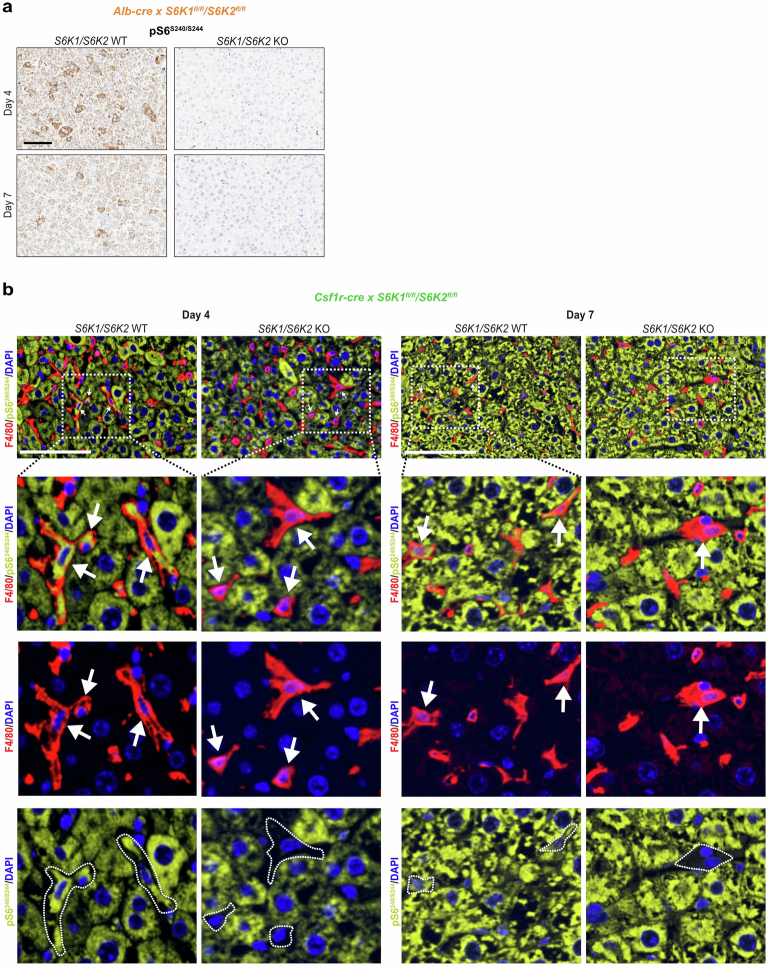
Inhibition of S6 kinase 1 (S6K1) extends lifespan and improves healthspan in mice, but the underlying mechanisms are unclear. Cellular senescence is a stable growth arrest accompanied by an inflammatory senescence-associated secretory phenotype (SASP). Cellular senescence and SASP-mediated chronic inflammation contribute to age-related pathology, but the specific role of S6K1 has not been determined. Here we show that S6K1 deletion does not reduce senescence but ameliorates inflammation in aged mouse livers. Using human and mouse models of senescence, we demonstrate that reduced inflammation is a liver-intrinsic effect associated with S6K deletion. Specifically, we show that S6K1 deletion results in reduced IRF3 activation; impaired production of cytokines, such as IL1β; and reduced immune infiltration. Using either liver-specific or myeloid-specific S6K knockout mice, we also demonstrate that reduced immune infiltration and clearance of senescent cells is a hepatocyte-intrinsic phenomenon. Overall, deletion of S6K reduces inflammation in the liver, suggesting that suppression of the inflammatory SASP by loss of S6K could underlie the beneficial effects of inhibiting this pathway on healthspan and lifespan.


Conflict of interest statement

Competing interests J.G. has been a consultant for Unity Biotechnology, Geras Bio, Myricx Pharma and Merck KGaA. Pfizer and Unity Biotechnology have funded research in J.G.’s laboratory (unrelated to the work presented here). J.G. owns equity in Geras Bio. J.G. is a named inventor in Medical Research Council and Imperial College patents, both related to senolytic therapies (the patents are not related to the work presented here). The remaining authors declare no competing interests.

Figures

Fig. 1
Fig. 1. S6K1 deletion attenuates age-related liver pathology.
a, Experimental scheme. S6K1 WT and KO mice were aged for 600 d to assess senescence. b, Immunoblot images of S6K1, S6K2 and GAPDH protein expression in whole liver lysates of 600-day-old S6K1 WT (left; n = 3) and KO (right; n = 3) mice. GAPDH acted as a loading control for S6K1. S6K2 was run on a separate blot (and, therefore, GAPDH is a sample preparation control for that blot). c, Liver weight (grams) at 600 d from S6K1 WT (n = 8) and KO (n = 8) mice. d,e, Sirius Red staining (d) and quantification (e) in livers in young S6K1 WT (90 d; n = 5), old S6K1 WT (600 d; n = 8) and old S6K1 KO (600 d; n = 8) mice. f,g, Ki67 staining (f) and quantification (g) in livers in young S6K1 WT (90 d; n = 6), old S6K1 WT (600 d; n = 7) and old S6K1 KO (600 d; n = 7) mice. h,i, CHOP staining (h) and quantification (i) in livers in young S6K1 WT (90 d; n = 5), old S6K1 WT (600 d; n = 8) and old S6K1 KO (600 d; n = 8) mice. j,k, BiP staining (j) and quantification (k) in livers in young S6K1 WT (90 d; n = 5), old S6K1 WT (600 d; n = 8) and old S6K1 KO (600 d; n = 8) mice. Data are expressed as mean ± s.e.m. Statistical significance was calculated using either a two-tailed Student’s t-test (c) or one-way ANOVA with Tukey’s multiple comparison test (e,g). n denotes individual mice. Scale bar, 100 μm (d,h,j) or 50 μm (f). Source data
Fig. 2
Fig. 2. S6K1 status affects inflammation but not senescence in the livers of old mice.
a,b, Relative mRNA expression for Ink4a (a) and Arf (b) were assessed by RT–qPCR from whole liver lysates of young S6K1 WT (90 d; n = 12 Ink4a and n = 6 Arf), old S6K1 WT (600 d; n = 11 Ink4a and n = 10 Arf) and old S6K1 KO (600 d; n = 6 for Ink4a and Arf) mice. mRNA expression was normalized to the Rps14 housekeeping gene. c, Experimental scheme. Bulk RNA-seq of whole liver lysates from young S6K1 WT (90 d), old S6K1 WT (600 d) and old S6K1 KO (600 d) mice. d, Heatmap depicting the expression of key regulated genes in the ‘Friedman senescence signature’ in young S6K1 WT (90 d; n = 5), old S6K1 WT (600 d; n = 5) and old S6K1 KO (600 d; n = 5) mice. e,f, p21 staining (e) and quantification (f) of young S6K1 WT (90 d; n = 8), old S6K1 WT (600 d; n = 14) and old S6K1 KO (600 d; n = 10) mice. Scale bar, 50 µm. g, Pipeline for calculating TSSs based on nuclear parameter extraction from H&E-stained liver tissue slides. h, TSSs of young S6K1 WT (90 d, n = 14), old S6K1 WT (600 d, n = 19) and old S6K1 KO (600 d, n = 14) mice. ik, Relative mRNA expression for Il1b (i), Ccl5 (j) and Cxcl2 (k) assessed by RT–qPCR from whole liver lysates of young S6K1 WT (90 d; n = 12 for Il1b and Ccl5; n = 6 for Cxcl2), old S6K1 WT (60 d; n = 12 for Il1b and Ccl5; n = 11 for Cxcl2) and old S6K1 KO (60 d; n = 6 for Il1b, Ccl5 and Cxcl2) mice. mRNA expression was normalized to the Rps14 housekeeping gene. l, GSEA for ‘KEGG Chemokine Signaling’ of young S6K1 WT (90 d), old S6K1 WT (600 d) and old S6K1 KO (600 d) mice from whole liver lysates. m, Heatmap depicting the expression of key chemokines, cytokines and proteases in young S6K1 WT (90 d; n = 5), old S6K1 WT (600 d; n = 5) and old S6K1 KO (600 d; n = 5) mice. n,o, In situ hybridization for Il1b mRNA (n) and quantification (o) in young S6K1 WT (90 d; n = 3), old S6K1 WT (600 d; n = 5) and old S6K1 KO (600 d; n = 5) mice. Scale bar, 50 µm. Data are expressed as mean ± s.e.m. Statistical significance was calculated using one-way ANOVA with Tukey’s multiple comparison test. n denotes individual mice. FC, fold change; FDR, false discovery rate; IHC, immunohistochemistry; NES, normalized enrichment score. Source data
Fig. 3
Fig. 3. S6K1 deletion prevents inflammaging in livers.
a, GSEA for ‘Immune Response’ of young S6K1 WT (90 d), old S6K1 WT (600 d) and old S6K1 KO (600 d) mice from whole liver lysates. b, H&E staining of livers from mice of the indicated genotypes. c,d, MHC-II staining for antigen-presenting cells (c) and quantification (d) of livers from young S6K1 WT (90 d; n = 6), old S6K1 WT (600 d; n = 8) and old S6K1 KO (600 d; n = 8) mice. e,f, CD68 staining for monocytes and macrophages (e) and quantification (f) of livers from young S6K1 WT (90 d; n = 6), old S6K1 WT (600 d; n = 8) and old S6K1 KO (600 d; n = 8) mice. g,h, CD3 staining for T cells (g) and quantification (h) of livers from young S6K1 WT (90 d; n = 6), old S6K1 WT (600 d; n = 8) and old S6K1 KO (600 d; n = 7) mice. i,j, B220 staining for B cells (i) and quantification (j) of livers from young S6K1 WT (90 d; n = 6), old S6K1 WT (600 d; n = 7) and old S6K1 KO (600 d; n = 8) mice. k, Experimental scheme for stimulation of BMDMs. BMDMs were generated from S6K1 WT/KO mice and treated with 100 ng ml−1 LPS for 6 h. ln, Relative mRNA expression of Il1b (l), Il6 (m) and Tnfa (n) assessed by RT–qPCR. mRNA expression was normalized to the Rps14 housekeeping gene (n = 4). Data are expressed as mean ± s.e.m. Statistical significance was calculated using one-way ANOVA with Tukey’s multiple comparison test. n denotes individual mice. Scale bar, 100 μm. FDR, false discovery rate; NES, normalized enrichment score. Source data
Fig. 4
Fig. 4. S6K1 and/or S6K2 deletion does not bypass senescence but dampens SASP induction in MEFs.
a, Experimental scheme. MEFs were generated from S6K1 WT/KO, S6K2 WT/KO and S6K1/2 WT/DKO embryos and were assessed for replicative senescence. MEFs were generated from 3­-5 independent pairs of embryos from at least three different mothers. bd, Cumulative population doublings of S6K1 WT (n = 5) and KO (n = 4) MEFs (b), S6K2 WT (n = 4) and KO (n = 5) MEFs (c) and S6K1/2 WT (n = 3) and DKO (n = 5) MEFs (d). eh, Quantification (e) and representative images (fh) of SA-β-gal staining in young (passage 2) and old (passage 8) MEFs from S6K1 WT and KO (young n = 3; old n = 3), S6K2 WT and KO (young n = 3; old n = 3) and S6K1/2 WT (young n = 3; old n = 3) and DKO (young n = 4; old n = 5) cells. Scale bar, 100 μm. ik, Relative mRNA expression for Ink4a (i), Il1b (j) and Il1a (k) assessed by RT–qPCR from young (passage 3) and old (passage 8) MEFs from S6K1 WT (n = 4) and KO (n = 4), S6K2 WT (n = 4) and KO (n = 5) as well as S6K1/2 WT (n = 3) and DKO (n = 5) cells. mRNA expression was normalized to the Rps14 housekeeping gene. l, Experimental scheme. MEFs of the indicated genotypes were stably transduced with a retroviral vector containing the EV or expressing HRASG12V. MEFs were generated from three independent pairs of embryos from three different mothers. m,n, Relative mRNA expression for Il1b (m) and Il1a (n) assessed by RT–qPCR from MEFs transduced with EV or HRASG12V (RAS) from S6K1 WT (n = 3) and KO (n = 3), S6K2 WT (n = 3) and KO (n = 3) as well as S6K1/2 WT (n = 3) and DKO (n = 3) cells. mRNA expression was normalized to the Rps14 housekeeping gene. o, Experimental scheme. MEFs of the indicated genotypes were treated with DMSO or 5 μM etoposide for 7 d. MEFs were generated from three independent pairs of embryos from three different mothers. p,q, Relative mRNA expression for Il1b (p) and Il1a (q) assessed by RTqPCR from MEFs treated with DMSO or 5 μM etoposide from S6K1 WT (n = 3) and KO (n = 3), S6K2 WT (n = 3) and KO (n = 3) as well as S6K1/2 WT (n = 3) and DKO (n = 3) cells. mRNA expression was normalized to the Rps14 housekeeping gene. Data are expressed as mean ± s.e.m. Statistical significance was calculated using repeated two-way ANOVA with Sidak’s multiple comparison test (bd) or by two-way ANOVA with Tukey’s multiple comparison test (e,ik,m,n,p,q). n denotes individual MEF replicates derived from different embryos. Etopo., etoposide; O, old; P, passage; Y, young. Source data
Fig. 5
Fig. 5. S6K1/2 regulates the SASP without affecting the growth arrest in human fibroblasts undergoing OIS.
a, Experimental scheme. IMR90 fibroblasts were stably transduced with the pLNC-ER:RAS retroviral vector and treated with 4OHT for senescence induction. b, Representative IF staining of BrdU, p16INK4A, IL-1α, IL-1β and IL-8 after 7 d (BrdU and p16Ink4a) or 8 d (SASP) with or without 4OHT treatment in IMR90 ER:RAS cells. Scale bar, 100 μm. ce, IMR-90 ER:RAS cells were reverse transfected with either AllStars (scrambled sequence, siControl) or the indicated siRNAs. Cells were treated with or without 4OHT on the following day to induce senescence. Quantification of IF staining for BrdU incorporation (c), p16INK4A (d) and p21CIP1 (e) after 5 d of 4OHT treatment (n = 5 biological replicates from two independent experiments). fi, Relative mRNA expression for pro-inflammatory SASP components (IL1A, IL1B, IL8, CCL20) assessed by RTqPCR­ after 4 d of 4OHT treatment with the indicated siRNAs (siControl, siS6K1_2, siS6K1_4, siS6K2_4 and siS6K2_5 n = 4 for IL1A, IL1B and IL8 and n = 3 for CCL20; siS6K1/2 and siC/EBPβ n = 3 for IL1A, IL1B, IL8 and CCL20) in IMR90 ER:RAS cells. mRNA expression was normalized to the Rps14 housekeeping gene. n denotes independent experiments. Data are expressed as mean ± s.e.m. Statistical significance was calculated using one-way ANOVA with Dunnett’s multiple comparison test (ci). j, Immunoblot images of a single experiment of S6K1, S6K2, IL-1β, IL-8 and GAPDH after 7 d of 4OHT treatment with the indicated siRNAs in IMR90 ER:RAS cells. IL-8 and GAPDH (loading control) were run on the same blot. S6K1, S6K2 and IL-1β were run on separate blots; therefore, GAPDH served as a sample preparation control for those blots. Source data
Fig. 6
Fig. 6. Transcriptional analysis shows that S6K1 regulates inflammatory pathways.
a, Experimental scheme. MEFs from S6K1 WT/KO embryos were assessed for replicative senescence or RAS-induced senescence. Samples underwent subsequent RNA-seq and GSEA. b. GSEA of early S6K1 WT (passage 3), late S6K1 WT (passage 8) and late S6K1 KO (passage 8) MEFs. c, GSEA of S6K1 WT MEFs expressing an EV, S6K1 WT MEFs expressing RASG12V or S6K1 KO MEFs expressing RASG12V. d, Heatmap illustrating the gene expression pattern of key pro-inflammatory SASP factors involved in RAS-induced senescence. Left, comparison of S6K1 WT MEFs expressing RASG12V (n = 3) with S6K1 WT MEFs expressing EV (n = 3). Right, comparison of S6K1 KO MEFs expressing RASG12V (n = 3) with S6K1 WT MEFs expressing RASG12V (n = 3). e, Schematic of combined pathway analysis of the aging cohort and in MEFs undergoing RAS-induced senescence of the indicated comparisons to identify common upstream regulators and biological functions. f, Top, assessment of common upstream regulators of the SASP in S6K1 KO mice in the aging liver and S6K1 KO MEFs undergoing RAS-induced senescence. Bottom, assessment of biological functions that are commonly regulated in S6K1 KO mice in the aging liver and in S6K1 KO MEFs undergoing RAS-induced senescence. FC, fold change; FDR, false discovery rate; NES, normalized enrichment score; P, passage.
Fig. 7
Fig. 7. S6K1 regulates senescence surveillance.
a, Experimental scheme. HDTVi-based co-delivery of an NrasG12V transposon construct and a transposase expression vector into mouse livers (day 0). Mice were euthanized 4 d or 7 d after HDTVi to assess senescence surveillance. bi, Immunohistochemistry staining for NRAS (b), MHC-II (d), CD68 (f) and CD3 (h) and the corresponding quantification (c,e,g,i) of livers from day 4 S6K1 WT (n = 7) and KO (n = 8) mice and in day 7 S6K1 WT (n = 7) and KO (n = 6) mice. Scale bar, 100 μm. j,k, In situ hybridization for Il1b mRNA (j) and quantification (k) of livers from day 7 S6K1 WT (n = 5) and KO (n = 5) mice. Scale bar, 50 μm. l,m, Immunohistochemistry staining for pIRF3S396 (l) and quantification (m) of livers in day 4 S6K1 WT (n = 6) and KO (n = 8) mice. Scale bar, 50 μm. Data are expressed as mean ± s.e.m. Statistical significance was calculated using two-way ANOVA with Tukey’s multiple comparison test (c,e,g,i) or by two-tailed Student’s t-test (k,m). n denotes individual mice. Source data
Fig. 8
Fig. 8. Hepatocyte-intrinsic S6K signaling mediates the liver inflammatory phenotype.
a,b, Experimental scheme. HDTVi-based co-delivery of an NrasG12V transposon construct and a transposase expression vector into mouse livers (day 0). Mice were euthanized 4 d or 7 d after HDTVi to assess senescence surveillance. Hepatocyte-specific S6K1/S6K2 (a) or myeloid-specific S6K1/S6K2 (b) KO mice or the floxed controls were used. c,d, Immunohistochemistry staining for NRAS (c) and the corresponding quantification (d) of livers from hepatocyte-specific S6K1/S6K2 KO mice or the floxed controls. D4 WT (n = 4), D4 KO (n = 6), D7 WT (n = 5) and D7 KO (n = 9). e,f, Immunohistochemistry staining for NRAS (e) and the corresponding quantification (f) of livers from myeloid-specific S6K1/S6K2 KO mice or the floxed controls. D4 WT (n = 5), D4 KO (n = 6), D7 WT (n = 9) and D7 KO (n = 5). gj, Immunohistochemistry staining for CD68 (g) or CD3 (i) and the corresponding quantification (h and j) of livers from hepatocyte-specific S6K1/S6K2 KO mice or the floxed controls. D4 WT (n = 4), D4 KO (n = 6), D7 WT (n = 5) and D7 KO (n = 9). kn, Immunohistochemistry staining for CD68 (k) or CD3 (m) and the corresponding quantification (l and n) of livers from myeloid-specific S6K1/S6K2 KO mice or the floxed controls. l, D4 WT (n = 5), D4 KO (n = 6), D7 WT (n = 7) and D7 KO (n = 5). n, D4 WT (n = 5), D4 KO (n = 6), D7 WT (n = 9) and D7 KO (n = 5). Data are expressed as mean ± s.e.m. Statistical significance was calculated using two-way ANOVA with Tukey’s multiple comparison test. n denotes individual mice. Scale bar, 100 μm. D, day. Source data
Extended Data Fig. 1
Extended Data Fig. 1. S6K1 deletion attenuated age-induced obesity and ‘inflammaging’ in the liver.
S6K1 wild-type (WT) and knockout (KO) mice were aged for 600 days. a. Representative photograph of 600-day-old S6K1 WT (left) and KO (right) mice. b. Body weight (grams) at 600 days of S6K1 WT (left; n = 20) and KO (right; n = 13) mice. c. Epididymal white adipose tissue (eWAT) weight (grams) at 600 days of S6K1 WT (left; n = 8) and KO (right; n = 8) mice. d-e. F4/80 staining for resident Kupffer cells (d) and quantification (e) of livers from young S6K1 WT (90 days; n = 6), old S6K1 WT (600 days; n = 7) and old S6K1 KO (600 days; n = 8) mice. f-g. CD4 staining for T-helper cells (f) and quantification (g) of livers in young S6K1 WT (90 days; n = 5), old S6K1 WT (600 days; n = 8) and old S6K1 KO (600 days; n = 8) mice. h-i CD42b staining for platelets (h) and quantification (i) of livers in young S6K1 WT (90 days; n = 5), old S6K1 WT (600 days; n = 7) and old S6K1 KO (600 days; n = 8) mice. Data are expressed as mean ± SEM. Statistical significance was calculated using either a two-tailed Student’s t-test (b-c) or a one-way analysis of variance with Tukey’s multiple comparison test (e, g, i). n denotes individual mice. Scale bar, 100 μm. Data are expressed as mean ± SEM. Statistical significance was calculated using. n denotes individual mice. Source data
Extended Data Fig. 2
Extended Data Fig. 2. S6K1 deletion does not affect immune infiltration in young mice.
Immunohistochemistry analysis of immune cell markers in young (90 days) S6K1 WT and KO mice. a. Haematoxylin and eosin (H/E) staining, MHCII staining for antigen-presenting cells, CD68 staining for monocytes and macrophages, CD3 staining for T cells and B220 staining for B cells in liver sections. Scale bar, 100 μm. b. Heatmap depicting the expression of key chemokines, cytokines and proteases in young S6K1 WT (90 days; n = 5) and young S6K1 KO (90 days; n = 5) mice. WT, wild-type. KO, knockout. Data are representative of a single experiment.
Extended Data Fig. 3
Extended Data Fig. 3. S6K1 deletion does not significantly alter the systemic blood count during ageing.
Whole blood of young S6K1 WT (90 days; n = 6 for all measures except n = 4 for platelets), old S6K1 WT (600 days; n = 8) and old S6K1 KO (600 days; n = 8) mice were used to assess the full blood count. a. White blood cell count (103/μL). b. Red blood cell count (106/μL). c. Haemoglobin (g/dL). d. Haematocrit (%). e. Platelet count (103/μL). f. Reticulocytes (103/μL). g. Lymphocytes (103/μL). h. Neutrophils (103/μL). i. Monocytes (103/μL). j. Eosinophils (103/μL). k. Basophils (103/μL). Data are expressed as mean ± SEM. Statistical significance was calculated using a one-way analysis of variance with Tukey’s multiple comparison test. n denotes individual mice. Source data
Extended Data Fig. 4
Extended Data Fig. 4. S6K1 and/or S6K2 deletion do not affect proliferation at early passage in mouse embryonic fibroblasts.
Mouse embryonic fibroblasts (MEFs) from an early passage (passage 2) S6K1 WT/KO, S6K2 WT/KO and S6K1/2 WT/DKO embryos were assessed for cell count and proliferation of the indicated genotypes. a-c. The time course of cell count was assessed by high throughput microscopy of DAPI staining for 5 days. d-f. Percentage of BrdU-positive cells on day 3 of the indicated genotypes. Data are expressed as mean ± SEM. Statistical significance was calculated using either a two-way analysis of variance with Šidák’s multiple comparison test (a-c) or a two-tailed Student’s t-test (d-f). WT, wild-type. KO, knockout. DKO, double knockout. n = 6 biological replicates from a single experiment (a-b and d-e). n = 3 (WT) and n = 6 (DKO) biological replicates from a single experiment (c and f). MEFs isolated from 2 independent pairs of embryos. n = 3-6 biological replicates from a single experiment (c and f). Source data
Extended Data Fig. 5
Extended Data Fig. 5. Induction of senescence in MEFs with different S6K1 and S6K2 status.
a. Immunoblot images of a single experiment for HRAS, S6K1, S6K2, pS6S240/S244 and GAPDH expression. S6K1 and GAPDH (loading control) were run on the same blot. S6K2, pS6S240/S244 and HRAS were run on separate blots; therefore, GAPDH served as a sample preparation control for those blots. b. Relative mRNA expression for Ink4a assessed by RT-qPCR from MEFs transduced with empty vector (EV) or HRASG12V (RAS) from S6K1 WT (n = 3) and KO (n = 3), S6K2 WT (n = 3) and KO (n = 3) as well as S6K1/2 WT (n = 3) and DKO (n = 3) cells. c-f. Quantification (f) and representative images (c-e) of senescence-associated beta-galactosidase (SA-β-Gal) staining in S6K1, S6K2, and S6K1/2 MEFs with the indicated genotype expressing either EV or RAS vector to undergo OIS (n = 3). g-j. Quantification (j) and representative images (g-i) of senescence-associated beta-galactosidase (SA-β-Gal) staining in S6K1, S6K2, and S6K1/2 MEFs with the indicated genotype treated with DMSO or etoposide (5 μM) to undergo TIS (n = 3). k. Relative mRNA expression for Ink4a was assessed by RT-qPCR from MEFs treated with DMSO or etoposide (5 μM) to undergo TIS (n = 3). mRNA expression was normalized to the Rps14 housekeeping gene. Data are expressed as mean ± SEM. Statistical significance was calculated using two-way analysis of variance with Tukey’s multiple comparison test. n denotes individual MEFs generated from independent embryos. WT, wild-type. KO, knockout. DKO, double knockout. Scale bar, 100 μm. Source data
Extended Data Fig. 6
Extended Data Fig. 6. Confirmation of S6K1/2 depletion or inhibition in IMR90 ER: RAS fibroblasts.
IMR90 fibroblasts were stably transduced with the pLNC-ER:RAS retroviral vector and treated with 4-hydroxytamoxifen (4OHT) for senescence induction. a-c. IMR-90 ER:RAS cells were reverse transfected with either Allstars (scrambled sequence - siControl) or the indicated siRNAs. Cells were treated with or without 4OHT on the following day to induce senescence. Relative mRNA expression for S6K1 (a), S6K2 (b) and Il6 (c) was assessed by RT-qPCR­ following 4 days of 4OHT treatment with the indicated siRNAs in IMR90 ER: RAS cells. S6K1 and S6K2: n = 3 for all conditions. IL6: n = 4 for siControl, siS6K1_2, siS6K1_4, siS6K2_4 and siS6K2_5 and n = 3 for siS6K1/2 and siC/EBPβ. mRNA expression was normalized to the Rps14 housekeeping gene. d-e. Quantification (d) and representative immunofluorescence images (e) for phosphorylated ribosomal protein S6S240/S244 staining of the indicated cells (n = 2). Data are expressed as mean ± SEM. Statistical significance was calculated using one-way analysis of variance with Tukey’s multiple comparison test. Scale bar, 100 μm. Source data
Extended Data Fig. 7
Extended Data Fig. 7. Inhibition of S6K1 and S6K2 in IMR90 ER:RAS fibroblasts undergoing RAS-induced senescence.
a. Schematic depicting LY2584702 inhibiting both S6K1 and S6K2. b. IMR90 ER:RAS cells were treated with or without 4OHT in the presence of DMSO, LY2584702 (0.2-2 μM) or Torin1 (25 nM). Quantification of immunofluorescence staining for phosphorylated ribosomal protein S6S240/S244. n = 3 biological replicates of a single experiment. c-e. Quantification (c-d) and representative immunofluorescence images (e) for phosphorylated ribosomal protein S6S240/S244 and phosphorylated eukaryotic translation initiation factor 4E-binding protein 1 (4EBP1) following 7 days of treatment with or without 4OHT in the presence of DMSO, LY2584702 (2 μM) or Torin1 (25 nM). n = 3 independent experiments. f. IMR90 ER:RAS cells were treated with or without 4OHT in the presence of DMSO or LY2584702 (2 μM). Cell proliferation was assessed by colony formation assay (crystal violet staining) following 13 days in culture. g-h. IMR90 ER:RAS cells were treated with or without 4OHT in the presence of DMSO, LY2584702 or Torin1. Quantification of IF staining for BrdU incorporation (g) or senescence-associated beta-galactosidase (SA-β-Gal, h) following 7 days in culture. n = 3 independent experiments. i-j. IMR90 ER: RAS cells were treated with or without 4OHT in the presence of DMSO, LY2584702 or Torin1. Relative mRNA expression for IL1A (i) and IL1B (j) was assessed by RT-qPCR following 6 days of 4OHT treatment. mRNA expression was normalized to the Rps14 housekeeping gene. n = 3 independent experiments. Data are expressed as mean ± SEM. Statistical significance was calculated using one-way analysis of variance with Dunnett’s multiple comparison test. Scale bar, 100 μm. Source data
Extended Data Fig. 8
Extended Data Fig. 8. Transcriptional analysis shows that S6K1/2 regulates inflammatory pathways.
a. Experimental scheme. Mouse embryonic fibroblasts (MEFs) from S6K1/2 WT/DKO embryos were assessed for replicative senescence or RAS-induced senescence. Samples underwent subsequent RNA-sequencing and gene-set enrichment analysis (GSEA). b. GSEA of early S6K1/2 WT (passage 3), late S6K1/2 WT (passage 8) and late S6K1/2 DKO (passage 8) MEFs. c. GSEA of S6K1/2 WT MEFs expressing an empty vector (EV), S6K1/2 WT MEFs expressing RASG12V or S6K1/2 DKO MEFs expressing RASG12V. d. Heatmap illustrating the gene expression pattern of key proinflammatory SASP factors involved in RAS-induced senescence. Left: comparison of S6K1/2 WT MEFs expressing RASG12V (n = 3) with S6K1/2 WT MEFs expressing EV (n = 3). Right: comparison of S6K1/2 DKO MEFs expressing RASG12V (n = 3) with S6K1/2 WT MEFs expressing RASG12V (n = 3). NES: normalized enrichment score. FDR: false discovery rate. WT: wild-type. DKO: double knockout.
Extended Data Fig. 9
Extended Data Fig. 9. S6K1 rescues Il1a expression in double knockout MEFs.
a-b. Immunohistochemistry staining for RELA (a) and the corresponding quantification (b) of livers from Day 4 S6K1 WT (n = 5), KO (n = 8) mice and in Day 7 S6K1 WT (n = 7), KO (n = 6) mice. Scale bar, 100 μm. Data are expressed as mean ± SEM. Statistical significance was calculated using two-way analysis of variance with Tukey’s multiple comparison test. n denotes individual mice. c. Schematic of the rescue experiment performed in S6K1/2 WT or DKO MEFs transduced with the indicated vectors and undergoing replicative senescence. d-e. Representative immunofluorescence (IF) images (left) and quantification (right) of the percentage of cells positive for HA (d) or pS6S240/S244 (e) in S6K1/2 WT or DKO MEFs infected with the indicated vectors. Scale bar: 100 µm. Data represents mean ± SEM (n = 3 for all groups, except for KR n = 6). V, vector; wt, HA-S6K1 WT; KR, HA-S6K1 K100R. Ordinary one-way ANOVA. (Sidak’s multiple comparisons test). f. mRNA expression levels of Il1a in S6K1/2 WT or DKO MEFs with the indicated vectors undergoing replicative senescence measured by qRT-PCR. Data represents mean ± SEM (n = 4 for all groups, except for KR n = 9). Statistical significance was calculated using one-way ANOVA (Sidak’s multiple comparisons test). n represents biological replicates. Source data
Extended Data Fig. 10
Extended Data Fig. 10. Confirmation of deletion in hepatocyte-specific or myeloid-specific S6K1/S6K2 knockout mice.
Hydrodynamic tail vein injection (HDTVi)-based co-delivery of an NrasG12V transposon construct and a transposase expressing vector into mouse livers (day 0). Mice were sacrificed 4 or 7 days following HDTVi to assess senescence surveillance. Hepatocyte-specific S6K1/S6K2 (a) or myeloid-specific S6K1/S6K2 (b) KO mice or the floxed controls were used. a. Immunohistochemistry images for pS6S240/S244 staining in hepatocyte-specific S6K1/S6K2 WT or KO mice. Scale bar: 100 µm. b. Immunofluorescence staining for F4/80 or pS6S240/S244 staining in myeloid-specific S6K1/S6K2 WT or KO mice. Scale bar: 100 µm. Both (a) and (b) were single experiments with the n numbers indicated in Fig. 8.

References

    1. Liu, G. Y. & Sabatini, D. M. mTOR at the nexus of nutrition, growth, ageing and disease. Nat. Rev. Mol. Cell Biol.21, 183–203 (2020). - PMC - PubMed
    1. Johnson, S. C., Rabinovitch, P. S. & Kaeberlein, M. mTOR is a key modulator of ageing and age-related disease. Nature493, 338–345 (2013). - PMC - PubMed
    1. Weichhart, T. mTOR as regulator of lifespan, aging, and cellular senescence: a mini-review. Gerontology64, 127–134 (2018). - PMC - PubMed
    1. Powers, R. W. et al. Extension of chronological life span in yeast by decreased TOR pathway signaling. Genes Dev.20, 174–184 (2006). - PMC - PubMed
    1. Bjedov, I. et al. Mechanisms of life span extension by rapamycin in the fruit fly Drosophila melanogaster. Cell Metab.11, 35–46 (2010). - PMC - PubMed

MeSH terms

Substances

LinkOut - more resources