. 2025 Jan 12;27(1):167-183.
doi: 10.1093/neuonc/noae169.

ENPP1 induces blood-brain barrier dysfunction and promotes brain metastasis formation in human epidermal growth factor receptor 2-positive breast cancer

Affiliations

ENPP1 induces blood-brain barrier dysfunction and promotes brain metastasis formation in human epidermal growth factor receptor 2-positive breast cancer

Liliana Santos et al. Neuro Oncol. .

Abstract

Background: Brain metastasis (BrM) is a devastating end-stage neurological complication that occurs in up to 50% of human epidermal growth factor receptor 2-positive (HER2+) breast cancer (BC) patients. Understanding how disseminating tumor cells manage to cross the blood-brain barrier (BBB) is essential for developing effective preventive strategies. We identified the ecto-nucleotidase ENPP1 (ectonucleotide pyrophosphatase/phosphodiesterase 1) as specifically enriched in the secretome of HER2+ brain metastatic cells, prompting us to explore its impact on BBB dysfunction and BrM formation.

Methods: We used in vitro BBB and in vivo premetastatic mouse models to evaluate the effect of tumor-secreted ENPP1 on brain vascular permeability. BBB integrity was analyzed by real-time fluorescence imaging of 20 kDa Cy7.5-dextran extravasation and immunofluorescence staining of adherens and tight junction proteins. Pro-metastatic effects of ENPP1 were evaluated in an experimental brain metastatic model.

Results: Systemically secreted ENPP1 from primary breast tumors impaired the integrity of BBB with loss of tight and adherens junction proteins early before the onset of BrM. Mechanistically, ENPP1 induced endothelial cell dysfunction by impairing insulin signaling and its downstream AKT/GSK3β/β-catenin pathway. Genetic ablation of ENPP1 from HER2+ brain metastatic cells prevented endothelial cell dysfunction and reduced metastatic burden while prolonging the overall and metastasis-free survival of mice. Furthermore, plasmatic ENPP1 levels correlate with brain metastatic burden and inversely with overall survival.

Conclusions: We demonstrated that metastatic BC cells exploit the ENPP1 signaling for cell transmigration across the BBB and brain colonization. Our data implicate ENPP1 as a potential biomarker for poor prognosis and early detection of BrM in HER2+ BC.

Keywords: BBB dysfunction; ENPP1; HER2-positive breast cancer; brain metastasis; secretome.


Conflict of interest statement

None declared.

Figures

Graphical Abstract
Graphical Abstract
Figure 1.
Figure 1.
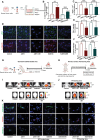
Secretome derived from brain-tropic breast cancer (BC) cells interferes with blood-brain barrier (BBB) permeability in vitro and in vivo (A) Scheme illustrating the establishment of a static BBB in vitro model through the co-culture of endothelial cells (ECs) with human brain vascular pericytes (HBVPs) treated with secretome (SCR) from BC cells. The BBB integrity was evaluated by measuring the (B) 4 kDa FITC-dextran permeability and (C) TEER after 24 hours of treatment, n = 4 to 6. (D) Representative confocal images of ZO-1 and β-catenin immunoreactivity after BBB exposure to the SCR of BC cells. Quantification of (E) ZO-1 and (F) β-catenin immunofluorescence, n = 4 to 6. (G) Schematic diagram illustrating the preparation and administration schedule of the BC cell-derived SCR in mice, with mice receiving daily i.p. injections for 15 days, followed by assessment of BBB integrity through fluorescence imaging (FLI) detection. (H) Schematic diagram illustrating the orthotopic injection of the brain-tropic BC cells into the mammary fat pad. BBB integrity was assessed by FLI detection when the primary tumor (PT) reached a maximum volume of 50–60 mm3. Representative FLI images of (I) SCR-treated mice (n = 3) and (J) PT-bearing mice (n = 3) in vivo (top) and ex vivo (bottom) acquired at 2 hours post-injection of 20 kDa Cy7.5-dextran. The color scale shows radiant efficiency. (K) Representative confocal images of collagen ІV, albumin, and claudin-5 immunostaining in the brain vessels of SCR-treated mice (left) and PT-bearing mice (right). Statistical significance was assessed using one-way ANOVA followed by Turkey’s multiple comparison test. ***P < .001, ****P < .0001 compared to control (dashed line). #P < .05, ###P < .001, ####P < .0001 compared to SCR from parental JIMT-1 cells; $P < .05, $$$$P < .0001, compared to SCR from parental SUM190 cells. Nuclei were stained with Hoechst 33342. Scale Bar: 20 µm.
Figure 2.
Figure 2.
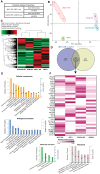
Proteomic analysis identifies ENPP1 as a brain metastatic protein. (A) List of total proteins and differentially expressed proteins (DEPs) between the 2 pairwise comparison groups JIMT-1-BR versus JIMT-1 and SUM190-BR versus SUM190 cells. (B) Principal component and (C) unsupervised hierarchical clustering analysis of the SCR from breast cancer (BC) cell lines. (D) Venn diagram illustrating the overlap of DEPs identified in both comparisons, revealing common proteins in the SCR of brain-tropic cells. (E) Gene ontology analysis encompassing cellular components, biological process, and molecular functions, along with Reactome pathway enrichment analysis output of the 35 common DEPs between the 2 pairwise comparison groups. Numbers of involved proteins are indicated by the left y-axis and displayed as bars; P-values (as −Log10 values) are indicated by the right y-axis and displayed in dots. (F) Heatmap of protein abundance expression of the 35 common DEPs in BC cell lines.
Figure 3.
Figure 3.
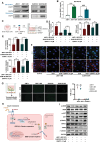
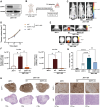
ENPP1 triggers blood-brain barrier (BBB) dysfunction by suppressing the AKT/GSK3β/β-catenin pathway in brain endothelial cells. (A) Representative western blot of ENPP1 expression in breast cancer (BC) cell lysates (top) and SCR (bottom). (B) ELISA analysis of ENPP1 levels in the SCR of BC cells. Statistical significance was assessed using Mann–Whitney test. ***P < .001 compared to JIMT-1-BR cells. ###P < .001 compared to SUM190-BR cells. (C) Scheme illustrating the establishment of a static BBB in vitro model through the co-culture of endothelial cells (ECs) with HBVPs treated with SCR from brain-tropic cells in the absence or presence of the ENPP1 inhibitor (ENPP1i) at 10 µM. The BBB integrity was evaluated by measuring the (D) 4 kDa FITC-dextran permeability and TEER after 24 hours of treatment, n = 4 to 6. (E) Quantification of ZO-1 and β-catenin immunofluorescence and (F) representative confocal images of ZO-1 and β-catenin immunoreactivity in ECs after treatments, n = 4 to 6. (G) Schematic illustration of GFP+ BC cells transmigration through the BBB after exposure to the SCR from BC cells, in the presence or absence of ENPP1i. Quantification and representative images of transendothelial migration (TEM) of BC cells across the BBB, n = 3. Statistical significance was assessed using Mann–Whitney test. ####P < .0001 compared to JIMT-1 cells. $$$$P < .0001 compared to SUM190 cells. Scale Bar: 100 µm (H) Schematic diagram illustrating the EC dysfunction mediated by ENPP1 by suppressing insulin signaling and downstream AKT/GSK3β/β-catenin pathway. (I) Representative images from western blot analysis of p-INSR, INSR, p-AKT, AKT, p-GSK3β, GSK3β, AXIN2, and β-catenin in ECs upon the treatment with the SCR, in the presence or absence of ENPP1i, n = 4 to 5. GAPDH was used as the loading control and for band density normalization. Statistical significance was assessed using one-way ANOVA followed by Turkey’s multiple comparison test. **P < .01, ****P < .0001 compared to control (dashed line). ####P < .0001 compared to SCR from JIMT-1-BR cells; $$P < .01, $$$P < .001 $$$$P < .0001 compared to SCR from SUM190-BR cells. Nuclei were stained with Hoechst 33342. Scale Bar: 20 µm.
Figure 4.
Figure 4.
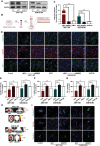
ENPP1 knockdown in brain metastatic cells prevents blood-brain barrier (BBB) dysfunction. (A) Representative western blot of ENPP1 expression in wild type (WT), non-targeting siRNA (siNT) and ENPP1 siRNA knockdown (siENPP1) in JIMT-1-BR (left) and SUM190-BR (right) brain metastatic cells. (B) Scheme of the microfluidic-based BBB in vitro model established by the co-culture of endothelial cells (ECs) with HBVPs under flow conditions treated with SCR from parental cells, siENPP1, and siNT brain-tropic cells. The BBB integrity was evaluated by measuring the (C) 4 kDa FITC-dextran permeability, n = 3. (D) Representative confocal images of claudin-5, β-catenin, ZO-1 immunoreactivity. Quantification of immunofluorescence levels of (E) claudin-5, (F) β-catenin, and (G) ZO-1 proteins in ECs. (H) Representative FLI images of in vivo and ex vivo SCR-treated mice acquired at 2h post-injection of 20 kDa Cy7.5-dextran, n = 3 per group. The color scale shows radiant efficiency. (I) Representative confocal images of collagen ІV, albumin, and claudin-5 immunostaining in the brain vessels. Statistical significance was assessed using one-way ANOVA followed by Dunn’s multiple comparison test. *P < .05, **P < .01, ***P < .001, ****P < .0001 compared to control (dashed line). ##P < .01, ###P < .001, ####P < .0001 compared to SCR from siNT JIMT-1-BR cells; $P < .05, $$P < .01 $$$P < .001, $$$$P < .0001 compared to SCR from siNT SUM190-BR cells. Nuclei were stained with Hoechst 33342. Scale Bar: 20 µm.
Figure 5.
Figure 5.
Primary tumor (PT) disrupts the blood-brain barrier (BBB) through the systemic release of ENPP1. (A) Representative western blot of ENPP1 expression in LOXP (control vector) and ENPP1 knockout (KO) JIMT-1-BR cells. (B) Schematic diagram illustrating the orthotopic injection of JIMT-1-BR (WT and ENPP1-KO) and parental JIMT-1 cells into the mammary fat pad. BBB integrity was assessed by FLI detection when the PT reached a maximum volume of 50–60 mm3, n = 3 per group. (C) Representative BLI images of PT 15 days after the implementation of breast cancer (BC) cells. The color scale shows radiance (photons/sec/cm2/sr). (D) Volumes of orthotopic primary breast tumors over time. (E) Representative FLI images and (F) quantification of fluorescence in PT-bearing mice in vivo (left) and ex vivo (right) 2 hours post-injection of 20 kDa Cy7.5-dextran. The color scale shows radiant efficiency. (G) Plasma levels of ENPP1 in healthy mice and mice bearing PTs from JIMT-1, WT JIMT-1-BR, and ENPP1-KO JIMT-1-BR cells. (H) Representative immunohistochemical images of ENPP1 expression (top) and histopathological H&E (bottom) in resected PTs. Scale bars: 1 mm (left) and 100 µm (right). Statistical significance was assessed using one-way ANOVA followed by Dunn’s multiple comparison test. *P < .05, **P < .01, ****P < .0001 compared to WT JIMT-1-BR PT-bearing mice.
Figure 6.
Figure 6.
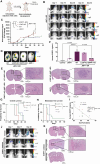
ENPP1 knockout decreases the metastatic potential of brain metastatic cells. (A) Scheme of the experimental model of BrM established by intracardiac injection of parental JIMT-1 (n = 3) and JIMT-1-BR WT (n = 6), LOXP-KO (n = 6), and ENPP1-KO (n = 9) cells into the left ventricle. (B) Representative BLI images of experimental BrM formation over time post-intracardiac injection of breast cancer (BC) cells. The color scale shows radiance (photons/sec/cm2/sr) (C) Quantification of BLI signal intensities over time (fold change from day 0 BLI measurement). Statistical significance was assessed using two-way ANOVA followed by Turkey’s multiple comparison test. *P < .05, **P < .01 compared to ENPP1-KO JIMT-1-BR BrM-bearing mice. (D) Ex vivo imaging of GFP+ BC cells in the brain. The color scale shows radiant efficiency. (E) Representative images of histopathological H&E of whole brain sections showing the number and size of BrMs. Scale bars: 1 mm, in inserts: 250 µm. (F) Plasma levels of ENPP1 in healthy mice and mice bearing BrM from JIMT-1, WT JIMT-1-BR, LOXP-KO JIMT-1-BR, and ENPP1-KO JIMT-1-BR cells. Statistical significance was assessed using one-way ANOVA followed by Turkey’s multiple comparison test. ****P < .0001 compared to WT JIMT-1 BrM-bearing mice. Survival analysis by Kaplan–Meier showed a significantly shortened (G) overall survival (P = .048) and (H) metastasis-free survival (P = 0.0235) for mice bearing BrM from ENPP1-KO compared to LOXP-KO. Statistical significance was assessed using log-rank test. (I) Two-sided Pearson correlation was assessed between ENPP1 plasma levels and overall survival of mice. (J) Representative BLI images showing the progression of BrM formation over time in mice treated with an ENPP1 inhibitor (n = 5) or vehicle (n = 3). The color scale shows radiance (photons/sec/cm2/sr). (K) Representative images of histopathological H&E of whole brain sections showing brain metastatic foci. Scale bars: 1 mm, in inserts: 250 µm.

References

    1. Nayak L, Lee EQ, Wen PY.. Epidemiology of brain metastases. Curr Oncol Rep. 2012;14(1):48–54. - PubMed
    1. Heitz F, Rochon J, Harter P, et al.Cerebral metastases in metastatic breast cancer: Disease-specific risk factors and survival. Ann Oncol. 2011;22(7):1571–1581. - PubMed
    1. Hackshaw MD, Danysh HE, Henderson M, et al.Prognostic factors of brain metastasis and survival among HER2-positive metastatic breast cancer patients: A systematic literature review. BMC Cancer. 2021;21(1):967. - PMC - PubMed
    1. Riggio AI, Varley KE, Welm AL.. The lingering mysteries of metastatic recurrence in breast cancer. Br J Cancer. 2021;124(1):13–26. - PMC - PubMed
    1. Carvalho R, Paredes J, Ribeiro A.. Impact of breast cancer cells secretome on the brain metastatic niche remodeling. Semin Cell Dev Biol. 2020;60:294–301. - PubMed

Substances