. 2024 Aug 29;24(1):1068.
doi: 10.1186/s12885-024-12816-3.

Construction of a prognostic model for disulfidptosis-related long noncoding RNAs in R0 resected hepatocellular carcinoma and analysis of their impact on malignant behavior

Affiliations

Construction of a prognostic model for disulfidptosis-related long noncoding RNAs in R0 resected hepatocellular carcinoma and analysis of their impact on malignant behavior

Xuefeng Gu et al. BMC Cancer. .

Abstract

Background: Disulfidptosis is an emerging form of cellular death resulting from the binding of intracellular disulfide bonds to actin cytoskeleton proteins. This study aimed to investigate the expression and prognostic significance of hub disulfidptosis-related lncRNAs (DRLRs) in R0 resected hepatocellular carcinoma (HCC) as well as their impact on the malignant behaviour of HCC cells.

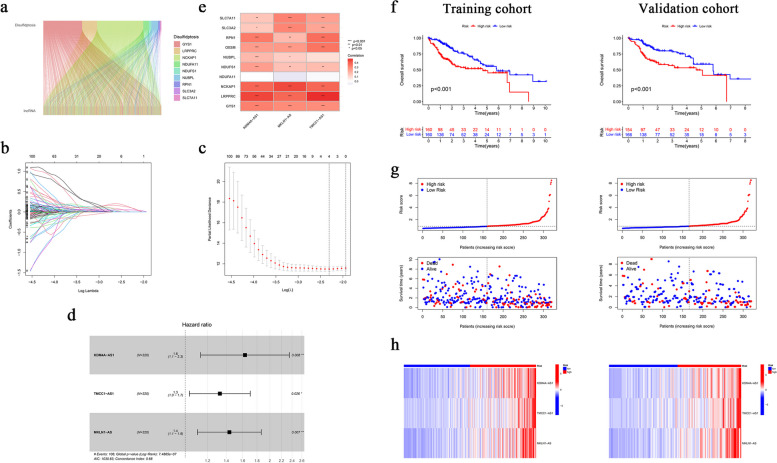
Methods: A robust signature for R0 resected HCC was constructed using least absolute shrinkage and selection operator (LASSO) and multivariate Cox regression and was validated in an independent internal validation cohort to predict the prognosis of R0 HCC patients. Comprehensive bioinformatics analysis was performed on the hub DRLRs (KDM4A-AS1, MKLN1-AS, and TMCC1-AS1), followed by experimental validation using quantitative real-time polymerase chain reaction (qRT‒PCR) and cellular functional assays.

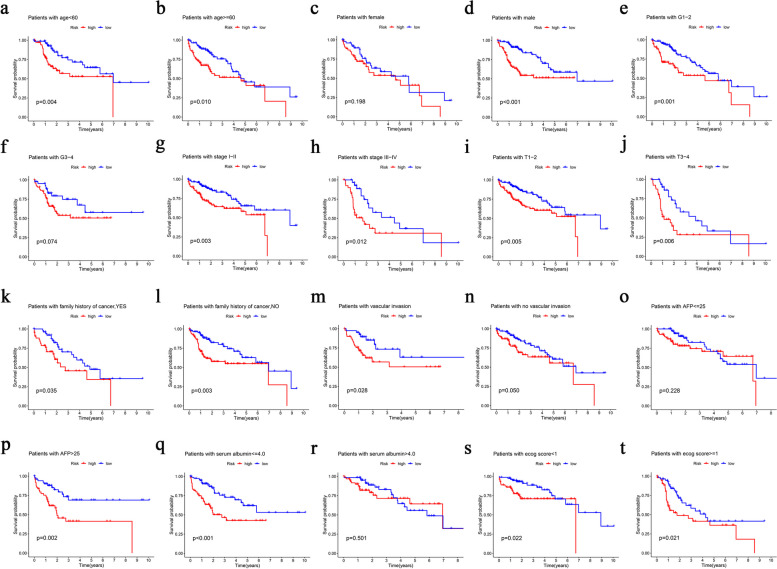
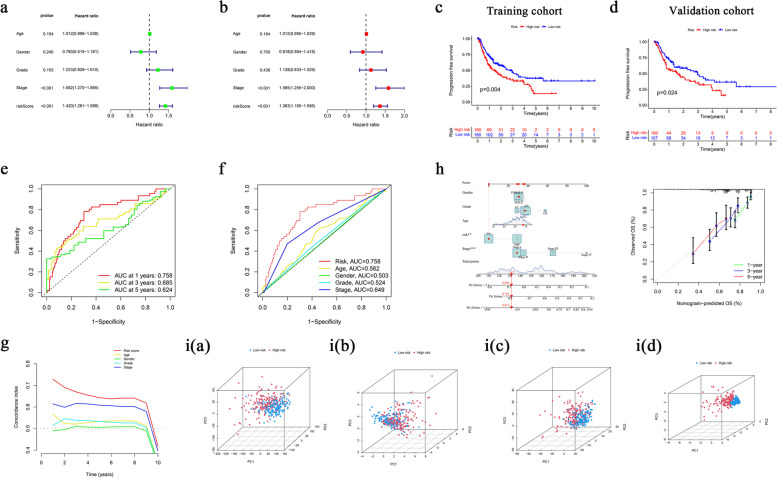
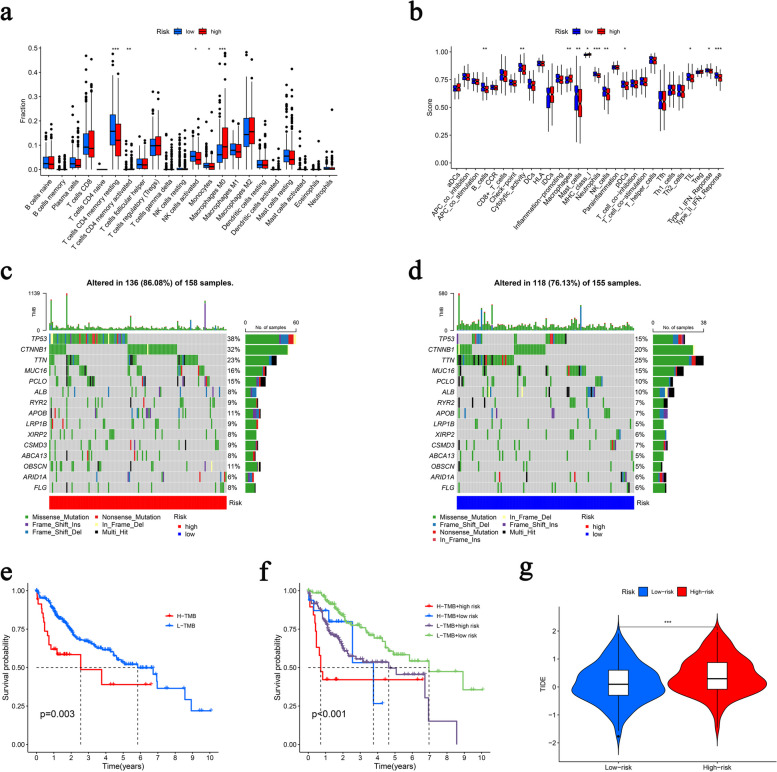
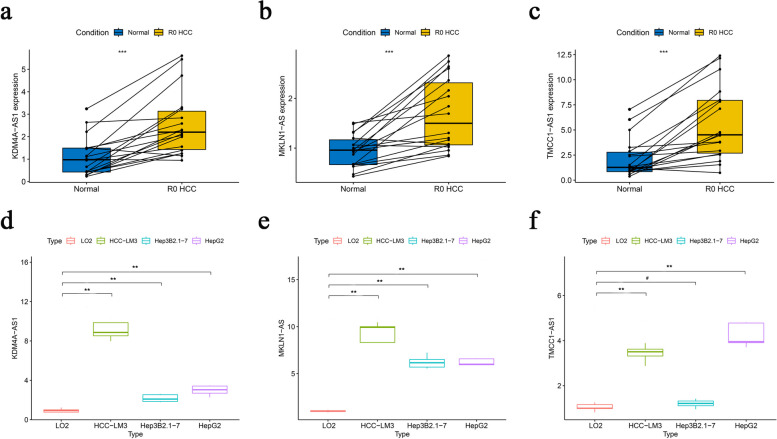
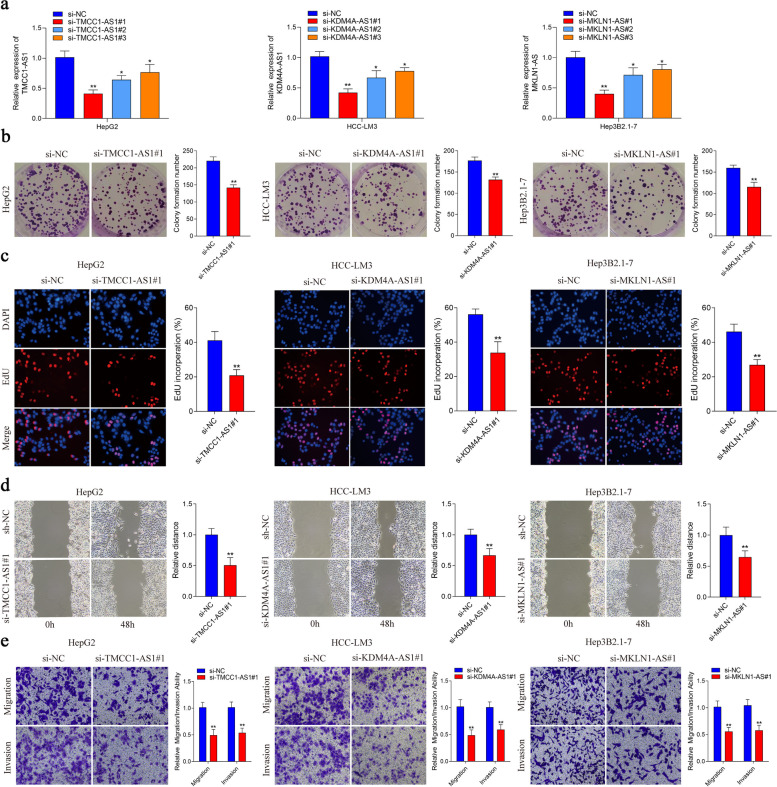
Results: The signature served as an independent prognostic factor applicable to R0 HCC patients across different age groups, tumour stages, and pathological characteristics. Gene Ontology (GO) and gene set enrichment analysis (GSEA) revealed hub pathways associated with this signature. The high-risk group presented an increased abundance of M0 macrophages and activated memory CD4 T cells as well as elevated macrophage and major histocompatibility complex (MHC) class I expression. High-risk R0 HCC patients also presented increased tumour immune dysfunction and exclusion scores (TIDEs), mutation frequencies, and tumour mutational burdens (TMBs). Drug sensitivity analysis revealed that high-risk patients were more responsive to drugs, including GDC0810 and osimertinib. High expression levels of the three hub DRLRs were detected in R0 HCC tissues and HCC cell lines. Functional assays revealed that the three hub DRLRs enhanced HCC cell proliferation, migration, and invasion.

Conclusions: A signature was constructed on the basis of three DRLRs, providing novel insights for personalized precision therapy in R0 HCC patients.

Keywords: Bioinformatics; Disulfidptosis; Hepatocellular carcinoma; KDM4A-AS1; Long noncoding RNA; MKLN1-AS; Malignant biological behaviours; R0 resection; TMCC1-AS1.


Conflict of interest statement

The authors declare no competing interests.

Figures

Fig. 1
Fig. 1
Construction of an R0 hepatocellular carcinoma (HCC) prognostic necroptosis-related lncRNA (DRLR) risk model. a Sankey diagram of the coexpression of 9 disulfideptosis-related genes with 1142 DRLRs in R0 HCC. b, c Prognostic prediction model constructed via least absolute shrinkage and selection operator (LASSO)-Cox regression analysis. d Coexpression of 10 disulfideptosis-related genes and 3 prognostic hub disulfideptosis-related lncRNAs. e Coexpression of 10 disulfideptosis-related genes and 3 prognostic hub disulfideptosis-related lncRNAs. f Kaplan‒Meier (KM) survival curves for the high-risk and low-risk groups in the training and validation cohorts. g Risk score distribution and survival status of HCC patients in the training and validation cohorts. h Risk heatmap of 3 hub prognostic DRLRs in the training and validation cohorts. Significant differences are indicated by *P < 0.05, **P < 0.01, and ***P < 0.001
Fig. 2
Fig. 2
KM survival curve analysis of overall survival (OS) between the high-risk and low-risk groups in the HCC clinicopathological feature subgroups via the 3-DRLR signature. a Age < 60 years, b Age ≥ 60 years, c Female, d Male, e Grade 1–2, f Grade 3–4, g Stage I-II, h Stage III-IV, (i) T1-2, j T3-4, k tumour family history, l no tumour family history, m vascular invasion, n no tumour vascular invasion, o alpha-fetoprotein (AFP) level ≤ 25 ng/mL, p AFP level > 25 ng/mL, q serum albumin level ≤ 4.0 g/dl, r serum albumin level > 4.0 g/dl, s Eastern Cooperative Oncology Group (ECOG) score < 1, t Eastern Cooperative Oncology Group (ECOG) score ≥ 1
Fig. 3
Fig. 3
Independent prognostic analysis, validation of the risk model and principal component analysis (PCA). a Univariate Cox analysis. Statistically significant differences in the TNM stage and risk score were noted. b Multivariate Cox analysis. Statistically significant differences in the TNM stage and risk score were noted. c KM survival curve of progression-free survival (PFS) for the high-risk and low-risk groups in the training cohort. d KM survival curve of PFS in the validation cohort. e A time-receiver operating characteristic (timeROC) curve was used to predict the 1-, 3-, and 5-year OS of R0 HCC patients. f MultiROC curve analysis revealed that the predictive accuracy of the risk model is superior to that of other clinical parameters. g C-index showing that the predictive accuracy of the risk model is superior to that of other clinical parameters. h Nomogram for predicting prognosis based on the 3-DRLR signature score and calibration curve for predicting 1-year, 3-year, and 5-year overall survival. PCA between the high-risk and low-risk groups was performed on the basis of (ia) all genes, (ib) disulfideptosis-related genes, (ic) DRLRs, and (id) 3-DRLR prognostic markers
Fig. 4
Fig. 4
Gene Ontology (GO) and gene set enrichment analysis (GSEA). a Bar chart of the top 10 enriched GO terms. b Circle diagram of the GO enrichment analysis results. GSEA revealed significant differences in enrichment in the TCGA R0 HCC cohort for the c2.all.v2022.1.Hs.symbols.gmt gene set between the 3-DRLR signature high-risk group (c) and low-risk group (d) and for the c5.all.v2022.1.Hs.symbols.gmt gene set between the high-risk group (e) and low-risk group (f). Significant enrichment in the h.all.v2022.1.Hs.symbols.cmt gene set was found in the high-risk group (g)
Fig. 5
Fig. 5
Immune landscape of HCC patients and the relationship between tumour mutation burden (TMB) and the risk score. a Percentages of 22 immune cells in the high- and low-risk groups were calculated via the CIBERSORT algorithm. b Immune function scores of patients in the high- and low-risk groups. c, d Waterfall charts of somatic mutation features for both groups. e KM survival curves of the high- and low-TMB groups. f KM survival curves of the four groups. g Analysing immune escape on the basis of tumour immune dysfunction and exclusion (TIDE) scores. Significant differences are indicated by *P < 0.05, **P < 0.01, and ***P < 0.001
Fig. 6
Fig. 6
Drug sensitivity of HCC patients in the high-risk and low-risk groups on the basis of the 3-DRLR signature. The top 5 drugs in terms of drug sensitivity and drug resistance are shown. The HCC patients in the high-risk group were more sensitive to (a) GDC0810, (b) MK-8776, (c) osimertinib, (d) paclitaxel, and (e) YK-4–279 and more resistant to (f) JAK1_8709, (g) JQ1, (h) Nutlin-3a (-), (i) PF-4708671, and (j) SB505124
Fig. 7
Fig. 7
Validation of prognostic hub lncRNA expression levels in the 3-DRLR model in clinical samples and HCC cell lines. KDM4A-AS1 (a), MKLN1-AS (b), and TMCC1-AS1 (c) expression levels in paired clinical samples of R0 HCC and paracancerous tissues. KDM4A-AS1 (d), MKLN1-AS (e), and TMCC1-AS1 (f) expression levels in the HCC cell lines HepG2, Hep3B2.1–7, and HCC-LM3 and normal liver tissue L02. Significant differences are indicated by *P < 0.05 and **P < 0.01, whereas # denotes no significant difference
Fig. 8
Fig. 8
Effects of three hub lncRNAs on the biological functions of HCC cells in vitro. The knockdown efficiency in HepG2, HCC-LM3 and Hep3B2.1-7 cells was detected using quantitative real-time polymerase chain reaction (qRT‒PCR) (a). Colony formation assay of HCC cells transfected with si-NC and si-RNA (b). EdU assay of HCC cells transfected with si-NC and si-RNA (c). Wound healing assay of HCC cells transfected with si-NC and si-RNA (d). Transwell assays of HCC cells transfected with si-NC and si-RNA (e). Significant differences are indicated by *P < 0.05 and **P < 0.01.

Similar articles

Cited by

References

    1. Sung H, Ferlay J, Siegel RL, Laversanne M, Soerjomataram I, Jemal A, et al. Global cancer statistics 2020: GLOBOCAN estimates of incidence and mortality worldwide for 36 cancers in 185 countries. CA Cancer J Clin. 2021;71:209–49. 10.3322/caac.21660 - DOI - PubMed
    1. Yang JD, Hainaut P, Gores GJ, Amadou A, Plymoth A, Roberts LR. A global view of hepatocellular carcinoma: trends, risk, prevention and management. Nat Rev Gastroenterol Hepatol. 2019;16:589–604. 10.1038/s41575-019-0186-y - DOI - PMC - PubMed
    1. Yang YQ, Wen ZY, Liu XY, Ma ZH, Liu YE, Cao XY, et al. Current status and prospect of treatments for recurrent hepatocellular carcinoma. World J Hepatol. 2023;15:129–50. 10.4254/wjh.v15.i2.129 - DOI - PMC - PubMed
    1. Llovet JM, Castet F, Heikenwalder M, Maini MK, Mazzaferro V, Pinato DJ, et al. Immunotherapies for hepatocellular carcinoma. Nat Rev Clin Oncol. 2022;19:151–72. 10.1038/s41571-021-00573-2 - DOI - PubMed
    1. Kulik L, El-Serag HB. Epidemiology and management of hepatocellular carcinoma. Gastroenterology. 2019;156:477–91.e1. 10.1053/j.gastro.2018.08.065 - DOI - PMC - PubMed