. 2024 Aug 29;16(1):105.
doi: 10.1186/s13321-024-00899-w.

Evaluating the generalizability of graph neural networks for predicting collision cross section

Affiliations

Evaluating the generalizability of graph neural networks for predicting collision cross section

Chloe Engler Hart et al. J Cheminform. .

Abstract

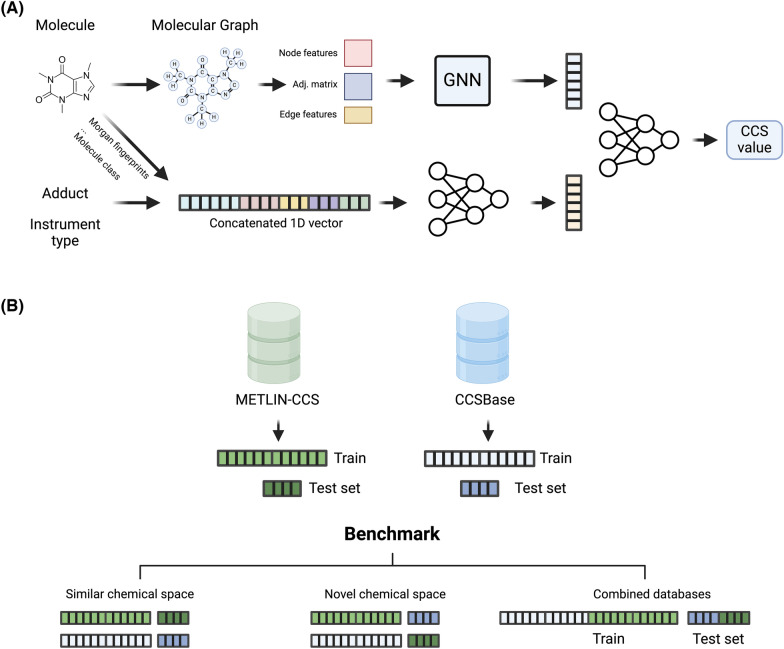
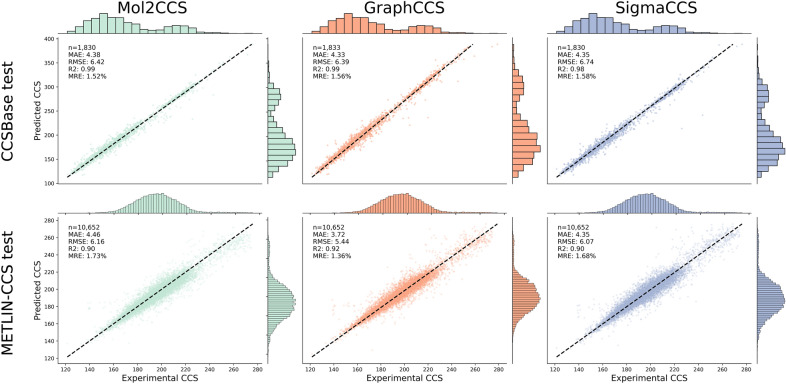
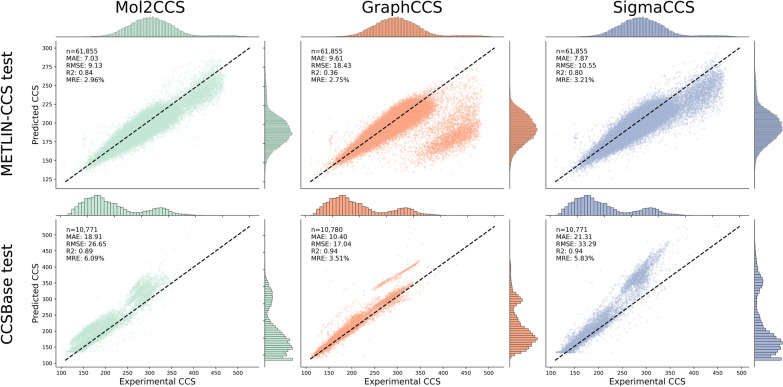
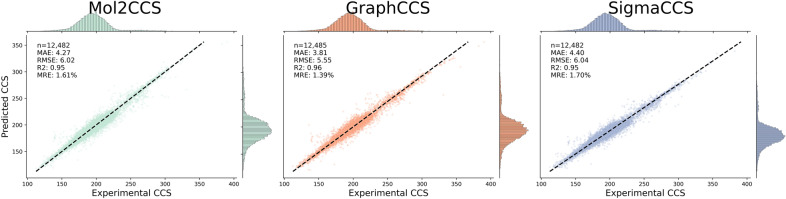
Ion Mobility coupled with Mass Spectrometry (IM-MS) is a promising analytical technique that enhances molecular characterization by measuring collision cross-section (CCS) values, which are indicative of the molecular size and shape. However, the effective application of CCS values in structural analysis is still constrained by the limited availability of experimental data, necessitating the development of accurate machine learning (ML) models for in silico predictions. In this study, we evaluated state-of-the-art Graph Neural Networks (GNNs), trained to predict CCS values using the largest publicly available dataset to date. Although our results confirm the high accuracy of these models within chemical spaces similar to their training environments, their performance significantly declines when applied to structurally novel regions. This discrepancy raises concerns about the reliability of in silico CCS predictions and underscores the need for releasing further publicly available CCS datasets. To mitigate this, we introduce Mol2CCS which demonstrates how generalization can be partially improved by extending models to account for additional features such as molecular fingerprints, descriptors, and the molecule types. Lastly, we also show how confidence models can support by enhancing the reliability of the CCS estimates.Scientific contributionWe have benchmarked state-of-the-art graph neural networks for predicting collision cross section. Our work highlights the accuracy of these models when trained and predicted in similar chemical spaces, but also how their accuracy drops when evaluated in structurally novel regions. Lastly, we conclude by presenting potential approaches to mitigate this issue.


Conflict of interest statement

All authors were employees of Enveda Biosciences Inc. during the course of this work and have real or potential ownership interest in the company.

Figures

Fig. 1
Fig. 1
A Model architecture. The upper section of this figure illustrates the conversion of the SMILES representation of the molecule into a molecular graph, which is then represented as three matrices (an adjacency matrix, an edge attributes matrix, and a node attributes matrix). These matrices are fed into a GNN. The GNN’s output is concatenated with the output from a linear model which accepts additional features (such as adduct, instrument type, etc.) as input. This concatenated vector is then fed into another set of fully connected layers which outputs a CCS value. B Evaluation schema. Each database is split in train (80%) and test (20%) based on molecule type (e.g., lipid, small molecule, etc.) and Murcko scaffolds. Next, each model is trained on the training set of each database (either CCSBase train or METLIN-CCS train) and evaluated on the two test sets of both databases (CCSBase test and METLIN-CCS test). When the model is evaluated on the same database that has been trained on, the model has already seen similar molecules, and thus, the evaluation is on similar chemical space (left). When the model is evaluated on a test set containing dissimilar molecules, the evaluation is a novel chemical space (middle). Lastly, both databases are also combined for training and testing (right)
Fig. 2
Fig. 2
Scatterplots of the predictions for each model when training and evaluating on the same database. On the CCSBase dataset (upper row) all models perform equally with a very high correlation coefficient and RMSE of approximately 6 square angstrom [Å2]. On the METLIN-CCS, R2 drops from 0.99 in CCSBase to 0.9. However, the other metrics are comparable for all three models
Fig. 3
Fig. 3
Scatterplots of the predictions for each model when training on one database and evaluating on another one. The bottom plots show the evaluation on CCSBase when training on METLIN-CCS. When training on CCSBase and evaluating on METLIN-CCS (upper row) the performance of all models significantly drops. For instance, the R2 goes down to 0.36, 0.8, and 0.84 for GraphCCS, SigmaCCS, and Mol2CCS, respectively. However, performance drops less dramatically when training on METLIN-CCS and evaluating on CCSBase, since the models have been trained on several times more data points. Despite the larger training data, the differences in their chemical space can explain why all models exhibit RMSEs three times larger than when they are trained and evaluated on the same database
Fig. 4
Fig. 4
Scatterplots of the predictions for each model when training and evaluating on the combined dataset
Fig. 5
Fig. 5
Confidence model for CCS prediction model trained on METLIN-CCS and tested on CCSBase. A-B Predicted confidences by the confidence model in the test set vs. absolute error of the Mol2CCS prediction. C-D Predictions on the high confidence subset generated from the two experiments where the model is trained on one database and evaluated on the other. A and C are for the confidence model trained only on data from METLIN-CCS. B and D show results for the confidence model trained on METLIN-CCS data with an additional 1,000 data points from METLIN-CCS (that are structure disjoint from the METLIN-CCS test dataset). C displays the metrics of the data after confidence thresholding compared to the metrics without filtering. Comparing A and B as well as C and D demonstrates that the confidence model improves when it is trained with some in domain data. However, as shown in C, even without in domain data, the MAE and MRE improve slightly when confidence thresholding is used

References

    1. Baker ES, Hoang C, Uritboonthai W, Heyman HM, Pratt B, MacCoss M et al (2023) METLIN-CCS: an ion mobility spectrometry collision cross section database. Nat Methods 20(12):1836–1837. 10.1038/s41592-023-02078-5 10.1038/s41592-023-02078-5 - DOI - PMC - PubMed
    1. Baker ES, Uritboonthai W, Aisporna A, Hoang C, Heyman HM, Connell L et al (2024) METLIN-CCS lipid database: an authentic standards resource for lipid classification and identification. Nat Metab. 10.1038/s42255-024-01058-z 10.1038/s42255-024-01058-z - DOI - PMC - PubMed
    1. Bemis GW, Murcko MA (1996) The properties of known drugs. 1. molecular frameworks. J Med Chem 39(15):2887–2893 10.1021/jm9602928 - DOI - PubMed
    1. Das S, Tanemura KA, Dinpazhoh L, Keng M, Schumm C, Leahy L et al (2022) In silico collision cross section calculations to aid metabolite annotation. J Am Soc Mass Spectrom 33(5):750–759. 10.1021/jasms.1c00315 10.1021/jasms.1c00315 - DOI - PMC - PubMed
    1. Dragos H, Gilles M, Alexandre V (2009) Predicting the predictability: a unified approach to the applicability domain problem of QSAR models. J Chem Inf Model 49(7):1762–1776. 10.1021/ci9000579 10.1021/ci9000579 - DOI - PubMed

LinkOut - more resources