Case Reports
. 2024 Oct 10;5(4):100349.
doi: 10.1016/j.xhgg.2024.100349. Epub 2024 Aug 29.

Dominantly acting variants in ATP6V1C1 and ATP6V1B2 cause a multisystem phenotypic spectrum by altering lysosomal and/or autophagosome function

Affiliations
Case Reports

Dominantly acting variants in ATP6V1C1 and ATP6V1B2 cause a multisystem phenotypic spectrum by altering lysosomal and/or autophagosome function

Giovanna Carpentieri et al. HGG Adv. .

Abstract

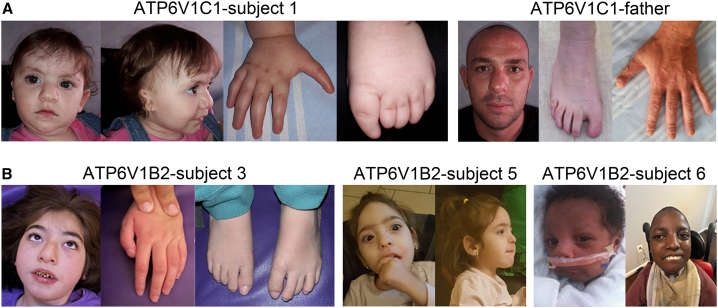
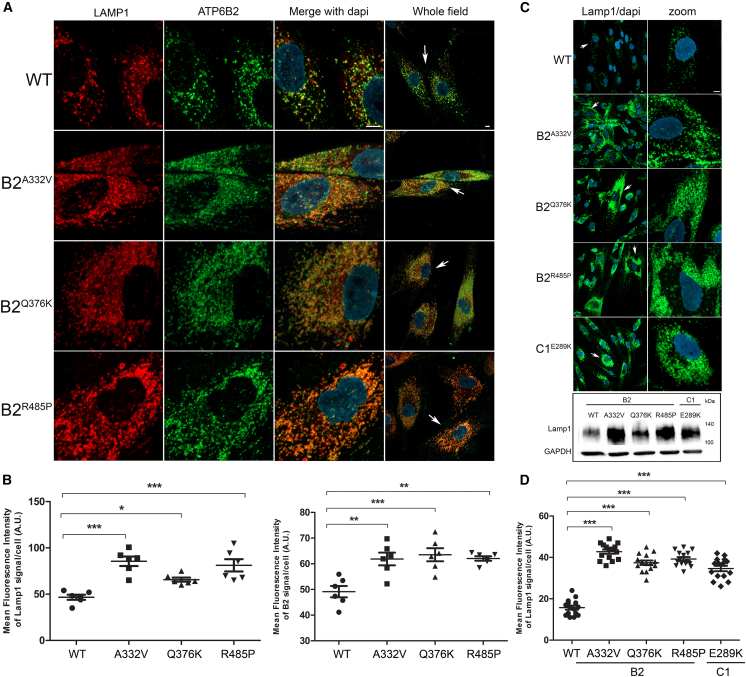
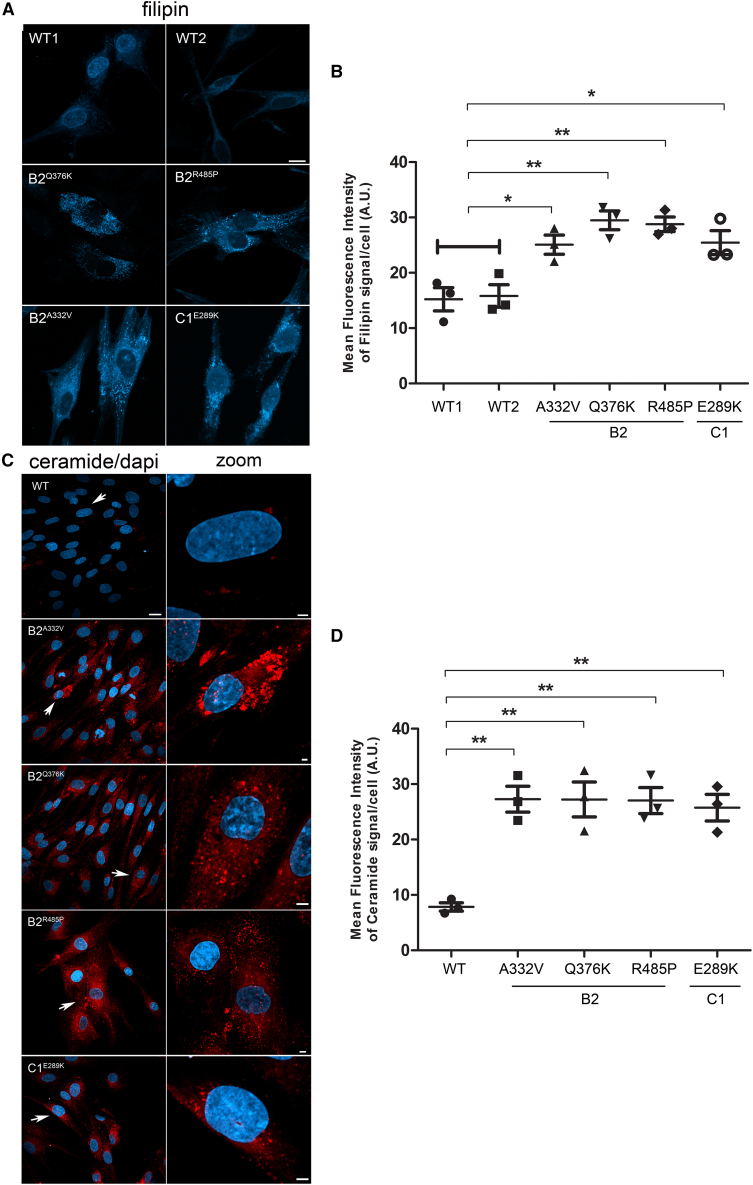
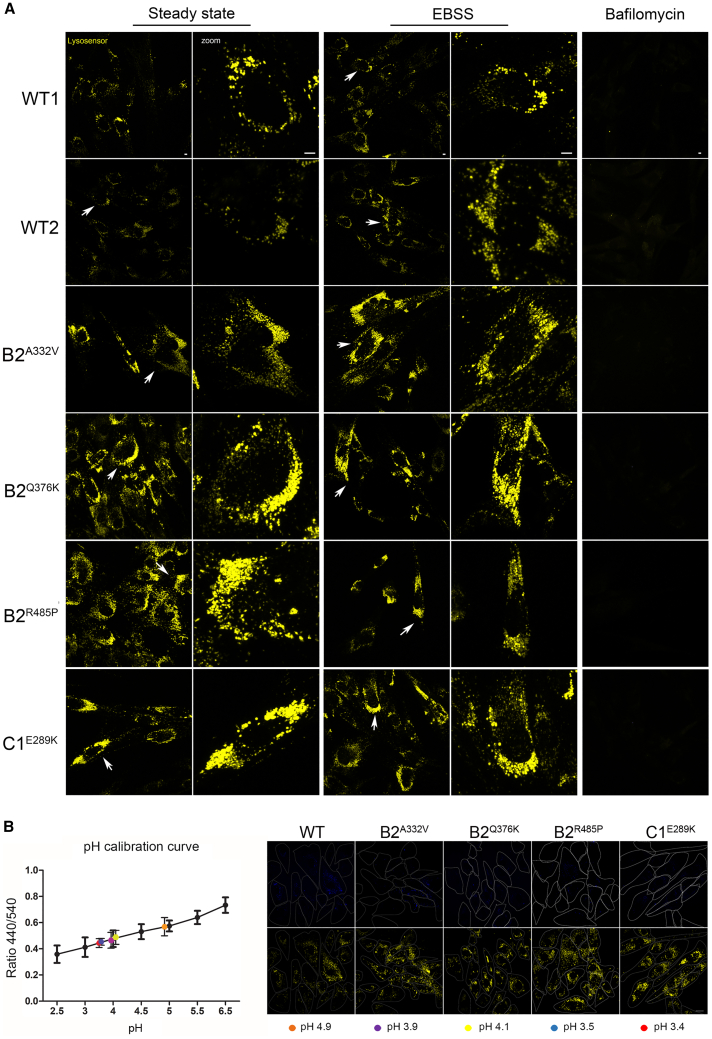
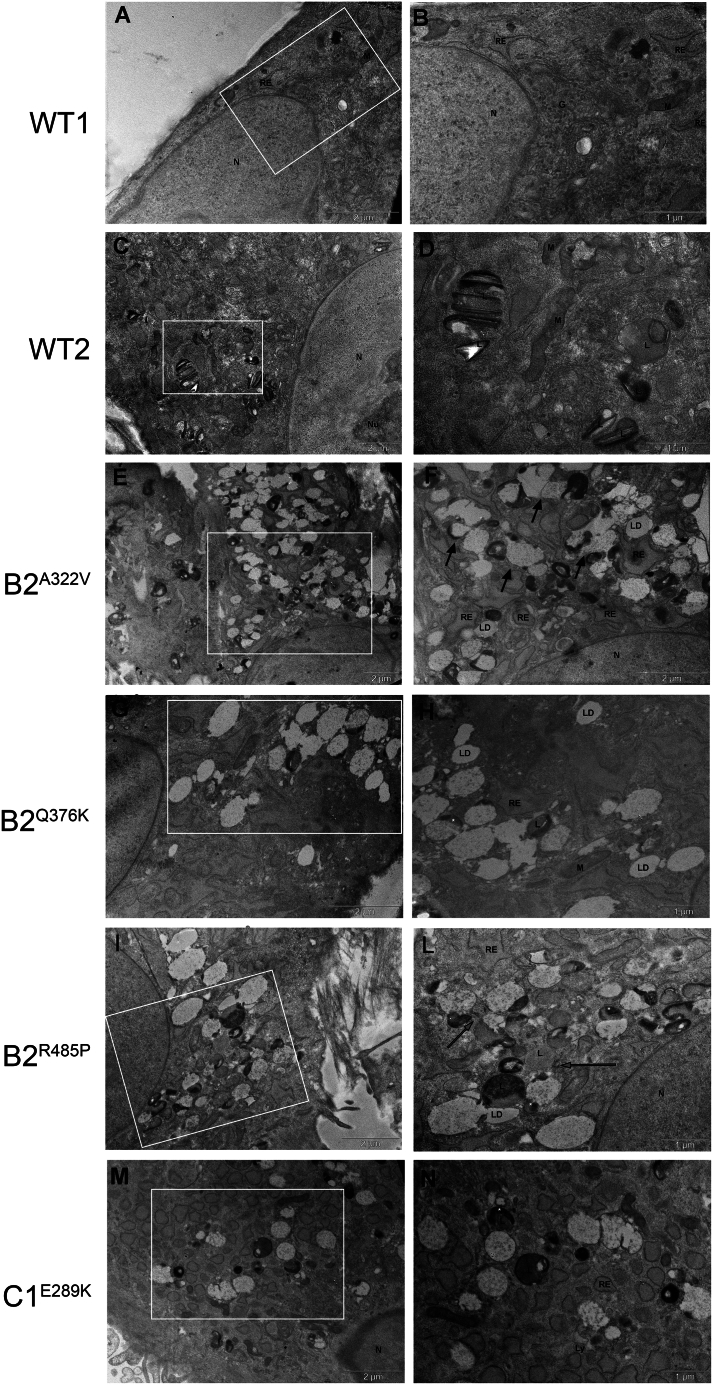
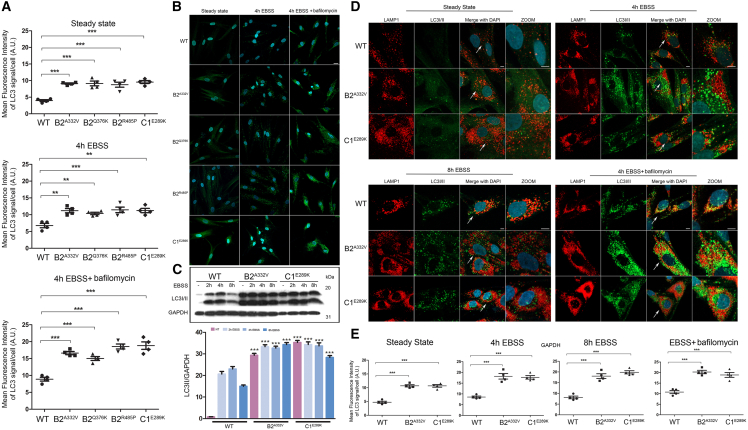
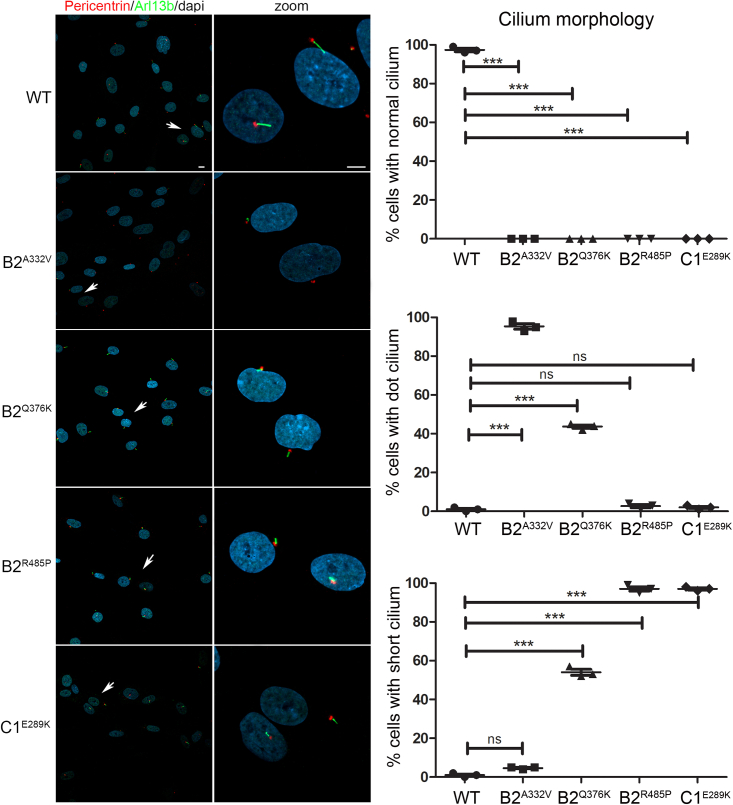
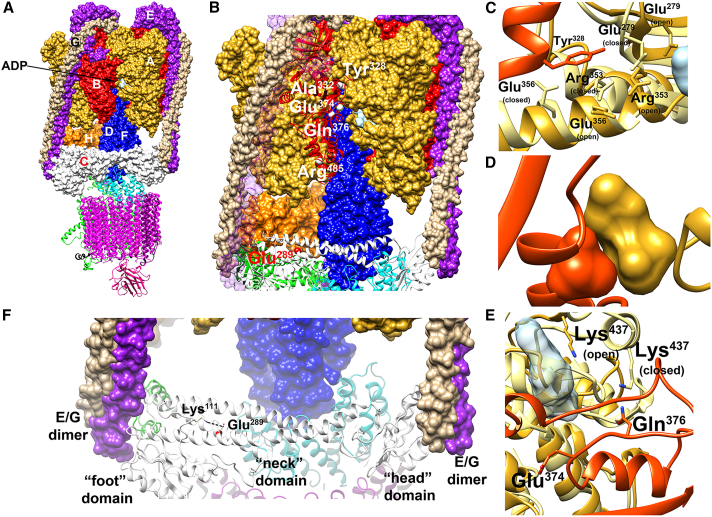
The vacuolar H+-ATPase (V-ATPase) is a functionally conserved multimeric complex localized at the membranes of many organelles where its proton-pumping action is required for proper lumen acidification. The V-ATPase complex is composed of several subunits, some of which have been linked to human disease. We and others previously reported pathogenic dominantly acting variants in ATP6V1B2, the gene encoding the V1B2 subunit, as underlying a clinically variable phenotypic spectrum including dominant deafness-onychodystrophy (DDOD) syndrome, Zimmermann-Laband syndrome (ZLS), and deafness, onychodystrophy, osteodystrophy, intellectual disability, and seizures (DOORS) syndrome. Here, we report on an individual with features fitting DOORS syndrome caused by dysregulated ATP6V1C1 function, expand the clinical features associated with ATP6V1B2 pathogenic variants, and provide evidence that these ATP6V1C1/ATP6V1B2 amino acid substitutions result in a gain-of-function mechanism upregulating V-ATPase function that drives increased lysosomal acidification. We demonstrate a disruptive effect of these ATP6V1B2/ATP6V1C1 variants on lysosomal morphology, localization, and function, resulting in a defective autophagic flux and accumulation of lysosomal substrates. We also show that the upregulated V-ATPase function affects cilium biogenesis, further documenting pleiotropy. This work identifies ATP6V1C1 as a new gene associated with a neurodevelopmental phenotype resembling DOORS syndrome, documents the occurrence of a phenotypic continuum between ZLS, and DDOD and DOORS syndromes, and classify these conditions as lysosomal disorders.

Keywords: ATP6V1B2; ATP6V1C1; DDOD syndrome; DOORS syndrome; Zimmermann-Laband syndrome; autophagy; lysosome; neurodevelopmental disorder; pleiotropy; vacuolar ATPase.


Conflict of interest statement

Declaration of interests The authors declare no competing interests.

Figures

Figure 1
Figure 1
Craniofacial features of the individuals carrying dominant acting ATP6V1C1/ATP6V1B2 variants (A) Subject 1 at 2 years (left). Note the occurrence of bushy eyebrow, up-slanted palpebral fissures, epicanthal folds, microtia, broad nasal bridge, bifid nasal tip, deep philtrum, thin upper lip, prominent lower vermillion, nail aplasia of hands and feet, hypoplastic terminal phalanges and triphalangeal thumbs/big toes. Subject 1’s father (right). Note nail aplasia of feet and hypoplastic terminal phalanges of hands and feet. Minor dysmorphism includes broad nasal bridge, bulbus nose, deep philtrum, and prominent upper and lower vermillion. (B) Subject 3 at 8 years (left). Note facial hypotonia, straight eyebrow, hypertelorism, ptosis, long eyelashes, tubular nose with broad nasal base, short and deep philtrum and everted thin upper lip with prominent upper vermilion. Subject 5 at 4 years 7 months (middle panels). Note the high forehead, bitemporal narrowing, coarse face, brushy and straight eyebrows, long eyelashes, prominent upper and lower vermilion and large mouth. Subject 6 at 13 years (right). Note the bitemporal narrowing, coarse face with full-cheeks, thin upper lip, micrognathia/retrognathia, and short neck. A detailed clinical characterization of affected subjects is reported in Tables 1 and S3 and Supplemental Material (Clinical Reports).
Figure 2
Figure 2
Disease-causing ATP6V1B2 and ATP6V1C1 variants affect lysosome morphology but maintain a proper lysosomal localization (A and B) Confocal laser scanning microscopy analysis shows a proper ATP6V1B2 subcellular localization with lysosomes. Cells were stained with Lamp1 (lysosome marker, red) and ATP6V1B2 (B2 subunit marker, green) antibodies, and DAPI (DNA marker, blue). Representative images are shown (A) together with the quantitative data and statistical analysis (B). Arrows indicate the selected cells reported in the enlarged images. Scale bar, 5 μm. MFI ± SEM of B2 and Lamp1 signal per cell was quantified (≥20 cells per experimental condition, in six independent experiments per marker), and plotted in the corresponding graphs, defining final MFI as MFI (region of interest [ROI]) − MFI (background). Bars indicate mean ± SEM, p values were calculated by one-way ANOVA with Tukey’s correction for multiple testing. (C and D) Representative images reporting the altered morphology, distribution, and number of lysosomes in cells from individuals carrying heterozygous ATP6V1B2 missense variants (p.Ala332Val [A332V], p.Gln376Lys [Q376K], and p.Arg485Pro [R485P]) compared with control cells are shown (C). Arrows indicate the selected cells reported in the enlarged images. Scale bar is 5 μm. In the same panel, western blot analysis shows the higher expression level of lysosomes marker in patients’ fibroblasts than control cells. GAPDH was used to normalize the experiments. Quantitative data and statistical analysis are also shown (D). MFI and SEM were calculated as above.
Figure 3
Figure 3
Effects of autophagic flux dysregulation promoted by ATP6V1B2 and ATP6V1C1 mutants Confocal laser scanning microscopy analyses show a significant storage of cholesterol (A and B) and ceramide (C and D) on patients’ fibroblasts compared with control cells. Cells were stained with filipin (cholesterol) (A) and BTR-ceramide (C) probes, respectively. Scale bars are 10 μm (A), 20 μm (C, left), and 2 μm (C, right). Arrows indicate the selected cells reported in the enlarged images. MFI ± SEM of filipin (B) and ceramide (D) signal per cell, was quantified (3 independent experiments, ≥20 cells per condition, in each repeat), and plotted in the corresponding graphs, defining Final MFI as MFI (region of interest) – MFI (background). WT1 and WT2 were pooled together vs. patient’s samples. Bars indicate mean ± SEM, p values were calculated by One way ANOVA with Tukey’s correction for multiple testing.
Figure 4
Figure 4
Expression of ATP6V1B2 and ATP6V1C1 mutants is associated with increased acidification of lysosomes (A) Patients’ and control cells were incubated with 2 μM LysoSensor Yellow/Blue DND-160 (Thermo Fisher Scientific) and observed on a Zeiss LSM 980 confocal microscope. Images were acquired using a 63× oil objective, laser and filter settings were adjusted according to the fluorescence excitation and emission requirements of the reagent. Scale bar, 5 μm. (B) Evaluation of lysosomal pH values in patient-derived fibroblasts. The pH calibration curve performed using WT1 cells, and obtained by plotting the fluorescence intensity 450/540 ratios as a function of pH, was fitted with linear regression using GraphPad Prism5 software (left). Data are means ± SEM from >50 cells analyzed for each pH value. Colored filled circled represent the experimentally measured ratios converted into absolute pH values by interpolation in the pH calibration curve. Representative images of fibroblasts incubated with LysoSensor Yellow/Blue dextran and visualized in live at 450 nm (top) and 540 nm (bottom) emission wavelengths (right). The cell contours recognition was performed in bright field images and used to effectively quantify fluorescence intensity. Scale bar, 20 μm. All panels are identical in scale.
Figure 5
Figure 5
Electron microscopy analysis Electron micrographs showing the ultrastructure of control (A–D) and patient-derived fibroblasts (E–N). (E and F) Fibroblasts from subjects B2A322V and (I–L) B2R485P showed vesicles partially fused to each other (black arrows) and in close proximity (gray arrows). (G–H) B2Q376K patients’ cells showed accumulation of large heterogeneous vacuoles whereas the cells carrying the C1E289K mutant presented vesicles uniform in size. (M and N) (white asterisks) Heterogeneous substances and osmiophilic material. G, Golgi apparatus; N, nucleus; n, nucleolus; L, lysosome; LD, lipid droplets; M, mitochondria; RE, rough endoplasmic reticulum.
Figure 6
Figure 6
An impaired autophagic flux in patients’ fibroblasts promotes LC3I/II proteins accumulation and affects autophagosomes number and subcellular localization (A–C) Confocal laser scanning microscopy (CSLM) analysis performed on patients’ fibroblasts show a significant high level of LC3I/II proteins already in the steady state condition, which remains constant after treatment with EBSS for 4 h without bafylomicin, to indicate an autophagic flux impairment. Graphs reporting MFI ± SEM of LC3I/II (A) and representative images (B) are shown. Fixed cells were stained with rabbit monoclonal anti-LC3I/II antibody followed by rabbit anti-goat Alexa Fluor 488 (green). Nuclei are visualized by DAPI staining (blue). Scale bar, 20 μm. Western blot analyses performed on patients’ fibroblasts (C) confirm the data obtained by immunofluorescence, showing an anomalous accumulation of LC3I/II in the steady state condition and after autophagic flux induction with EBSS for 2, 4, and 8 h. Equal amounts of cell lysates were resolved by 15% polyacrylamide gel electrophoresis. Membranes were probed with an anti-LC3I/II antibody and then re-probed with an anti-GAPDH antibody for data normalization. Non-treated cells (i.e., cells cultured in steady state conditions) were reported as internal controls (−). Bars indicate mean ± SEM, p values were calculated by one-way ANOVA with Tukey’s correction for multiple testing. MFI ± SEM signals per cell were quantified (4 independent experiments per marker, ≥20 cells per experimental condition, in each repeat), and plotted in the corresponding graphs, defining Final MFI as MFI (region of interest [ROI]) − MFI (background). Bars indicate mean ± SEM, p values were calculated by one-way ANOVA with Tukey’s correction for multiple testing. (D and E) CSLM analysis shows an unusual subcellular localization of autophagosomes in patients’ cells compared with control cells (D). In particular, these organelles localized near the nucleus and a few number colocalized with lysosomes residing in the peripheral region of the cell in the steady state condition as well as after treatment with EBSS without bafilomycin. Fixed cells were stained with rabbit monoclonal anti-LC3I/II antibody followed by anti-rabbit Alexa Fluor 488 (green). The lysosomes were stained with an anti-mouse Lamp1 followed by anti-mouse Alexa Fluyor-546 (red). Nuclei are visualized by DAPI staining (blue). Scale bar, 5 μm. Quantitative data assessing the LC3I/II levels and statistical analysis are also shown (D). MFI and SEM were calculated as above.
Figure 7
Figure 7
ATP6V1B2 and ATP6V1C1 variants are associated with an aberrant primary cilium morphology Representative confocal images showing altered primary cilium morphology in patients’ fibroblasts compared with control cells. Specifically, cilia with altered morphology (either short or characterized by a basal body in absence of any visible cilium [dot cilium], zoomed images) were invariably observed in fibroblasts heterozygous for the all variants studied. Primary cilia are labeled with ARL13B (green), basal bodies and nuclei are labeled with pericentrin (red) and DAPI (blue), respectively. Scale bars, 10 μm (left) and 2 μm (right). Cells were analyzed for each line over three independent experiments (50 cells/line each) for a total of 150 cells/line scored. p values were calculated by one-way ANOVA with Tukey’s correction for multiple testing. Graph bars show mean ± SEM.
Figure 8
Figure 8
Location of the mutated residues of the B2 and C1 subunits in the cryo-EM structures of human V-ATPase (A) Side view of the of human V-ATPase complex (PDB: 6wm2). The subunits belonging to the V1 and VO regions are reported as surface and ribbon, respectively. The B and C subunits in the V1 region are colored red and white, respectively. ADP is reported as a light blue surface in the V1 region at the interface between the A and B subunits. (B) The V-ATPase complex in the region containing the residues discussed in the present study. The C subunit and one of the three B subunits are reported as ribbons. The Cα atoms of the muted residues are reported as white and red spheres for the B and C subunits, respectively. For the sake of clarity, one of the E subunits is not reported. (C) p.Tyr328Cys and p.Tyr328His substitutions (B2 subunit). The helix tract in the B subunit comprising Tyr328 is reported as a red ribbon (chain ζ), Tyr328 is represented as red sticks. Two different conformations of the A subunit are reported as ribbons, corresponding to the closed (chain β, light yellow) and open (chain γ, gold) states, respectively. The residues in the A subunit in contact with Tyr328 (minimum distance less than 0.5 nm) and populating different conformations in the two states are indicated and reported as sticks. (D) p.Ala332Val substitution (B2 subunit). Sketch of the interface comprising Ala332 in one of the three interfaces (chains γ/ζ in the PDB file); in the sketch, Ala332 (in the B subunit) and Ser316 and Asn317 (in the A subunit) are reported as red and gold surfaces, respectively. (E) p.Glu374Gln, p.Gln376Arg and p.Gln376Lys substitutions (B2 subunit). Interfaces between the A and B subunits in the region surrounding Gln376 and Glu374 in the B subunits from the 6wm2 structure. The backbone of the strand comprising Glu374 and Gln376 is reported as red ribbon; Glu374 and Gln376 are represented as sticks. Two different conformations of the A subunit are reported as ribbons, corresponding to the closed (chain β, light yellow) and open (chain γ, gold) states, respectively. Lys437 in chain A is reported as sticks and colored by atoms, with the carbons colored as the corresponding ribbon. The ADP molecule in the γ chain is reported as a semi-transparent light blue surface. (F) p.Glu289Lys substitution (C1 subunit). The C subunit is reported as a white ribbon. Glu289 is reported as sticks, and the backbone is colored red. Lys111 is also reported as white sticks.

References

    1. Sun-Wada G.H., Wada Y. Role of vacuolar-type proton ATPase in signal transduction. Biochim. Biophys. Acta. 2015;1847:1166–1172. doi: 10.1016/j.bbabio.2015.06.010. - DOI - PubMed
    1. Cotter K., Capecci J., Sennoune S., Huss M., Maier M., Martinez-Zaguilan R., Forgac M. Activity of plasma membrane V-ATPases is critical for the invasion of MDA-MB231 breast cancer cells. J. Biol. Chem. 2015;290:3680–3692. doi: 10.1074/jbc.M114.611210. - DOI - PMC - PubMed
    1. Van Damme T., Gardeitchik T., Mohamed M., Guerrero-Castillo S., Freisinger P., Guillemyn B., Kariminejad A., Dalloyaux D., van Kraaij S., Lefeber D.J., et al. Mutations in ATP6V1E1 or ATP6V1A Cause Autosomal-Recessive Cutis Laxa. Am. J. Hum. Genet. 2020;107:374. doi: 10.1016/j.ajhg.2020.07.013. - DOI - PMC - PubMed
    1. Forgac M. Vacuolar ATPases: rotary proton pumps in physiology and pathophysiology. Nat. Rev. Mol. Cell Biol. 2007;8:917–929. doi: 10.1038/nrm2272. - DOI - PubMed
    1. Bruce L.J., Cope D.L., Jones G.K., Schofield A.E., Burley M., Povey S., Unwin R.J., Wrong O., Tanner M.J. Familial distal renal tubular acidosis is associated with mutations in the red cell anion exchanger (band 3, AE1) gene. J. Clin. Invest. 1997;100:1693–1707. doi: 10.1172/JCI119694. - DOI - PMC - PubMed

Publication types

Substances

LinkOut - more resources