Accurate and Ultra-Efficient p-Value Calculation for Higher Criticism Tests
- PMID: 39211031
- PMCID: PMC11350355
- DOI: 10.1080/10618600.2023.2270720
Accurate and Ultra-Efficient p-Value Calculation for Higher Criticism Tests
Abstract
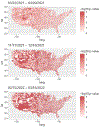
In modern data science, higher criticism (HC) method is effective for detecting rare and weak signals. The computation, however, has long been an issue when the number of p-values combined ( ) and/or the number of repeated HC tests ( ) are large. Some computing methods have been developed, but they all have significant shortcomings, especially when a stringent significance level is required. In this paper, we propose an accurate and highly efficient computing strategy for four variations of HC. Specifically, we propose an unbiased cross-entropy-based importance sampling method ( ) to benchmark all existing computing methods, and develop a modified SetTest method (MST) that resolves numerical issues of the existing SetTest approach. We further develop an ultra-fast approach (UFI) combining pre-calculated statistical tables and cubic spline interpolation. Finally, following extensive simulations, we provide a computing strategy integrating MST, UFI and other existing methods with R package "HCp" for virtually any and small p-values ( ). The method is applied to a COVID-19 disease surveillance example for spatio-temporal outbreak detection from case numbers of 804 days in 3,342 counties in the United States. Results confirm viability of the computing strategy for large-scale inferences. Supplementary materials for this article are available online.
Keywords: analytical approximation; asymptotic rare and weak model; higher criticism; importance sampling; p-value computation.
Figures


Similar articles
-
Accurate and Efficient P-value Calculation via Gaussian Approximation: a Novel Monte-Carlo Method.J Am Stat Assoc. 2019;114(525):384-392. doi: 10.1080/01621459.2017.1407776. Epub 2018 Jun 28. J Am Stat Assoc. 2019. PMID: 31130762 Free PMC article.
-
The intermediates take it all: asymptotics of higher criticism statistics and a powerful alternative based on equal local levels.Biom J. 2015 Jan;57(1):159-80. doi: 10.1002/bimj.201300255. Epub 2014 Jun 10. Biom J. 2015. PMID: 24914007
-
P-value evaluation, variability index and biomarker categorization for adaptively weighted Fisher's meta-analysis method in omics applications.Bioinformatics. 2020 Jan 15;36(2):524-532. doi: 10.1093/bioinformatics/btz589. Bioinformatics. 2020. PMID: 31359040 Free PMC article.
-
Public sector reforms and their impact on the level of corruption: A systematic review.Campbell Syst Rev. 2021 May 24;17(2):e1173. doi: 10.1002/cl2.1173. eCollection 2021 Jun. Campbell Syst Rev. 2021. PMID: 37131927 Free PMC article. Review.
-
Spline-in-compression approximation of order of accuracy three (four) for second order non-linear IVPs on a graded mesh.MethodsX. 2023 Jul 31;11:102308. doi: 10.1016/j.mex.2023.102308. eCollection 2023 Dec. MethodsX. 2023. PMID: 37601291 Free PMC article. Review.
References
-
- Berk R and Jones D. Goodness-of-fit test statistics that dominate the Kolmogorov statistics. Probability Theory and Related Fields, 47(1):47–59, Jan. 1979. ISSN 0178-8051. doi: 10.1007/BF00533250. - DOI
-
- Cai TT and Wu Y. Optimal detection of sparse mixtures against a given null distribution. IEEE Transactions on Information Theory, 60(4):2217–2232, 2014. doi: 10.1109/TIT.2014.2304295. - DOI
-
- Cayón L, Jin J, and Treaster A. Higher Criticism statistic: detecting and identifying non-Gaussianity in the WMAP first-year data. Monthly Notices of the Royal Astronomical Society, 362(3):826–832, 09 2005. ISSN 0035-8711. doi: 10.1111/j.1365-2966.2005.09277.x. URL 10.1111/j.1365-2966.2005.09277.x. - DOI - DOI
Grants and funding
LinkOut - more resources
Full Text Sources
Miscellaneous
