

High expression of SIGLEC7 may promote M2-type macrophage polarization leading to adverse prognosis in glioma patients
- PMID: 39211050
- PMCID: PMC11357930
- DOI: 10.3389/fimmu.2024.1411072
High expression of SIGLEC7 may promote M2-type macrophage polarization leading to adverse prognosis in glioma patients
Abstract
Introduction: Gliomas are the most common primary intracranial tumors, known for their high invasiveness and destructiveness. Sialic acid-binding immunoglobulin-like lectin 7 (SIGLEC7) is present in various immune cells, especially macrophages, and significantly affects immune homeostasis and cancer cell response. However, research on the role and prognostic impact of SIGLEC7 in glioma patients is currently limited.
Methods: We utilized transcriptomic data from 702 glioma patients in The Cancer Genome Atlas (TCGA) and 693 glioma patients in the Chinese Glioma Genome Atlas (CGGA), along with clinical samples we collected, to comprehensively investigate the impact of SIGLEC7 on glioma expression patterns, biological functions, and prognostic value. We focused on its role in glioma-related immune responses and immune cell infiltration and analyzed its expression at the single-cell level. Finally, we validated the role of SIGLEC7 in gliomas through tissue and cell experiments.
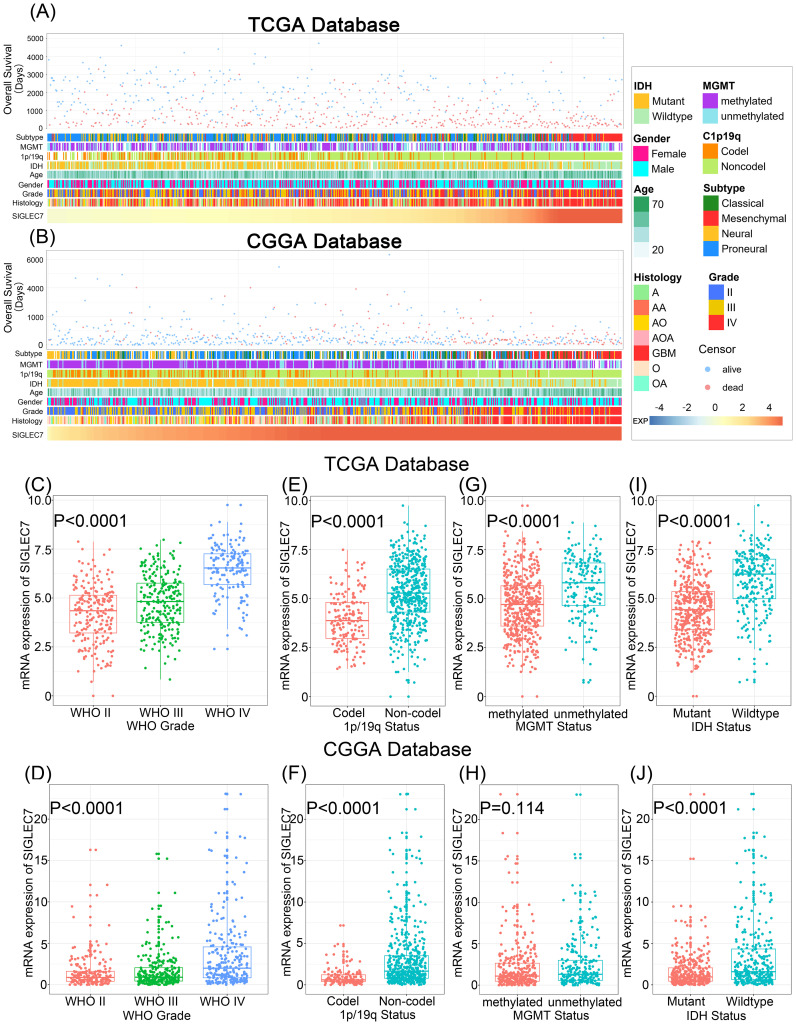
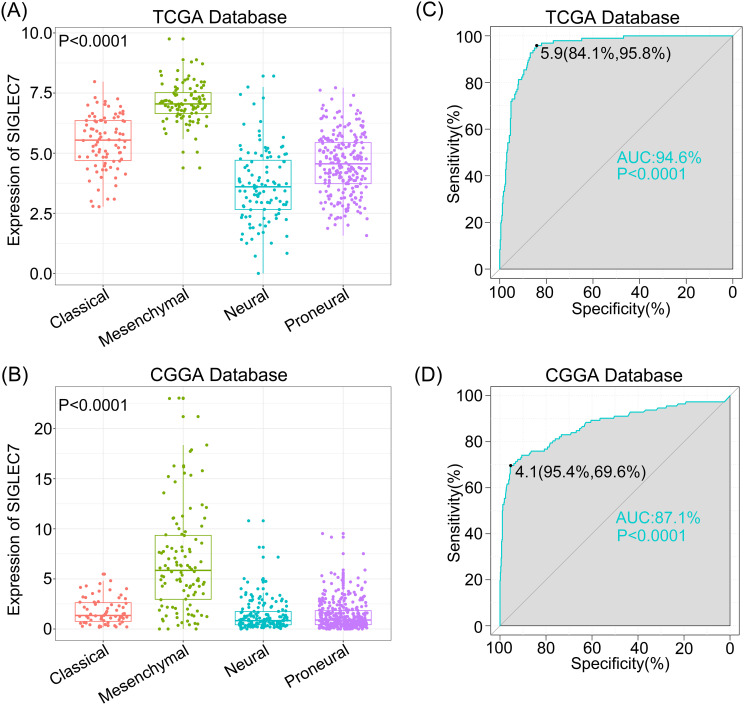
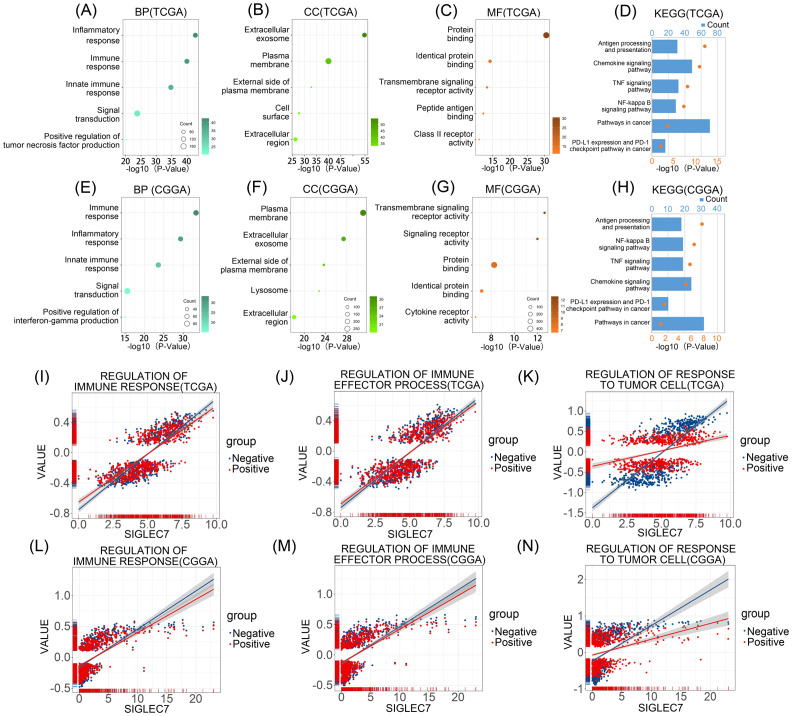
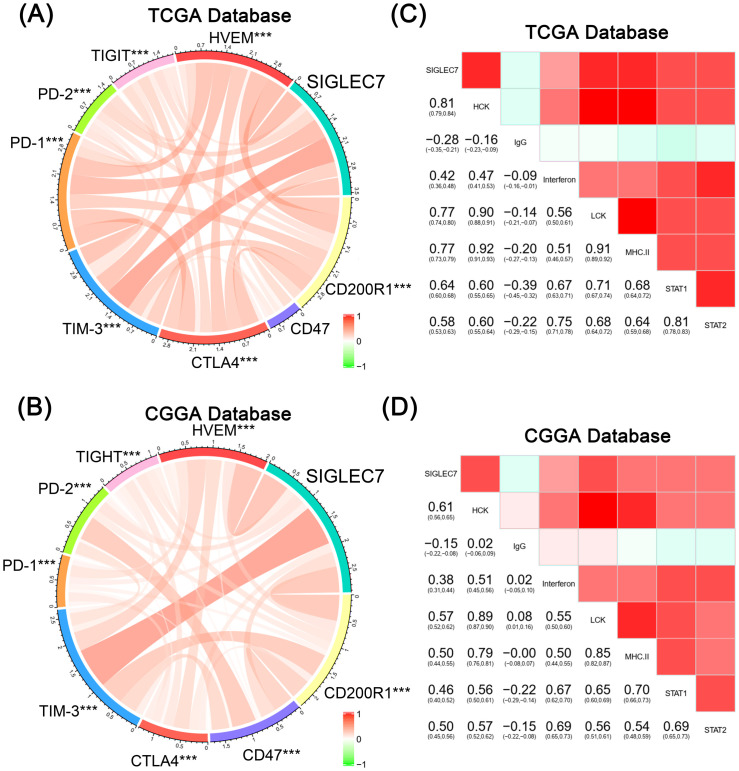
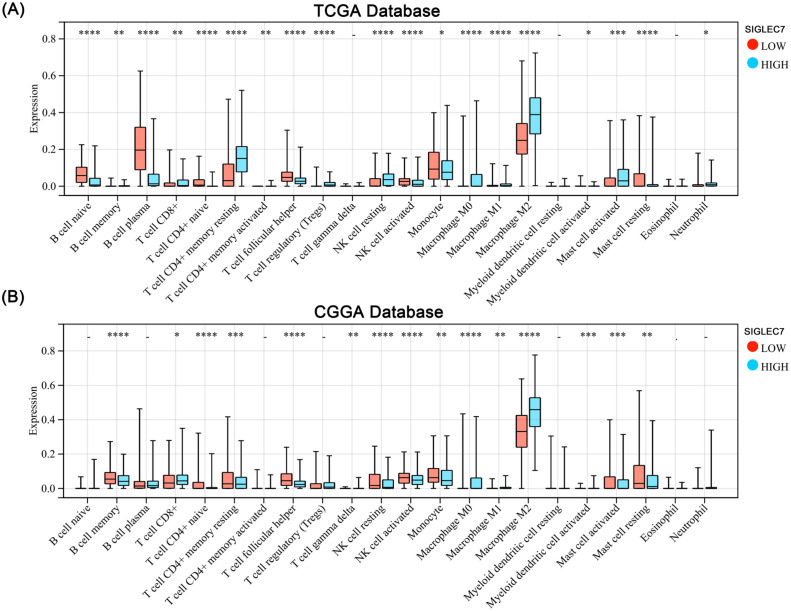
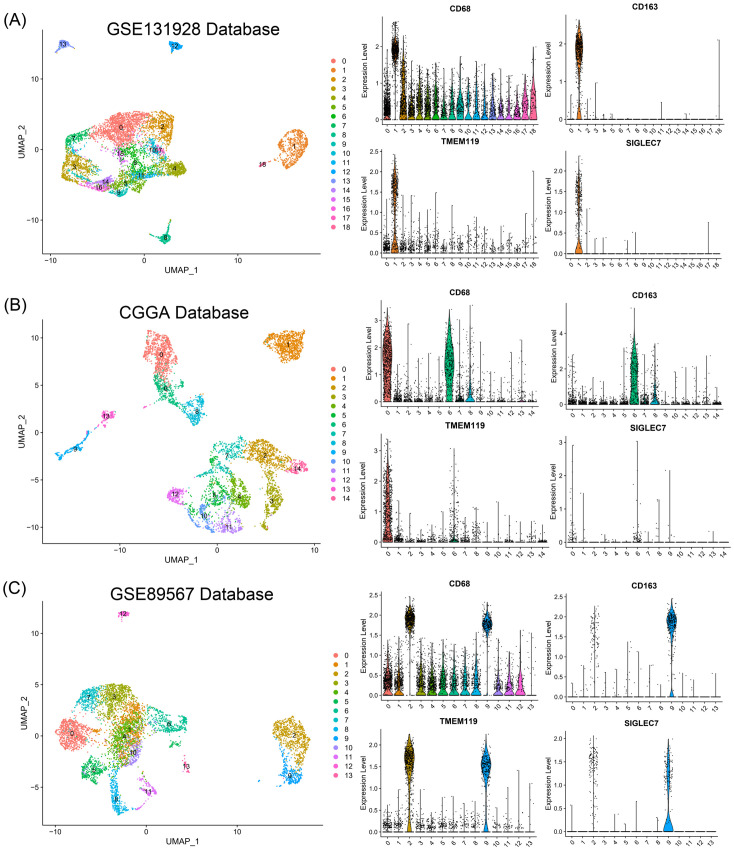
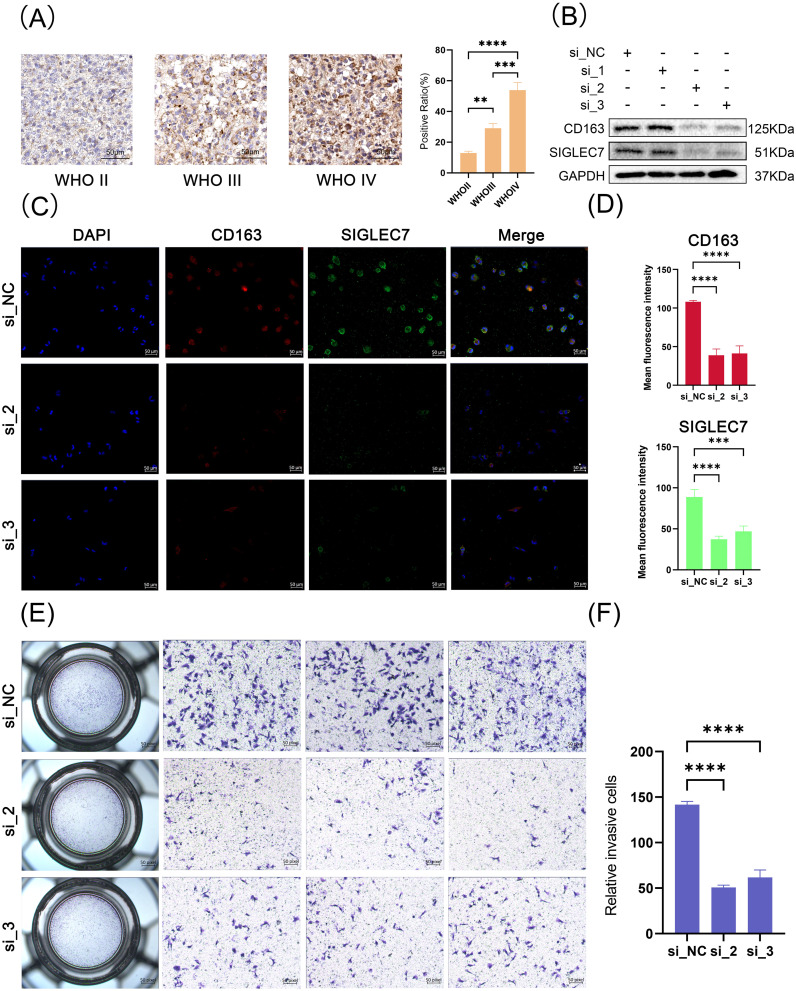
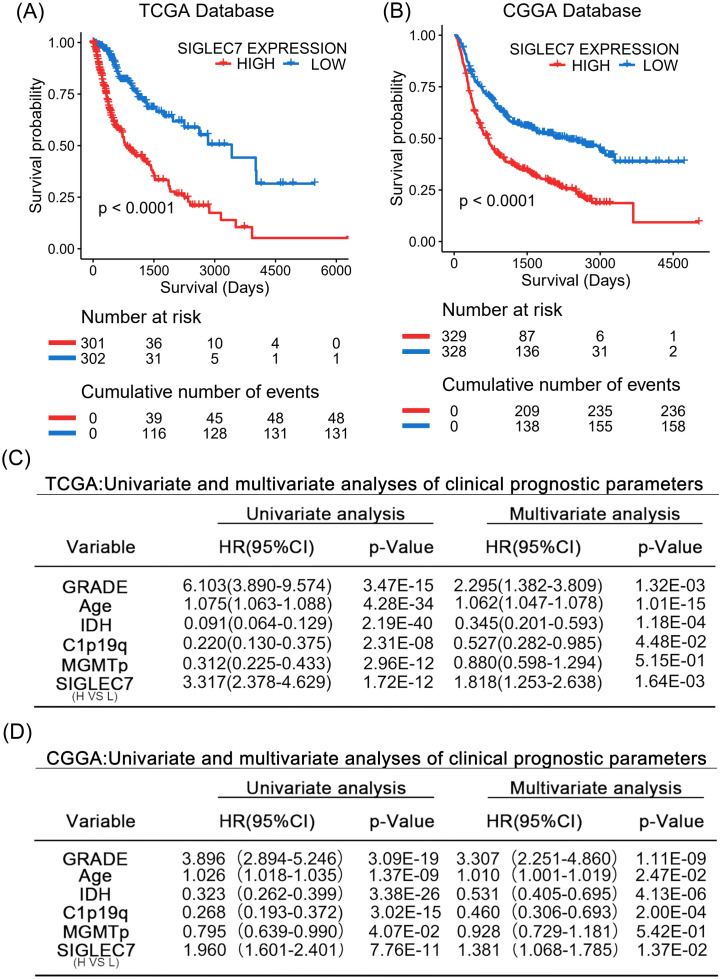
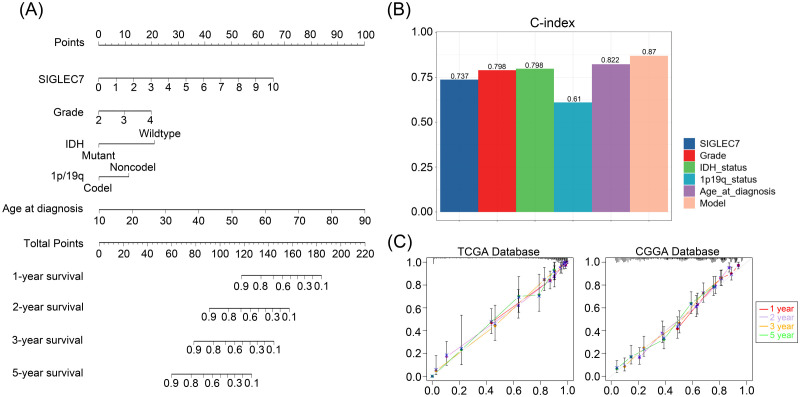
Results: SIGLEC7 expression was significantly increased in glioma patients with malignant characteristics. Survival analysis indicated that glioma patients with high SIGLEC7 expression had significantly lower survival rates. Gene function analysis revealed that SIGLEC7 is primarily involved in immune and inflammatory responses and is strongly negatively correlated with tumor-associated immune regulation. Additionally, the expression of most immune checkpoints was positively correlated with SIGLEC7, and immune cell infiltration analysis clearly demonstrated a significant positive correlation between SIGLEC7 expression and M2 macrophage infiltration levels. Single-cell analysis, along with tissue and cell experiments, confirmed that SIGLEC7 enhances macrophage polarization towards the M2 phenotype, thereby promoting glioma invasiveness through the immunosuppressive effects of M2 macrophages. Cox regression analysis and the establishment of survival prediction models indicated that high SIGLEC7 expression is an unfavorable prognostic factor for glioma patients.
Discussion: High SIGLEC7 expression predicts poor prognosis in glioma patients and is closely associated with M2 macrophages in the tumor environment. In the future, SIGLEC7 may become a promising target for glioma immunotherapy.
Keywords: M2 macrophage; SIGLEC7; glioma; prognostic indicator; tumor immunity.
Copyright © 2024 An, Ren, Yuan, Qiu, Wang, Cheng, He, Han, Li and An.
Conflict of interest statement
Author PW, YC, ZH and XH are employed by the company Beijing Yihua Biotechnology Co., Ltd. The remaining authors declare that the research was conducted in the absence of any commercial or financial relationships that could be construed as a potential conflict of interest.
Figures
Similar articles
-
CLEC7A regulates M2 macrophages to suppress the immune microenvironment and implies poorer prognosis of glioma.Front Immunol. 2024 May 23;15:1361351. doi: 10.3389/fimmu.2024.1361351. eCollection 2024. Front Immunol. 2024. PMID: 38846954 Free PMC article.
-
Complement C1S is a potential prognostic biomarker and associated with M2 macrophage infiltration in gliomas: From bioinformatics to comprehensive experimental validation.Int Immunopharmacol. 2024 Dec 25;143(Pt 3):113573. doi: 10.1016/j.intimp.2024.113573. Epub 2024 Nov 7. Int Immunopharmacol. 2024. PMID: 39515040
-
Macrophage polarization-related gene signature for risk stratification and prognosis of survival in gliomas.J Cell Mol Med. 2024 Oct;28(20):e70000. doi: 10.1111/jcmm.70000. J Cell Mol Med. 2024. PMID: 39448550 Free PMC article.
-
Annexin A's Life in Pan-Cancer: Especially in Glioma Immune Cells.Neuromolecular Med. 2025 Feb 26;27(1):17. doi: 10.1007/s12017-024-08827-9. Neuromolecular Med. 2025. PMID: 40011350 Review.
-
Tumor-derived extracellular vesicles: how they mediate glioma immunosuppression.Mol Biol Rep. 2024 Jan 28;51(1):235. doi: 10.1007/s11033-023-09196-5. Mol Biol Rep. 2024. PMID: 38282090 Review.
Cited by
-
Elevated Siglec-7 expression correlates with adverse clinicopathological, immunological, and therapeutic response signatures in breast cancer patients.Front Immunol. 2025 Jun 6;16:1573365. doi: 10.3389/fimmu.2025.1573365. eCollection 2025. Front Immunol. 2025. PMID: 40547037 Free PMC article.
-
Mechanistic and Therapeutic Implications of Protein and Lipid Sialylation in Human Diseases.Int J Mol Sci. 2024 Nov 7;25(22):11962. doi: 10.3390/ijms252211962. Int J Mol Sci. 2024. PMID: 39596031 Free PMC article. Review.
-
Limitations of nomogram models in predicting survival outcomes for glioma patients.Front Immunol. 2025 Mar 18;16:1547506. doi: 10.3389/fimmu.2025.1547506. eCollection 2025. Front Immunol. 2025. PMID: 40170838 Free PMC article.
References
MeSH terms
Substances
LinkOut - more resources
Full Text Sources
Other Literature Sources
Medical
Molecular Biology Databases
Research Materials