What to Choose for Estimating Leaf Water Status-Spectral Reflectance or In vivo Chlorophyll Fluorescence?
- PMID: 39211292
- PMCID: PMC11358408
- DOI: 10.34133/plantphenomics.0243
What to Choose for Estimating Leaf Water Status-Spectral Reflectance or In vivo Chlorophyll Fluorescence?
Abstract
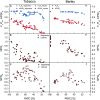
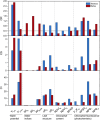
In the context of global climate change and the increasing need to study plant response to drought, there is a demand for easily, rapidly, and remotely measurable parameters that sensitively reflect leaf water status. Parameters with this potential include those derived from leaf spectral reflectance (R) and chlorophyll fluorescence. As each of these methods probes completely different leaf characteristics, their sensitivity to water loss may differ in different plant species and/or under different circumstances, making it difficult to choose the most appropriate method for estimating water status in a given situation. Here, we present a simple comparative analysis to facilitate this choice for leaf-level measurements. Using desiccation of tobacco (Nicotiana tabacum L. cv. Samsun) and barley (Hordeum vulgare L. cv. Bojos) leaves as a model case, we measured parameters of spectral R and chlorophyll fluorescence and then evaluated and compared their applicability by means of introduced coefficients (coefficient of reliability, sensitivity, and inaccuracy). This comparison showed that, in our case, chlorophyll fluorescence was more reliable and universal than spectral R. Nevertheless, it is most appropriate to use both methods simultaneously, as the specific ranking of their parameters according to the coefficient of reliability may indicate a specific scenario of changes in desiccating leaves.
Copyright © 2024 Martina Špundová et al.
Conflict of interest statement
Competing interests: The authors declare that they have no competing interests.
Figures


References
-
- Marchetti CF, Ugena L, Humplík JF, Polák M, Ćavar Zeljković S, Podlešáková K, Fürst T, De Diego N, Spíchal L. A novel image-based screening method to study water-deficit response and recovery of barley populations using canopy dynamics phenotyping and simple metabolite profiling. Front Plant Sci. 2019;10:445018. - PMC - PubMed
-
- Cao J, An Q, Zhang X, Xu S, Si T, Niyogi D. Is satellite Sun-induced chlorophyll fluorescence more indicative than vegetation indices under drought condition? Sci Total Environ. 2021;792:148396. - PubMed
-
- Quemada C, Pérez-Escudero JM, Gonzalo R, Ederra I, Santesteban LG, Torres N, Iriarte JC. Remote sensing for plant water content monitoring: A review. Remote Sens. 2021;13(11):2088.
-
- Zendonadi dos Santos N, Piepho HP, Condorelli GE, Licieri Groli E, Newcomb M, Ward R, Tuberosa R, Maccaferri M, Fiorani F, Rascher U, et al. . High-throughput field phenotyping reveals genetic variation in photosynthetic traits in durum wheat under drought. Plant Cell Environ. 2021;44(9):2858–2878. - PubMed
-
- Junttila S, Hölttä T, Saarinen N, Kankare V, Yrttimaa T, Hyyppä J, Vastaranta M. Close-range hyperspectral spectroscopy reveals leaf water content dynamics. Remote Sens Environ. 2022;277:113071.
LinkOut - more resources
Full Text Sources
Research Materials

