Review
. 2024 Aug 20;15(35):14122-14153.
doi: 10.1039/d4sc04158e. Online ahead of print.

Recent advances in ionic thermoelectric systems and theoretical modelling

Affiliations
Review

Recent advances in ionic thermoelectric systems and theoretical modelling

Nazish Jabeen et al. Chem Sci. .

Abstract

Converting waste heat from solar radiation and industrial processes into useable electricity remains a challenge due to limitations of traditional thermoelectrics. Ionic thermoelectric (i-TE) materials offer a compelling alternative to traditional thermoelectrics due to their excellent ionic thermopower, low thermal conductivity, and abundant material options. This review categorizes i-TE materials into thermally diffusive and thermogalvanic types, with an emphasis on the former due to its superior thermopower. This review also highlights the i-TE materials for creating ionic thermoelectric supercapacitors (ITESCs) that can generate significantly higher voltages from low-grade heat sources compared to conventional technologies. Additionally, it explores thermogalvanic cells and combined devices, discussing key optimization parameters and theoretical modeling approaches for maximizing material and device performance. Future directions aim to enhance i-TE material performance and address low energy density challenges for flexible and wearable applications. Herein, the cutting-edge of i-TE materials are comprehensively outlined, empowering researchers to develop next-generation waste heat harvesting technologies for a more sustainable future.


Conflict of interest statement

The authors declare that there is no conflict of interest.

Figures

Fig. 1
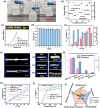
Fig. 1. Recent advances in strategic development and application of ionic thermoelectric materials and devices.
Fig. 2
Fig. 2. Representation of (a) diagram portraying a group of n-type and p-type e-TE materials, (b) thermodiffusive-based i-TE materials, (c) thermogalvanic-based i-TE material, (d) the internal structure of a thermodiffusive-based i-TE materials in its operational mode, reproduced with permission. Copyright 2023, Wiley-VCH. (e) Electric double-layer in supercapacitor, reproduced with permission. Copyright 2019, Elsevier.
Fig. 3
Fig. 3. (a) Schematic representation of ITEGs, reproduced with permission. Copyright 2022, Wiley-VCH. (b) Chemical interactions between PEDOT:PSS and [EMIM:DCA], reproduced with permission. Copyright 2023, Wiley-VCH (c) voltage output of a wearable i-TE device, reproduced with permission. Copyright 2022, Wiley-VCH. (d–f) Photographs of the i-TE generators, reproduced with permission. Copyright 2023, Wiley-VCH.
Fig. 4
Fig. 4. (a) Illustration of the ITESCs device (left) featuring two distinct electrodes (right, Au and CNT), along with the reaction occurring in the solution. (b) Recorded Vthermo and ΔT during the heating process using the Au electrode. (c) The observed Vthermo while heating with either CNT or Au electrodes. (d) Vthermo at various ΔT values using CNT electrodes (black solid squares) and Au electrodes (red open squares), reproduced with permission. Copyright 2016, Royal Society of Chemistry.
Fig. 5
Fig. 5. Operation principle of ITESC (a) schematic mechanism: (i) ΔT generates ionic thermal voltage, (ii) thermoelectric charging, (iii) ΔT removal for ion equilibrium, (iv) discharging. (b) Charging/discharging with periodic heating, reproduced with permission. Copyright 2017, Wiley-VCH. (c) Depicts the energy density of the ITESC compared to both ΔT and electric charging methods. The red open circles represent the data for the ITESC, while the blue open squares represent electric charging. The dashed lines show theoretical predictions based on thermal voltage (Vthermo, dashed red line), electric voltage (Velectric, dashed blue line), and effective voltage (Veffective, dashed and dotted black line), reproduced with permission. Copyright 2016, Royal Society of Chemistry.
Fig. 6
Fig. 6. Representation of (a) equivalent circuit and charge–discharge characteristics of ITESCs. (b) Thermal voltage of ITESCs vs. ΔT. (c) Stored charge as a function of ΔT. (d) The charge–discharge ratio in relation to both ΔT and voltage. (e) Potential applications of ITESCs in wearable electronics. (f) Output voltage from a prototype stretchable ITESC worn on the back of a hand, reproduced with permission. Copyright 2022, Wiley.
Fig. 7
Fig. 7. A comparison is presented between ionic and electronic thermoelectric materials within an ITESC. (a) Displays the experimental setup for ITESC measurement (left) and the corresponding equivalent circuit, highlighting the setup for experimental measurements (right). (b) Efficiency comparisons are drawn between different materials within the ITESC based on their ZT. (c) The impact of material choice on the ITESCs stored energy capacity by varying ZT values, reproduced with permission. Copyright 2017, Wiley-VCH.
Fig. 8
Fig. 8. (a) Preparation for a conductive composite hydrogel (GOaCNTpega-OPF-MTAC), reproduced with permission. Copyright 2017, American Chemical Society. (b) Reversible on-demand adjustment of ITESC capacity through light changes. (c) Synthesis of a cellulose-based ionic conductive hydrogel using entangled chain networks. (d) The schematic representation of PNIAPM-co-NMAM polyelectrolytes highlighting their self-protective and thermal-switching capabilities in energy storage devices, reproduced with permission. Copyright 2023, Elsevier. (e) Ionic thermoelectric properties of TcB9-2.5% lignin-based hydrogel infiltered with KOH electrolyte, reproduced with permission. Copyright 2024, Springer.
Fig. 9
Fig. 9. Schematic diagram of a TGC's operation.
Fig. 10
Fig. 10. (a) Working mechanism of TREC system for thermal energy harvesting, (b) electrochemical potential change of the electrodes. Reproduced with permission. Copyright 2019, ACS Publications.
Fig. 11
Fig. 11. Bacterial cellulose–LiBr–FeCN4−/3− hydrogel: mechanical properties (a) hydrogel holding 5 kg water bottle, (b) toughness and Young's modulus, (c) stress–strain curves; ionic thermoelectric properties (d) ionic thermopower variations over the period of 10 days, (e) output power density vs. temperature difference, reproduced with permission. Copyright 2023, Elsevier; organohydrogel electrolyte: (f) mechanical properties of hydrogel in tensile deformation including knotting and crossing stretching, (g) photos of the OHE after 6 h at different temperatures, (h) thermovoltage response vs. temperature difference, (i) conductivity as a function of temperature, and (j) comparison of this study with previous studies, reproduced with permission. Copyright 2023, Elsevier.
Fig. 12
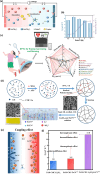
Fig. 12. PVA–GdmCl–FeCN4−/3− based thermogalvanic hydrogel: (a) schematic illustration of the Gdm+ contribution to the thermogalvanic effect, (b) Seebeck and conductivity as function of electrolyte concentration, (c) schematic diagram of employing the device to power up the medical devices and the comprehensive comparison with previous quasi-solid stretchable thermogalvanic thermocells, reproduced with permission. Copyright 2023, Wiley-VCH; cellulose–Li2SO4–FeCN4−/3− based thermogalvanic hydrogel: schematic representation of (d) preparation process of hydrogel and its microstructure, (e) mechanism of coupling effect, and (f) ionic Seebeck before and after coupling, reproduced with permission. Copyright 2023, Elsevier.
Fig. 13
Fig. 13. Methylcellulose–KCl–I/I3 based thermogalvanic gel: schematics of the polarization switching from (a) n-type to (b) p-type, (c) comparison of the thermopowers, schematics of (d) a p-type TGC with the ternary electrolyte and (e) salt-induced complexation. K+ and I3 ions, (f) comparison of this study with previous studies, reproduced with permission. Copyright 2022, Science; PVA-NaCl-SO4/32− based hydrogel (g) schematic illustration of design, chemical structure, morphology, and mechanical properties, (h) thermal voltage response at different temperature differences, and (i) output voltage of the hydrogel under 4-repeated heating–cooling cycles for powering LED, reproduced with permission. Copyright 2023, Elsevier.
Fig. 14
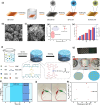
Fig. 14. 3D Au/Cu electrodes: (a) schematic illustration showing the preparation process of the 3D Au/Cu foil from 2D Cu foil, (b and c) SEM images of as-fabricated microflower CuO foil, (d) thermoelectric performance comparison of this work with previous studies, (e) output power density compared to RF values of electrodes, reproduced with permission. Copyright 2022, Wiley-VCH; PANI@CWF electrodes with cellulose–H2SO4 hydrogel: (f) schematic diagram of the preparation process and chemical structure of hydrogel, (g) digital image of PANI@CWF electrodes, (h) schematic diagram of hydrogel networks under ΔT, (i) thermal charging and electrical discharging process of the integrated generator, (j) LED light powered by the generator, and (k) comparison of this work with previous studies, reproduced with permission. Copyright 2023, Wiley-VCH.
Fig. 15
Fig. 15. Seebeck coefficient as a function of the electrical conductivity, reproduced with permission. Copyright 2020, Wiley-VCH.
Fig. 16
Fig. 16. Seebeck and Nernst coefficients, reproduced with permission. Copyright 2021, American Physical Society.
Fig. 17
Fig. 17. Upper panel: electrolyte with the ions in thermal equilibrium; lower panel: ion distribution when a temperature gradient exists through the electrolyte.
Fig. 18
Fig. 18. S(t)/Slate (eqn (27)) for several values of τapD+/L2 [0.01 (red), 0.1 (blue), 1 (magenta), and 10 (black)] with ξD+/D = 2, α+ = 0.5, α = 0.1, z+ = −z = 1, and max(j) = 500 throughout. For these parameters, Searly = (3/2)Slate.
Fig. 19
Fig. 19. Left panel: The channel drawn in Fig. 14 (length 2L along x) has now a lateral dimension of width 2h (along the y-axis) confining the electrolyte. The positive ions moving towards the wall create charges in the Electric Double Layer (EDL). Right panel: cylindrical channel from lignin with an electrolyte and K+ and OH ions.
Fig. 20
Fig. 20. Future directions and outlooks for i-TE materials and devices.

References

    1. Sun S. Li M. Shi X. L. Chen Z. G. Advances in ionic thermoelectrics: from materials to devices. Adv. Energy Mater. 2023;13(9):2203692. doi: 10.1002/aenm.202203692. - DOI
    1. Zhou Z. Wan Y. Zi J. Ye G. Jin T. Geng X. Zhuang W. Yang P. Flexible hydrogel with a coupling enhanced thermoelectric effect for low-grade heat harvest. Mater. Today Sustain. 2023;21:100293.
    1. Gao C. Yin Y. Zheng L. Liu Y. Sim S. He Y. Zhu C. Liu Z. Lee H. W. Yuan Q. Engineering the electrochemical temperature coefficient for efficient low-grade heat harvesting. Adv. Funct. Mater. 2018;28(35):1803129. doi: 10.1002/adfm.201803129. - DOI
    1. Muddasar M. Mushtaq M. Beaucamp A. Kennedy T. Culebras M. Collins M. N. Synthesis of sustainable lignin precursors for hierarchical porous carbons and their efficient performance in energy storage applications. ACS Sustain. Chem. Eng. 2024;12:2352–2363. doi: 10.1021/acssuschemeng.3c07202. - DOI - PMC - PubMed
    1. Wei J. Yang L. Ma Z. Song P. Zhang M. Ma J. Yang F. Wang X. Review of current high-ZT thermoelectric materials. J. Mater. Sci. 2020;55:12642–12704. doi: 10.1007/s10853-020-04949-0. - DOI

LinkOut - more resources