. 2024 Aug 5;10(16):e35838.
doi: 10.1016/j.heliyon.2024.e35838. eCollection 2024 Aug 30.

Rapid and robust isolation of microglia and vascular cells from brain subregions for integrative single-cell analyses

Affiliations

Rapid and robust isolation of microglia and vascular cells from brain subregions for integrative single-cell analyses

Efthalia Preka et al. Heliyon. .

Abstract

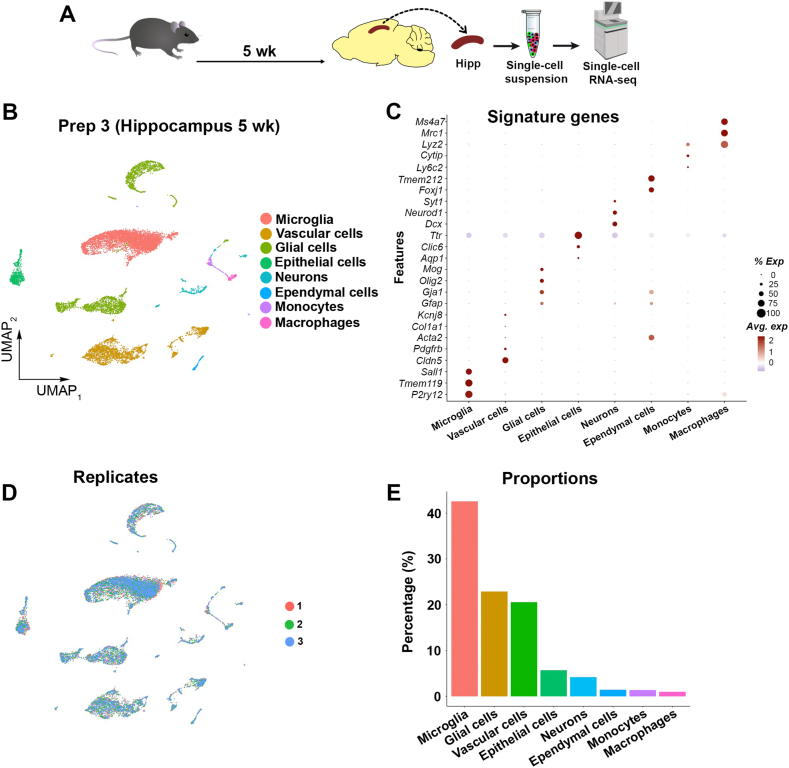
Cell isolation protocols from brain tissue include prolonged ex vivo processing durations, rendering them suboptimal for transcriptomic studies. Particularly for microglia and vascular cells, current isolation methods produce lower yields, necessitating addition of an enrichment step, and use of large tissue volumes - in most cases whole brain tissue - to obtain sufficient yields. Here, we developed a simple, rapid, and reproducible cell isolation method for generating single-cell suspensions from micro-dissected brain regions, enriched for microglia and vascular cells, without an enrichment step. Cells isolated using this method are suitable for molecular profiling studies using 10 × Genomics Chromium single-cell RNA sequencing with high reproducibility. Our method is valuable for longitudinal unbiased molecular profiling of microglia and vascular cells within different brain regions, spanning multiple time points across physiological development or disease progression.

Keywords: Endothelial cells; Neuroinflammation; Pericytes; RNA sequencing; Vascular disease.


Conflict of interest statement

The authors declare that they have no known competing financial interests or personal relationships that could have appeared to influence the work reported in this paper.

Figures

Fig. 1
Fig. 1
Rapid isolation of viable cells from micro-dissected brain regions (A) Schematic illustrating the steps of the single-cell isolation protocol. (B) Representative images displaying the cortical tissue handling through the different steps of generation of the single-cell suspension, starting by placing the harvested tissue onto a glass slide [1], followed by tissue chopping [2] and transferring the chopped tissue into a 15 ml conical tube [3] containing 1 ml of the enzymatic solution [4]. After incubation for 10 min, followed by several gentle pipetting up and down, the tissue is fully digested, producing a homogenous solution, allowing filtering the obtained cell suspension into a new conical tube [5]. The suspension is then spun to pellet the cells and myelin debri in the bottom of the tube [6]. The pellet is resuspended in the Percoll solution (7; bottom pink solution) and overlaid with HBSS (top clear solution). The black arrows indicate the interface between the two solutions, before the centrifugation [7], and after, where the myelin debri accumulate [8] and the cells remain in the bottom of the tube. (C) Viability of isolated cells. Left: Representative image of trypan blue exclusion for assessing cell viability. Black arrows indicate viable cells; white arrows indicate dead cells; red arrows indicate debris. Right: Bar plot showing the number of viable cells obtained from two independent preparations from the cerebral cortex of three- or nine-week-old mice, Prep 1 and Prep 2, respectively. (For interpretation of the references to colour in this figure legend, the reader is referred to the Web version of this article.)
Fig. 2
Fig. 2
Consistent cell isolation method appropriate for investigating of microglial and vascular transcriptomics. Also see Supplementary Fig. 1. (A) Scheme illustrating the experimental design. wk = weeks. 3 wk, n = 3; 9 wk, n = 3. (B) Uniform manifold approximation and projection (UMAP) showing clustering of cell types obtained from the cerebral cortex of three-week-old mice (Prep 1). NPCs = Neural progenitor cells. T/NK = T- and natural killer cells. (C) Dot plot showing the expression of signature genes identifying the captured cell populations. (D) Bar plot showing the proportions of different cell types obtained from the cerebral cortex of three-week-old mice. (E) UMAP visualizing the microglial population obtained from the cerebral cortex of three-week-old mice, identified by P2ry12 expression. (F) Subclustering of microglial cells revealed five unique subtypes (MG1 - MG5). (G) UMAPs visualizing the vascular cell types obtained from the cerebral cortex of three-week-old mice, endothelial cells (Cldn5), pericytes (Pdgfrb), vascular smooth muscle cells (VSMCs; Acta2), and fibroblasts (Col1a1). (H) UMAP showing clustering of cell types obtained from the cerebral cortex of nine-week-old mice (Prep 2). (I) Bar plot showing the proportions of different cell types obtained from the cerebral cortex of nine-week-old mice.
Fig. 3
Fig. 3
Reproducible cell isolation and scRNA-seq data across brain regions (A) Scheme illustrating the experimental design. n = 3. (B) UMAP showing clustering of cell types obtained from the hippocampus of five-week-old mice (Prep 3). (C) Dot plot showing the expression of signature genes identifying the captured cell populations. (D) UMAP displaying cells obtained from the three sequencing replicates performed in Prep 3 (replicate 1 = red, replicate 2 = green, replicate 3 = blue). (E) Bar plot showing the proportions of different cell types obtained from the hippocampus of five-week-old mice. (For interpretation of the references to colour in this figure legend, the reader is referred to the Web version of this article.)
Fig. 4
Fig. 4
Integrative across-time and across-region scRNA-seq analyses using cells obtained from distinct isolations. (A) UMAP showing cell populations obtained when integrating scRNA-seq datasets from the two independent cortical preparations from three- and nine-week-old mice. (B) Dot plot showing the expression of signature genes identifying the captured cell populations (C) UMAP visualizing the cells obtained from each independent preparation. (D) UMAP showing cell populations obtained when integrating scRNA-seq datasets from the two cortical and hippocampal preparations. (E) Dot plot showing the expression of signature genes identifying the captured cell populations (F) UMAP visualizing the cells obtained from each preparation. Red = Prep 1: Cortex from three-week-old mice; Blue = Prep 2: Cortex from nine-week-old mice; Green = Prep 3: Hippocampus from five-week-old mice. (For interpretation of the references to colour in this figure legend, the reader is referred to the Web version of this article.)

References

    1. Anaparthy N., Ho Y.J., Martelotto L., Hammell M., Hicks J. Single-cell applications of next-generation sequencing. Cold Spring Harb Perspect Med. 2019;9(10) - PMC - PubMed
    1. Conchinha N.V., Sokol L., Teuwen L.A., Veys K., Dumas S.J., Meta E., et al. Protocols for endothelial cell isolation from mouse tissues: brain, choroid, lung, and muscle. STAR Protoc. 2021;2(3) - PMC - PubMed
    1. Hammond T.R., Dufort C., Dissing-Olesen L., Giera S., Young A., Wysoker A., et al. Single-cell RNA sequencing of microglia throughout the mouse lifespan and in the injured brain reveals complex cell-state changes. Immunity. 2019;50(1):253–271 e6. - PMC - PubMed
    1. Herron S., Delpech J.C., Madore C., Ikezu T. Using mechanical homogenization to isolate microglia from mouse brain tissue to preserve transcriptomic integrity. STAR Protoc. 2022;3(4) - PMC - PubMed
    1. Vanlandewijck M., He L., Mae M.A., Andrae J., Ando K., Del Gaudio F., et al. A molecular atlas of cell types and zonation in the brain vasculature. Nature. 2018;554(7693):475–480. - PubMed