

Exploring the bias: how skin color influences oxygen saturation readings via Monte Carlo simulations
- PMID: 39211937
- PMCID: PMC11358849
- DOI: 10.1117/1.JBO.29.S3.S33308
Exploring the bias: how skin color influences oxygen saturation readings via Monte Carlo simulations
Abstract
Significance: Our goal is to understand the root cause of reported oxygen saturation ( ) overestimation in heavily pigmented skin types to devise solutions toward enabling equity in pulse oximeter designs.
Aim: We aim to gain theoretical insights into the effect of skin tone on curves using a three-dimensional, four-layer tissue model representing a finger.
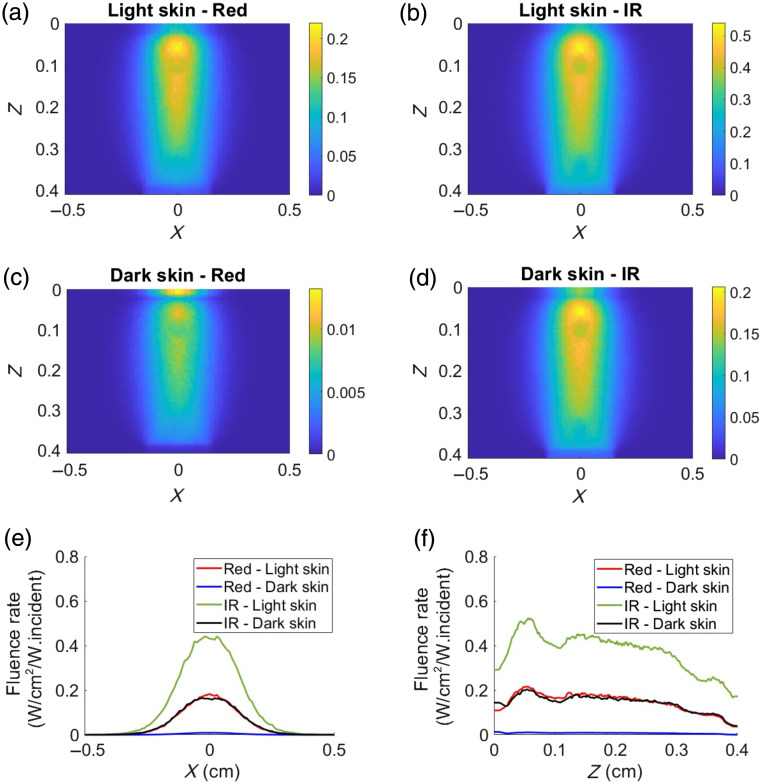
Approach: A finger tissue model, comprising the epidermis, dermis, two arteries, and a bone, was developed using a Monte Carlo-based approach in the MCmatlab software. Two skin tones-light and dark-were simulated by adjusting the absorption and scattering properties within the epidermal layer. Following this, curves were generated in various tissue configurations, including transmission and reflection modes using red and infrared wavelengths. In addition, the influence of source-detector (SD) separation distances on both light and dark skin tissue models was studied.
Results: In transmission mode, curves did not deviate with changes in skin tones because both pulsatile and non-pulsatile terms experienced equal attenuation at red and infrared wavelengths. However, in reflection mode, measurable variations in curves were evident. This was due to differential attenuation of the red components, which resulted in a lower perfusion index at the red wavelength in darker skin. As the SD separation increased, the effect of skin tone on curves in reflection mode became less pronounced, with the largest SD separation exhibiting effects similar to those observed in transmission mode.
Conclusions: Monte Carlo simulations have demonstrated that different light pathlengths within the tissue contribute to the overestimation of in people with darker skin in reflection mode pulse oximetry. Increasing the SD separation may mitigate the effect of skin tone on readings. These trends were not observed in transmission mode; however, further planned research using more complex models of the tissue is essential.
Keywords: Monte Carlo; melanin; occult hypoxemia; oxygen saturation; pulse oximeter; racial bias; skin color; transmission mode.
© 2024 The Authors.
Figures


Similar articles
-
Monte Carlo simulation of the effect of melanin concentration on light-tissue interactions for transmittance pulse oximetry measurement.J Biomed Opt. 2024 Jun;29(Suppl 3):S33305. doi: 10.1117/1.JBO.29.S3.S33305. Epub 2024 Aug 13. J Biomed Opt. 2024. PMID: 39139814 Free PMC article.
-
Dual-ratio approach to pulse oximetry and the effect of skin tone.J Biomed Opt. 2024 Jun;29(Suppl 3):S33311. doi: 10.1117/1.JBO.29.S3.S33311. Epub 2024 Oct 12. J Biomed Opt. 2024. PMID: 39398358 Free PMC article.
-
Effects of targeting lower versus higher arterial oxygen saturations on death or disability in preterm infants.Cochrane Database Syst Rev. 2017 Apr 11;4(4):CD011190. doi: 10.1002/14651858.CD011190.pub2. Cochrane Database Syst Rev. 2017. PMID: 28398697 Free PMC article.
-
Effect of skin tone on the accuracy of the estimation of arterial oxygen saturation by pulse oximetry: a systematic review.Br J Anaesth. 2024 May;132(5):945-956. doi: 10.1016/j.bja.2024.01.023. Epub 2024 Feb 17. Br J Anaesth. 2024. PMID: 38368234 Free PMC article.
-
Structured light imaging mesoscopy: detection of embedded morphological changes in superficial tissues.J Biomed Opt. 2025 Jun;30(6):065001. doi: 10.1117/1.JBO.30.6.065001. Epub 2025 Jun 18. J Biomed Opt. 2025. PMID: 40534904 Free PMC article.
Cited by
-
Pulse Oximetry: 50 Years of Inventions & Discoveries in Biomedical Optics.J Biomed Opt. 2024 Jun;29(Suppl 3):S33301. doi: 10.1117/1.JBO.29.S3.S33301. Epub 2025 Jan 7. J Biomed Opt. 2024. PMID: 39776835 Free PMC article.
-
Analysis of the Effect of Skin Pigmentation and Oxygen Saturation on Monte Carlo-Simulated Reflectance Photoplethysmography Signals.Sensors (Basel). 2025 Jan 10;25(2):372. doi: 10.3390/s25020372. Sensors (Basel). 2025. PMID: 39860743 Free PMC article.
References
-
- BS EN 80601-2-61:2019, “Medical electrical equipment. Particular requirements for basic safety and essential performance of pulse oximeter equipment,” https://bsol.bsigroup.com.
Publication types
MeSH terms
Substances
LinkOut - more resources
Full Text Sources
Research Materials
