. 2025 Feb 4;19(2):jjae132.
doi: 10.1093/ecco-jcc/jjae132.

Pharmacological Inhibition of N-Acylethanolamine Acid Amidase (NAAA) Mitigates Intestinal Fibrosis Through Modulation of Macrophage Activity

Affiliations

Pharmacological Inhibition of N-Acylethanolamine Acid Amidase (NAAA) Mitigates Intestinal Fibrosis Through Modulation of Macrophage Activity

Maria Francesca Nanì et al. J Crohns Colitis. .

Abstract

Background and aims: Intestinal fibrosis, a frequent complication of inflammatory bowel disease, is characterized by stricture formation with no pharmacological treatment to date. N-acylethanolamine acid amidase (NAAA) is responsible for the hydrolysis of acylethanolamides (AEs, eg, palmitoylethanolamide and oleoylethanolamide). Here, we investigated NAAA and AE signaling in gut fibrosis.

Methods: NAAA and AE signaling were evaluated in human intestinal specimens from patients with stenotic Crohn's disease (CD). Gut fibrosis was induced by 2,4,6-trinitrobenzenesulfonic acid, monitored by colonoscopy, and assessed by qRT-PCR, histological analyses, and confocal microscopy. Immune cells in mesenteric lymph nodes were analyzed by FACS. Colonic fibroblasts were cultured in conditioned media derived from polarized or non-polarized bone marrow-derived macrophages (BMDMs). IL-23 signaling was evaluated by qRT-PCR, ELISA, FACS, and western blot in BMDMs and in lamina propria CX3CR1+ cells.

Results: In ileocolonic human CD strictures, increased transcript expression of NAAA was observed with a decrease in its substrates oleoylethanolamide and palmitoylethanolamide. NAAA inhibition reduced intestinal fibrosis in vivo, as indicated by a decrease in inflammatory parameters, collagen deposition, and fibrosis-related genes, including those involved in epithelial-to-mesenchymal transition. More in-depth studies revealed modulation of the immune response related to IL-23 following NAAA inhibition. The antifibrotic actions of NAAA inhibition are mediated by Mφ and M2 macrophages that indirectly affect fibroblast collagenogenesis. NAAA inhibitor AM9053 normalized IL-23 signaling in BMDMs and in lamina propria CX3CR1+ cells.

Conclusions: Our findings provide new insights into the pathophysiological mechanism of intestinal fibrosis and identify NAAA as a promising target for the development of therapeutic treatments to alleviate CD-related fibrosis.

Keywords: Acylethanolamides; IL-23; intestinal fibrosis.


Conflict of interest statement

None declared.

Figures

Graphical Abstract
Graphical Abstract
Figure 1
Figure 1
N-acylethanolamine acid amidase (NAAA) is upregulated in stenotic colonic tissues of Crohn’s disease (CD) patients, which is associated with a reduction of its substrates. (A) Quantification of collagen deposition by hydroxyproline assay in ileocolonic tissues from CD patients in which “healthy” means the nonstenotic area compared to the stenotic area of the same patient defined as “CD fibrotic.” Results are reported as absorbance values (560 nm) proportional to the content of hydroxyproline. Data are presented as means ± SEM of n = 10 CD patients. **p ≤ 0.01 as calculated by paired Student’s t test. (B-F) COL2A1 (B), COL3A1 (C), TGF-β (D), IL-23 (E), and NAAA (F) gene expressions evaluated by RT-qPCR in ileocolonic tissues from CD patients in which “healthy” means the nonstenotic area compared to the stenotic area of the same patient defined as “CD fibrotic”. Results are calculated using the 2-ΔCt formula. Data are presented as means ± SEM of n = 10 CD patients in which outliers have been removed by ROUT test. *p ≤ 0.05 and **p ≤ 0.01 as calculated by paired Student’s t test. (G, H) NAAA protein expression by western blot analysis of ileocolonic tissues from CD patients in which “healthy” means the nonstenotic area compared to the stenotic area of the same patient defined as “CD fibrotic”. NAAA protein expression was normalized on housekeeping protein α-tubulin. Representative immunoblots (H). Data are presented as means ± SEM of n = 10 CD patients. *p ≤ 0.05 as calculated by paired Student’s t test. (I-K) Endogenous-level measurements of palmitoylethanolamide (PEA) (I), oleoylethanolamide (OEA) (J), and anandamide (AEA) (K) by LC-APCI-MS of ileocolonic tissues from CD patients in which “healthy” means the nonstenotic area compared to the stenotic area of the same patient defined as “CD fibrotic.” The levels of AEs are reported as pmol/mg of lipid extract. Data are presented as means ± SEM of n = 10 CD patients in which outliers have been removed by ROUT test. ***p ≤ 0.001 as calculated by paired Student’s t test.
Figure 2
Figure 2
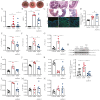
N-acylethanolamine acid amidase (NAAA) inhibition ameliorates murine intestinal fibrosis. (A) Disease Activity Index (DAI) score of control mice, 2,4,6-trinitrobenzensulfonic acid (TNBS)-treated mice, and TNBS-treated mice with NAAA inhibitor AM9053 (20 mg/kg/i.p.). DAI score was measured every 2 days. DAI was assessed considering stool consistency and presence of blood. Error bars represent mean ± SEM; *p ≤ 0.05 and **p ≤ 0.01 as calculated by 1-way analysis of variance (ANOVA) followed by Dunnett’s post hoc test. (B) Murine Endoscopic Index of Colitis Severity (MEICS) in control mice, TNBS-treated mice, and TNBS-treated mice with NAAA inhibitor AM9053 (20 mg/kg/i.p.). Error bars represent mean ± SEM of n = 4-5 mice per experimental group; *p ≤ 0.05 and ***p ≤ 0.001 as calculated by 1-way ANOVA followed by Dunnett’s post hoc test. Representative colonoscopy images, carried out at the day of sacrifice, of control mice, TNBS-treated mice, and TNBS-treated mice with the NAAA inhibitor AM9053 (20 mg/kg/i.p.) are reported at the top of the graph. (C) Representative images for hematotoxilin & eosin (H&E) stain (10×) (upper images), Masson’s trichrome stain for collagen fiber deposition in which the blue color indicates collagen fibers (10×) (middle images), and confocal images of α-SMA/DAPI, in which the green color represents α-SMA and the blue the nuclei staining  (20×) (lower images) in control mice, TNBS-treated mice, and TNBS-treated mice with the NAAA inhibitor AM9053 (20 mg/kg/i.p.). (D) Quantification of intensity fluorescence mean values of α-SMA signals. Error bars represent mean ± SEM of n = 4-5 mice per experimental group; *p ≤ 0.05 assessed by 1-way ANOVA followed by Dunnett’s multiple comparisons. (E-N) Gene expression associated with intestinal fibrosis and epithelial-to-mesenchymal transition, namely COL2A1 (E), COL3A1 (F), IL-23 (G), TGF-β (I), Vimentin (J), E-cadherin (K), Slug (L), SNA1 (M), and TWIST (N), evaluated by RT-qPCR in intestinal specimens of control mice, TNBS-treated mice, and TNBS-treated mice with NAAA inhibitor AM9053 (20 mg/kg/i.p.). Results are calculated using the 2-ΔCt formula. Error bars represent mean ± SEM of n = 4-5 mice per experimental group. *p ≤ 0.05, **p ≤ 0.01, and ***p ≤ 0.001 as calculated by 1-way ANOVA followed by Dunnett’s post hoc test. (H) pSTAT3(Y705) protein expression by western blot analysis in intestinal specimens of control mice, TNBS-treated mice, and TNBS-treated mice with NAAA inhibitor AM9053 (20 mg/kg/i.p.) and normalized on total STAT3 and/or tubulin. Representative immunoblots are reported on top of the graph. Data are presented as means ± SEM of n = 7 independent samples. *p ≤ 0.05 and**p ≤ 0.01 as assessed by 1-way ANOVA followed by Dunnett’s multiple comparisons.
Figure 3
Figure 3
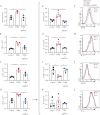
AM9053 influences Th subsets in mesenteric lymph nodes. Flow cytometry strategy was applied to identify the modulation of Th1, Th2, Th17, and Treg subsets. Total cells (A), isolated from mesenteric lymph nodes, were gated in their totality before the identifications of CD3+ (B), CD8+ (C), and CD4+ (D) populations. After washing, CD4+ cells were fixated, permeabilized, and stained intracellularly with INF-γ, IL-17A, FOXP3, and IL-4 antibodies. Th1, Th17, Treg, and Th2 populations were defined as CD4+/INF-γ+ (E and F), CD4+/IL-17+ (G and H), CD4+/CD25+/FOXP3+ (I and J), and CD4+/IL-4+ (K and L), respectively. Histograms (E, G, I, K) indicate the total positive populations (expressed as 1 × 106 cells and calculated from means of % of positive cells), in the different experimental conditions. FACS pictures (F, H, J, L) are representative of n = 3 mice per group. Data are presented as means ± SEM of n = 3 mice per group. Statistical analysis was conducted by 1-way analysis of variance (ANOVA) followed by Dunnett’s for multiple comparisons. *p ≤ 0.05 and **p ≤ 0.01.
Figure 4
Figure 4
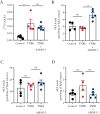
Acylethanolamide (AE) signaling analysis in fibrotic mice. (A) AE degradative enzyme NAAA gene expression evaluated by RT-qPCR in intestinal specimens of control mice, 2,4,6-trinitrobenzensulfonic acid (TNBS)-treated mice, and TNBS-treated mice with NAAA inhibitor AM9053 (20 mg/kg/i.p.). Results are calculated using the 2-ΔCt formula. Error bars represent mean ± SEM of n = 4-5 mice per experimental group. **p ≤ 0.01 as calculated by 1-way analysis of variance (ANOVA) followed by Dunnett’s post hoc test; n.s., not significant. (B-D) Endogenous-level measurements of AEs: palmitoylethanolamide (PEA) (B), oleoylethanolamide (OEA) (C), and anandamide (AEA) (D), in colon samples of control mice, TNBS-treated mice, and TNBS-treated mice with NAAA inhibitor AM9053 evaluated by LC-APCI-MS analysis. The levels of AEs are reported as pmol/mg of lipid extract. Error bars represent mean ± SEM of n = 4-5 mice per experimental group. **p ≤ 0.01 as calculated by 1-way ANOVA followed by Dunnett’s post hoc test; n.s., not significant.
Figure 5
Figure 5
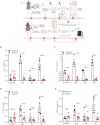
Macrophages are involved in antifibrotic effects of N-acylethanolamine acid amidase (NAAA) inhibition. (A) Schematic diagram showing the experimental schedule for the culturing of primary colonic fibroblasts in conditioned media from bone marrow-derived macrophages (BMDMs), polarized or non-polarized, under NAAA inhibition pretreatment. The image was created by using BioRender.com.  (B-E) Expression of collagenogenesis-associated genes, namely COL1A2 (B), COL3A1 (C), COL4A1 (D), and Fibronectin (E), evaluated by RT-qPCR in fibroblasts alone or in the presence of conditioned media derived from naive Mφ BMDMs and/or polarized in M1 and M2, with or without pretreatment with the NAAA inhibitor AM9053. Error bars represent mean ± SEM of n = 4-6 independent experiments, referring to the number of mice used for isolating colonic fibroblasts and paired bone marrow macrophages. **p ≤ 0.01 and ***p ≤ 0.001 as calculated by ONE-way analysis of variance (ANOVA) followed by Dunnett’s post hoc test; n.s., not significant.
Figure 6
Figure 6
AM9053 inhibits IL-23 signaling in bone marrow-derived macrophages (BMDMs). BMDMs were isolated from C57BL/6 wild-type mice. After 7 days of culturing, cells were first exposed to AM9053 (1 µM) for 1 h prior to treatment with lipopolysaccharide (LPS) (10 ng/mL) for 3 h. (A-C) Measurements of palmitoylethanolamide (PEA) (A), oleoylethanolamide (OEA) (B), and anandamide (AEA) (C) by LC-APCI-MS in naive macrophages, alone (control), treated with LPS and/or pretreated with AM9053 + LPS. The levels of AEs are reported as pmol/mg of lipid extract. Data are presented as means ± SEM of n = 6 independent experiments obtained from 6 mice in which outliers have been removed by ROUT test. **p ≤ 0.01 as assessed by ONE-way analysis of variance (ANOVA) followed by Dunnett’s multiple comparisons. (D and E) IL-23 gene (D) and protein expressions (E) were evaluated by RT-qPCR and enzyme-linked immunosorbent assay (ELISA), respectively, in naive macrophages, alone (control), treated with LPS and pretreated with AM9053 + LPS. Results are calculated using the 2-ΔCt formula for RT-qPCR and expressed as pg/mL of IL-23 secretion in cell supernatants for ELISA. Data are presented as means ± SEM of n = 5-6 independent experiments obtained from 5 to 6 mice. **p ≤ 0.01 and ***p ≤ 0.001 as assessed by ONE-way ANOVA followed by Dunnett’s multiple comparisons. (F-L) Gene expressions of TGF-β (F), IL-1β (G), IL-6 (H), TNF-α (I), IL-17A (J), IL-17RC (K), and RORγT (L) were evaluated by RT-qPCR in naive macrophages, alone (control), treated with LPS and pretreated with AM9053 + LPS. Results are calculated using the 2-ΔCt formula. Data are presented as means ± SEM of n = 5-6 independent experiments obtained from 5 to 6 mice. *p ≤ 0.05, **p ≤ 0.01, and ***p ≤ 0.001 as assessed by 1-way ANOVA followed by Dunnett’s multiple comparisons. (M) pSTAT3(Y705) protein expression by western blot analysis in naive macrophages, alone (control), treated with LPS and pretreated with AM9053 + LPS and normalized on total STAT3 and/or tubulin. Representative immunoblots are reported on top of the graph. Data are presented as means ± SEM of n = 6-7 independent samples. *p ≤ 0.05 and **p ≤ 0.01 as assessed by ONE-way ANOVA followed by Dunnett’s multiple comparisons.
Figure 7
Figure 7
Effect of N-acylethanolamine acid amidase (NAAA) inhibition in lamina propria CX3CR1+ cells. (A) Representative examples of flow cytometry analysis of mouse lamina propria CD64+CD11cCX3CR1+ macrophages and P1-P4 subpopulations according to the expression of MHCII and Ly6c markers in 2,4,6-trinitrobenzensulfonic acid (TNBS)-treated mice (upper panel) and TNBS-treated mice with NAAA inhibitor AM9053 (lower panel). (B) Quantification in terms of frequency of P1-P4 subpopulations among CD64+CD11cCX3CR1int (P1, P2, and P3) and CD64+CD11cCX3CR1hi (P4) macrophages in TNBS-treated mice and TNBS-treated mice with NAAA inhibitor AM9053. Data are presented as means ± SEM of n = 3 independent samples. *p ≤ 0.05 as assessed by 2-way analysis of variance (ANOVA) followed by Sidak’s multiple comparisons post hoc tests. (C) Representative examples of flow cytometry analysis of mouse lamina propria CX3CR1+ macrophages subpopulations (CX3CR1int and CX3CR1hi) and their respective expression of IL-23 in control mice (upper panel), TNBS-treated mice (middle panel), and TNBS-treated mice with NAAA inhibitor AM9053 (lower panel). (D) Quantification in terms of frequency of IL-23 in CX3CR1int and CX3CR1hi+ macrophages subpopulations in control mice, TNBS-treated mice, and TNBS-treated mice with NAAA inhibitor AM9053. Data are presented as means ± SEM of n = 3 independent samples. **p ≤ 0.01 and***p ≤ 0.001 as assessed by 1-way ANOVA followed by Dunnett’s multiple comparisons.

References

    1. Wang J, Lin S, Brown JM, van Wagoner D, Fiocchi C, Rieder F. Novel mechanisms and clinical trial endpoints in intestinal fibrosis. Immunol Rev 2021;302:211–27. - PMC - PubMed
    1. Speca S, Giusti I, Rieder F, Latella G. Cellular and molecular mechanisms of intestinal fibrosis. World J Gastroenterol 2012;18:3635–61. - PMC - PubMed
    1. Alfredsson J, Wick MJ. Mechanism of fibrosis and stricture formation in Crohn’s disease. Scand J Immunol 2020;92:e12990. - PMC - PubMed
    1. Costa C, Sampaio-Maia B, Araujo R, et al.. Gut microbiome and organ fibrosis. Nutrients 2022;14:352. - PMC - PubMed
    1. Rieder F, Fiocchi C, Rogler G. Mechanisms, management, and treatment of fibrosis in patients with inflammatory bowel diseases. Gastroenterology 2017;152:340–50.e6. - PMC - PubMed

MeSH terms