. 2025 Feb;21(2):352-373.
doi: 10.1080/15548627.2024.2395797. Epub 2024 Sep 10.

Impaired degradation of PLCG1 by chaperone-mediated autophagy promotes cellular senescence and intervertebral disc degeneration

Affiliations

Impaired degradation of PLCG1 by chaperone-mediated autophagy promotes cellular senescence and intervertebral disc degeneration

Zhangrong Cheng et al. Autophagy. 2025 Feb.

Abstract

Defects in chaperone-mediated autophagy (CMA) are associated with cellular senescence, but the mechanism remains poorly understood. Here, we found that CMA inhibition induced cellular senescence in a calcium-dependent manner and identified its role in TNF-induced senescence of nucleus pulposus cells (NPC) and intervertebral disc degeneration. Based on structural and functional proteomic screens, PLCG1 (phospholipase C gamma 1) was predicted as a potential substrate for CMA deficiency to affect calcium homeostasis. We further confirmed that PLCG1 was a key mediator of CMA in the regulation of intracellular calcium flux. Aberrant accumulation of PLCG1 caused by CMA blockage resulted in calcium overload, thereby inducing NPC senescence. Immunoassays on human specimens showed that reduced LAMP2A, the rate-limiting protein of CMA, or increased PLCG1 was associated with disc senescence, and the TNF-induced disc degeneration in rats was inhibited by overexpression of Lamp2a or knockdown of Plcg1. Because CMA dysregulation, calcium overload, and cellular senescence are common features of disc degeneration and other age-related degenerative diseases, the discovery of actionable molecular targets that can link these perturbations may have therapeutic value.Abbreviation: ATRA: all-trans-retinoic acid; BrdU: bromodeoxyuridine; CDKN1A/p21: cyclin dependent kinase inhibitor 1A; CDKN2A/p16-INK4A: cyclin dependent kinase inhibitor 2A; CMA: chaperone-mediated autophagy; DHI: disc height index; ER: endoplasmic reticulum; IP: immunoprecipitation; IP3: inositol 1,4,5-trisphosphate; ITPR/IP3R: inositol 1,4,5-trisphosphate receptor; IVD: intervertebral disc; IVDD: intervertebral disc degeneration; KD: knockdown; KO: knockout; Leu: leupeptin; MRI: magnetic resonance imaging; MS: mass spectrometry; N/L: NH4Cl and leupeptin; NP: nucleus pulposus; NPC: nucleus pulposus cells; PI: protease inhibitors; PLC: phospholipase C; PLCG1: phospholipase C gamma 1; ROS: reactive oxygen species; RT-qPCR: real-time quantitative reverse transcription PCR; SA-GLB1/β-gal: senescence-associated galactosidase beta 1; SASP: senescence-associated secretory phenotype; STV: starvation; TMT: tandem mass tag; TNF: tumor necrosis factor; TP53: tumor protein p53; UPS: ubiquitin-proteasome system.

Keywords: Calcium overload; chaperone-mediated autophagy; intervertebral disc degeneration; nucleus pulposus; senescence.


Conflict of interest statement

No potential conflict of interest was reported by the author(s).

Figures
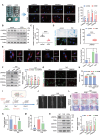
Figure 1.
Figure 1.
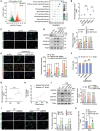
CMA attenuates TNF-induced cellular senescence and IVDD. (A) tissue immunofluorescence showing differential expression of LAMP2A, TP53, CDKN1A, and CDKN2A in healthy and degenerated human intervertebral discs. Three tissue samples each from healthy and degenerated discs were used to stain the corresponding senescence indicators. For each indicator, the average cell fluorescence intensity in at least three fields of view was selected for quantification. (B) immunoblot showing the levels of LAMP2A, TP53, CDKN1A, and CDKN2A in healthy and degenerated human intervertebral discs. Three specimens were used for testing in each group. (C) three normal and degenerated human disc tissue samples were collected to measure LAMP2A mRNA levels. (D) fluorescence levels of LAMP2A and SA-GLB1 in NPC after treatment with TNF (20 ng/mL) for 48 h. The average cell fluorescence intensity of at least 3 fields was used for quantification. (E) CMA reporter KFERQ-PA-mCherry1 was used to visualize CMA activity in NPC under TNF (20 ng/mL, 48 h), serum (24 h), or AR7 (25 μg/mL, 24 h) treatment. The average number of intracellular red puncta in at least 3 fields of view per group was calculated to reflect CMA activity. (F) immunoblot showing levels of senescence-associated proteins (TP53, CDKN1A, and CDKN2A) in NPC after TNF alone treatment (20 ng/mL, 48 h) or combined with LAMP2A overexpression. The right panel represents the quantification of each group normalized to NC. (G) immunofluorescence showing the levels of SA-GLB1 and TP53 in NPC after TNF alone treatment (20 ng/mL, 48 h) or combined with LAMP2A overexpression. Quantification of the mean cellular fluorescence intensity of at least 3 fields is provided in (fig. S1C). (H) flow cytometry results of the cell cycle. The proportion of cells in S phase was used for comparison between groups. (I) in vivo modeling method of IVDD. The SD rats used were male and 2 months old. Local injection of lentivirus (1×10⁸ TU/mL, 2 μL) was performed on the first day, and TNF injection (20 ng/mL, 2 μL) was performed on the third day. Injections were repeated weekly for one month and maintained for another month, followed by physical examination, imaging, and sampling at week 8. (J) MRI of the indicated disc segment in the rat tail after injection of TNF or combined with LAMP2A lentivirus. The administration concentration and dosage are as described above. (K) the disc height index (DHI; mm) was used for quantification of MRI results of each group after local injections. The DHI is inversely related to the degree of IVDD. (L) histological staining of indicated rat discs after treatments, including H&E, safranin O-fast green staining, and Masson staining. (M) histological scores of IVDD in rats. Higher scores (0-15) represent more severe degeneration. The scoring criteria is as described before [28]. (N) Western blot showing protein levels of LAMP2A, TP53, CDKN1A, and CDKN2A in NPC treated with DMSO, TNF (20 ng/mL, 48 h), or ATRA (10 μM, 48 h). All figures show mean ± SEM of at least three independent experiments. */#p < 0.05, **/##p < 0.01, ***/###p < 0.001, ns means not significant. The p-value symbols represent comparisons to the left group of the labeled line (A, C, D, E, H, and N) or to the vector+tnf group (F, L, and M).
Figure 2.
Figure 2.
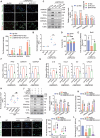
CMA deficiency promotes calcium overload-induced cellular senescence. (A) RNA sequencing analysis of NPC treated with or without the CMA inhibitor ATRA (10 μM, 48 h). KEGG pathway analysis of the differential genes shown in the volcano plot suggested that the calcium signaling pathway was significantly enriched. (B) levels of Ca2+ flux in NPC treated with LAMP2A-KO or ATRA (10 μM, 48 h). Values in each group were normalized to that of the NC group for comparison. (C) immunofluorescence showing levels of Ca2+ and SA-GLB1 after LAMP2A-KO, and Ca2+ was visualized by fluorescent probe fluo-4 AM. The average cellular fluorescence intensity of at least 3 fields of view was selected for quantification. (D) immunoblot showing protein levels of LAMP2A, TP53, CDKN1A, and CDKN2A in LAMP2A-KO NPC treated with or without BAPTA-AM (5 μM, 24 h). TNF-treated NPC (20 ng/mL, 48 h) served as the positive control. The right panel shows the normalized quantification of the band of interest. (E) immunofluorescence showing Ca2+, TP53, and CDKN2A levels in LAMP2A-KO NPC treated with or without BAPTA-AM (5 μM, 24 h). The right panel represents quantification of the mean fluorescence intensity of cells in each group derived from at least 3 fields of view. (F) flow cytometry results of cell cycle of NPC treated with LAMP2A-KO or combined with DMSO or BAPTA-AM (5 μM, 24 h). The proportion of cells in S phase was used for comparison between the indicated groups. (G) levels of Ca2+ flux in tnf-treated NPC (20 ng/mL, 48 h) detected by fura-2, normalized to the value of the NC group. (H) Ca2+ levels and CMA activity were assessed at 24 h, 36 h, and 48 h after TNF treatment (20 ng/mL). NPC were transfected with the KFERQ-PA-mCherry-1 plasmid and then photoconverted to monitor the activity of CMA. The fold change (/control) of visualized puncta number of each group represents the relative CMA level. The fluo-4 AM fluorescent probe was used to detect Ca2+ levels. Representative images for statistics are provided in (fig. S2B). Mean fluorescence intensities were used for quantification, normalized to the control group. (I) Ca2+ and SA-GLB1 fluorescence images of NPC treated with TNF (20 ng/mL, 48 h) or combined with LAMP2A overexpression. The right panel represents the quantification of mean cell fluorescence intensity for each group. At least 3 fields of view were used for quantitative assessment. (J) Western blot of LAMP2A and senescence markers (TP53, CDKN1A, and CDKN2A) of NPC treated with TNF (20 ng/mL, 48 h) or combined with LAMP2A overexpression or BAPTA-AM (5 μM, 24 h). The right panel represents normalized quantification of band intensities of interest. (K) BrdU levels of NPC treated with TNF in the presence or absence of BAPTA-AM, detected at 450 nm, normalized to that of the control group. The cells were administered as described above. All data show mean ± SEM of at least three independent experiments. */#p < 0.05, **/##p < 0.01, ***/###p < 0.001, ns means not significant. p-value symbols represent comparisons to the left group of the labeled line (B, F, G, I, and J) or to the LAMP2A-KO+DMSO group (D and E) or to the DMSO+TNF group (K).
Figure 3.
Figure 3.
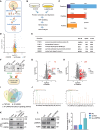
PLCG1 is screened as a putative substrate of CMA. (A) schematic representation of the mechanisms underlying calcium overload-induced cellular senescence in the context of CMA failure. (B) schematic diagram of collecting protein supernatants from LAMP2A-KO NPC for TMT labeling and MS detection. (C) statistical results of protein and peptide identification and quantification by TMT-MS. (D) volcano plot showing all differential proteins in MS results after LAMP2A-KO. (E) validation of the LAMP2A level in TMT-MS results, and fold change of several known CMA substrates, including IDH2, ACSL4, and NFKB2. (F) schematic diagram of MS-based immunoprecipitation proteomics analysis. Immunoprecipitates of the bait proteins LAMP2A and HSPA8 were first isolated by magnetic beads and then the interactors were detected by MS. (G and H) volcano plot analysis of the IP-MS results showed that several interacting proteins were significantly enriched in the immunoprecipitates of HSPA8 and LAMP2A. (I) venn diagram of proteins overlapping between upregulated proteins by TMT-MS, interacting proteins pulled by bait proteins HSPA8 and LAMP2A, and gene sets of calcium signaling pathway. PLCG1 was screened as a putative CMA substrate in regulating calcium homeostasis. (J) secondary spectrum of PLCG1 in IP-MS results. (K) Co-immunoprecipitation blot confirming endogenous interactions of PLCG1 with HSPA8 and LAMP2A in NPC. (L) immunoblot showing PLCG1 levels in NPC after LAMP2A-KO. The right panel shows the PLCG1 levels of each group, normalized to the value of the NC group. All data show mean ± SEM of at least three independent experiments. */#p < 0.05, **/##p < 0.01, ***/###p < 0.001, ns means not significant. p-value symbols represent comparisons to the sg-Scb group (L).
Figure 4.
Figure 4.
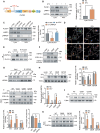
PLCG1 is regulated by CMA, but not macroautophagy or the UPS. (A) immunoblotting showing the level of PLCG1 in NPC after treatment with Leu (10 μM), NH4Cl (20 mM), or their combination for 12 h. Right panels represent normalized (/NC) band intensities of interest. (B) Western blot showing PLCG1 levels in NPC treated with a combination of Leu and NH4Cl (N/L) for 3, 6, and 9 h. Right panels represent normalized (/NC) band intensities of interest. (C) immunoblot of PLCG1 in NPC treated with different concentrations (2, 5, and 10 μM) of MG132 for 12 h. Ubiquitin was used as the positive control. The right panel shows relative levels of PLCG1 of each group, normalized to NC group. (D) immunofluorescence showing colocalization of PLCG1 with lysosomes. LAMP1 is used as a lysosomal marker. (E) RT-qPCR showing mRNA levels of PLCG1 after LAMP2A-KO, normalized to the sg-Scb group. (F) immunoblot showing the expression levels of PLCG1 in LAMP2A-KO NPC treated with MG132 or N/L for 12 h. The right panel represents normalized (/DMSO) band intensities of interest. (G) the levels of PLCG1 in NPC under LAMP2A overexpression or combined with N/L treatment. The right panel shows relative levels of PLCG1 of each group, normalized to the vector group. (H) immunoblotting showing PLCG1 and SQSTM1 levels in NPC after ATG7 knockdown using si-ATG7. The relative level of PLCG1 of each group was normalized to that of si-Scb group. (I) Western blot showing PLCG1 levels after 3 MA treatment (5 mM) for 3, 6, and 9 h. The right panel shows relative levels of PLCG1 of each group, normalized to the NC group. (J) Western blot showing the levels of PLCG1 in NPC after serum starvation (STV) for 24 h and 48 h. The right panel shows normalized PLCG1 levels of each group. (K) effect of STV treatment or combined with LAMP2A-KO on the expression of PLCG1. The relative levels of PLCG1 of each group were normalized to that of the NC group. (L) PLCG1 levels in NPC treated with different concentrations of AR7 (10, 25, 50, and 100 μM) for 24 h. The right panel shows normalized PLCG1 levels of each group (/NC). (M) lysosomal uptake assay. After co-incubation with lysosomes from HEK293T cells in the presence or absence of protease inhibitor (PI), PLCG1-GST was taken up and degraded by lysosomes. A lane with empty lysosomes was used as control, and substrate without lysosomes (20 ng) was used as input. LAMP1 was used to demonstrate equal lysosomal loading. The right panel shows normalized PLCG1 levels of each group. All figures show mean ± SEM of at least three independent experiments. */#p < 0.05, **/##p < 0.01, ***/###p < 0.001, ns means not significant. p-value symbols represent comparisons to the left group of the labeled line (A, B, C, E, F, H, I, J, K, L, and M) or to the LAMP2A group (G).
Figure 5.
Figure 5.
PLCG1 is a bona fide substrate of CMA. (A) graphical representation of KFERQ-like motifs in the human PLCG1 sequence. (B) immunoblot of PLCG1 in lysosomes (lyso) of control (NC) or STV (serum starvation for 24 h) NPC. LAMP1 was used as an internal reference, and GAPDH was used as a positive control. The right panel represents PLCG1 levels in lysosomes, normalized to the NC group. (C) levels of PLCG1 in lysosomes of NPC after transfection of si-LAMP2A or si-ATG7. LAMP1 was used to demonstrate equal lysosomal loading. The right panel represents relative PLCG1 levels in lysosomes, normalized to the si-Scb group. (D) immunofluorescence imaging showing colocalization of PLCG1 with HSPA8 or LAMP2A in NPC treated with or without STV (24 h). The quantitative analysis of colocalization was assessed using ImageJ-colocalization Finder, and the mean Pearson correlation index is as indicated. (E) LAMP2A levels detected in immunoprecipitates of PLCG1 from NPC treated with STV (24 h) or not. (F) immunoblot of HSPA8 that bound with PLCG1-HA in NPC transfected as indicated. (G) levels of PLCG1-HA in immunoprecipitates of HSPA8 in NPC transfected with WT PLCG1, PLCG1Q52R, or PLCG1Q272R plasmids. (H) effect of STV on PLCG1-HA levels in NPC transfected as indicated. The right panel represents relative levels of PLCG1-HA normalized to the NC group. (I) NPC transfected as indicated were treated with STV or not, followed by immunoprecipitation of HA and immunoblot detection of LAMP2A. The right panel represents the relative levels of LAMP2A, normalized to the WT-NC group. (J) NPC transfected as indicated were treated with or without N/L for 12 h, and the PLCG1-HA levels in each group were detected by immunoblotting. PLCG1-HA levels in each group were normalized to the WT-NC group for comparison. Fold changes of PLCG1-HA levels in each group after N/L treatment are shown in the lower left panels. (K) effect of Q52R and Q272R mutations on the association between PLCG1 and lysosomes. Lysates of transfected NPC as indicated were incubated with lysosomes purified from HEK293T cells. Levels of PLCG1-HA in recovered lysosomes were determined using immunoblot in the presence or absence of PI. The right panel shows relative levels of PLCG1-HA normalized to the NC group. All figures show mean ± SEM of at least three independent experiments. */#p < 0.05, **/##p < 0.01, ***/###p < 0.001, ns means not significant. p-value symbols represent comparisons to the left group of the labeled line (B, C, H, I, J, and K).
Figure 6.
Figure 6.
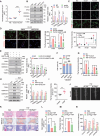
PLCG1 induces cellular senescence in a calcium-dependent manner. (A) the effect of PLCG1 overexpression on the Ca2+ level in NPC. The values of each group were normalized to the NC group for comparison. (B) immunoblotting showing the levels of PLCG1, TP53, CDKN1A, CDKN2A, and IL1B in NPC after PLCG1 overexpression. The TNF treatment (20 ng/mL, 48 h) group was used as a positive control. The right panel represents relative levels of PLCG1 in each group. (C) immunofluorescence showing levels of Ca2+, TP53, and SA-GLB1 after PLCG1 overexpression. The lower panel shows the mean cell fluorescence intensity for each group. At least 3 fields of view in each group were used for quantitative evaluation. (D) immunofluorescence showing CDKN2A and TP53 levels in NPC after PLCG1 overexpression or combined with BAPTA-AM treatment (5 μM, 24 h). The right panel represents the average fluorescence intensity from at least 3 fields for each group. (E) immunoblot showing the levels of TP53, CDKN1A, CDKN2A, and IL1B in NPC treated as indicated. The right panel represents the relative levels of TP53, CDKN1A, CDKN2A, and IL1B in each group, normalized to the NC group. (F) flow cytometry results of the cell cycle of NPC treated as indicated. The proportion of cells in S phase was used for comparison. (G) levels of Ca2+ and SA-GLB1 in NPC treated as indicated, quantified by the mean fluorescence intensity. Representative fluorescence images are provided in (fig. S4E). (H) immunoblotting showing the levels of PLCG1, TP53, CDKN1A, CDKN2A, and IL1B in NPC treated as indicated. The cell administration method is as described above. The right panel represents relative band intensities of interest, normalized to the NC group. (I) quantification of the mean cellular fluorescence intensity of PLCG1 in paraffin sections from normal or degenerated human disc specimens. Representative fluorescence images are provided in (fig. S5A). (J) MRI of the indicated rat tail discs after injection of TNF (20 ng/mL, 2 μL) or combined with sh-Plcg1 lentivirus (1×10⁸ TU/mL, 2 μL). The SD rats used were male and 2 months old, and the treatment methods were consistent with (fig. 1I). (K) histological staining of the indicated rat discs injected with TNF or combined with sh-Plcg1 lentivirus, including H&E, Safranin O-fast green, and Masson staining. (L) the intervertebral disc height index (DHI, mm) of the treated disc segments. DHI is negatively correlated with the degree of degeneration. (M) histological scoring of treated rat intervertebral discs. The score (0–15) is positively correlated with the degree of disc degeneration [39]. (N) quantitative results of the average cellular fluorescence intensity of PLCG1, TP53, CDKN1A, and CDKN2A in paraffin sections of rat intervertebral discs of each group. Representative fluorescence images were provided in (fig. S5D). All figures show mean ± SEM of at least three independent experiments. */#p < 0.05, **/##p < 0.01, ***/###p < 0.001, ns means not significant. p-value symbols represent comparisons to the left group of the labeled line (A, B, C, F, H, I, and N) or to the PLCG1+DMSO group (D and E) or to the TNF+si-scb group (G) or to the sh-Scb+TNF group (L and M).
Figure 7.
Figure 7.
Abnormal accumulation of PLCG1 mediates CMA deficiency-induced cellular senescence. (A) fluorescence levels of Ca2+, SA-GLB1, and TP53 in NPC treated with LAMP2A-KO or combined with PLCG1-KD. The Ca2+ levels were visualized by fluo-4 AM probe and quantified by the mean fluorescence intensity. The lower panel represents the mean fluorescence intensity of each group. At least 3 fields of view were used for quantitative assessment. (B) Ca2+ levels in NPC treated with LAMP2A-KO or combined with PLCG1-KD, measured by fura-2. Values of each group were normalized to that of the NC group. (C) immunoblotting showing the levels of TP53, CDKN1A, CDKN2A, and IL1B in NPC treated as indicated. Right panel represents between-group comparisons of band of interest, normalized to the sg-Scb group. (D) flow cytometry results of the cell cycle of NPC treated as indicated. The cell proportion in S phase was used for comparison between the indicated groups. (E) absorbance of BrdU measured at 450 nm in NPC treated with LAMP2A-KO or combined with si-PLCG1, normalized to the value of sg-Scb group. (F and G) rt-qPCR results showing the mRNA levels of TP53, CDKN1A, CDKN2A, IL1B, CCL3, IL6, and CXCL8 of NPC treated as indicated. (H) Ca2+ levels of NPC treated with TNF (20 ng/mL, 48 h) or combined with vector, LAMP2A, and LAMP2A+PLCG1 overexpression. The Ca2+ levels were measured by fura-2 at 340/510 nm. (I) fluorescence of Ca2+ and SA-GLB1 in NPC treated as indicated, the right panel represents the mean fluorescence intensity of each group. At least 3 fields of view were used for quantitative assessment. (J) immunoblotting showing the levels of TP53, CDKN1A, CDKN2A, and IL1B in NPC treated as indicated, and the relative band intensity of each group was normalized to that of the NC group. (K) the mean fluorescence intensity of TP53, CDKN1A, and CDKN2A in NPC treated as indicated. Representative fluorescence images are presented in (fig. S5J). (L) normalized BrdU levels measured at 450 nm from NPC treated as indicated. All figures show mean ± SEM of at least three independent experiments. */#p <0.05, **/##p <0.01, ***/###p <0.001, ns means not significant. p-value symbols represent comparisons to the left group of the labeled line (A, C, D, and H) or to the LAMP2A-KO+si-Scb group (B, E, F, and G) or to the TNF+LAMP2A group (I, J, K, and L).
Figure 8.
Figure 8.
Schematic representation of the mechanisms by which CMA inhibition mediates NPC senescence and IVDD. Active CMA contributes to the maintenance of Ca2+ homeostasis in NPC. In CMA-inactive NPC, PLCG1 degradation is blocked, which continuously promotes cytoplasmic Ca2+ flux and Ca2+ overload, thereby inducing premature NPC senescence and IVDD progression.

References

    1. Di Micco R, Krizhanovsky V, Baker D, et al. Cellular senescence in ageing: from mechanisms to therapeutic opportunities. Nat Rev Mol Cell Biol. 2021;22(2):75–95. doi: 10.1038/s41580-020-00314-w - DOI - PMC - PubMed
    1. Kuilman T, Michaloglou C, Mooi WJ, et al. The essence of senescence: figure 1. Genes Dev. 2010;24(22):2463–2479. doi: 10.1101/gad.1971610 - DOI - PMC - PubMed
    1. Chaib S, Tchkonia T, Kirkland JL.. Cellular senescence and senolytics: the path to the clinic. Nat Med. 2022;28(8):1556–1568. doi: 10.1038/s41591-022-01923-y - DOI - PMC - PubMed
    1. Huang W, Hickson LJ, Eirin A, et al. Cellular senescence: the good, the bad and the unknown. Nat Rev Nephrol. 2022;18(10):611–627. doi: 10.1038/s41581-022-00601-z - DOI - PMC - PubMed
    1. Ziegler DV, Vindrieux D, Goehrig D, et al. Calcium channel ITPR2 and mitochondria–ER contacts promote cellular senescence and aging. Nat Commun. 2021;12(1):720. doi: 10.1038/s41467-021-20993-z - DOI - PMC - PubMed

Publication types

MeSH terms