. 2024 Aug 30:14:04172.
doi: 10.7189/jogh.14.04172.

Global prevalence and disability-adjusted life years of hypertensive heart disease: A trend analysis from the Global Burden of Disease Study 2019

Affiliations

Global prevalence and disability-adjusted life years of hypertensive heart disease: A trend analysis from the Global Burden of Disease Study 2019

An-Bang Liu et al. J Glob Health. .

Abstract

Background: As hypertensive heart disease (HHD) presents a significant public health challenge globally, we analysed its global, regional, and national burdens and trends from 1990 to 2019.

Methods: We used data from the Global Burden of Disease (GBD) 2019 study, focussing on the age-standardised prevalence rates (ASPRs) of HHD prevalence, age-standardised disability-adjusted life year (DALY) rates, average annual percentage change (AAPC), and risk factor attributions. We compared the HHD burden across sociodemographic index (SDI) strata, gender, age groups, and 204 countries and territories.

Results: In 2019, the global prevalence of HHD was estimated at 18 598 thousand cases, with DALYs reaching 21 508 thousand. From 1990 to 2019, the ASPRs increased (AAPC = 0.21; 95% confidence interval (CI) = 0.17, 0.24), while the age-standardised DALY rates decreased (AAPC = -0.45; 95% CI = -1.23, -0.93). We observed the highest increase in ASPRs in high-middle SDI quantile countries, and an overall negative correlation between age-standardised DALY rates and SDI. Individuals above 70 years of age were the most affected, particularly elderly women. There has been a significant increase in HHD burden attributed to high body mass index (BMI) since 1990. The burden of HHD is concentrated in the middle SDI quintile, with population ageing and growth being major drivers for the increase in DALYs. We identified opportunities for reducing age-standardised DALY rates in the middle SDI quintile or lower.

Conclusion: Despite a declining trend in the age-standardised DALY rates, the ASPRs of HHD continue to rise, especially in high-middle SDI regions. Meanwhile, countries in middle and lower SDI quintiles face a higher burden of age-standardised DALY rates. Targeted attention towards elderly women and controlling high BMI, alongside enhancing hypertension and HHD management awareness, is crucial for reducing the global burden of HHD.


Conflict of interest statement

Disclosure of interest: The authors completed the ICMJE Disclosure of Interest Form (available upon request from the corresponding author) and disclose no relevant interests.

Figures
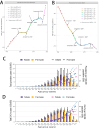
Figure 1
Figure 1
Global changes in age-standardised rates of HHD from 1990 to 2019. Panel A. Global changes of ASPRs. Panel B. Global changes of age-standardised DALY rates. Panel C. Age-specific cases and rates of prevalence of HHD by sex in 2019. Panel D. Age-specific cases and rates of DALYs. DALY – disability-adjusted life year.
Figure 2
Figure 2
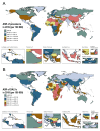
Age-standardised rates of HHD for both sexes in 204 countries and territories, 2019. Panel A. Age-standardised prevalence. Panel B. Age-standardised DALYs. DALY – disability-adjusted life year.
Figure 3
Figure 3
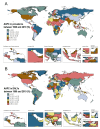
AAPC of age-standardised rates of HHD for both sexes in 204 countries and territories from 1990 to 2019. Panel A. AAPC of age-standardised prevalence. Panel B. AAPC of age-standardised DALYs. DALY – disability-adjusted life year.
Figure 4
Figure 4
Changes in HHD DALYs of both sexes, women, and men according to population-level determinants of ageing, population growth, and epidemiological change from 1990 to 2019 at the global level and by SDI quintile. The black dot represents the overall value of change contributed by all three components. For each component, the magnitude of a positive value indicates a corresponding increase in HHD DALYs attributed to the component; the magnitude of a negative value indicates a corresponding decrease in HHD DALYs attributed to the related component. DALY – disability-adjusted life year, SDI – sociodemographic index.
Figure 5
Figure 5
Frontier analysis of HHD in 2019 based on SDI and age-standardised DALY rate per 100 000 population. The frontier line portrayed in black, representing the potentially achievable age-standardized DALY rate based on SDI. The ‘effective difference’, or the gap between the observed points and potentially realisable age-standardised DALY rates, is measured from this black borderline. Red dots indicate a decrease in age-standardised HHD DALY rate from 1990 to 2019, while green dots indicate increase in age-standardised HHD DALY rate from 1990 to 2019. The top 15 countries with the largest effective difference (largest HHD DALYs gap from the frontier) are labelled in black. Countries and territories with low SDI (<0.5) of the top five with the lowest effective difference are labelled in blue (Niger, Nepal, Bhutan, Bangladesh, and Honduras). Countries and territories with high SDI (>0.85) of the top five with the highest effective difference are labelled in red (Taiwan (province of China), Singapore, USA, Kuwait, and United Arab Emirates).

References

    1. Forouzanfar MH, Liu P, Roth GA, Ng M, Biryukov S, Marczak L, et al. Global Burden of Hypertension and Systolic Blood Pressure of at Least 110 to 115 mm Hg, 1990-2015. JAMA. 2017;317:165–82. 10.1001/jama.2016.19043 - DOI - PubMed
    1. GBD 2016 Risk Factors Collaborators Global, regional, and national comparative risk assessment of 84 behavioural, environmental and occupational, and metabolic risks or clusters of risks, 1990-2016: a systematic analysis for the Global Burden of Disease Study 2016. Lancet. 2017;390:1345–422. 10.1016/S0140-6736(17)32366-8 - DOI - PMC - PubMed
    1. Mills KT, Bundy JD, Kelly TN, Reed JE, Kearney PM, Reynolds K, et al. Global Disparities of Hypertension Prevalence and Control: A Systematic Analysis of Population-Based Studies From 90 Countries. Circulation. 2016;134:441–50. 10.1161/CIRCULATIONAHA.115.018912 - DOI - PMC - PubMed
    1. Wang C, Yuan Y, Zheng M, Pan A, Wang M, Zhao M, et al. Association of Age of Onset of Hypertension With Cardiovascular Diseases and Mortality. J Am Coll Cardiol. 2020;75:2921–30. 10.1016/j.jacc.2020.04.038 - DOI - PubMed
    1. Westaby JD, Miles C, Chis Ster I, Cooper STE, Antonios TF, Meijles D, et al. Characterisation of hypertensive heart disease: pathological insights from a sudden cardiac death cohort to inform clinical practice. J Hum Hypertens. 2022;36:246–53. 10.1038/s41371-021-00507-6 - DOI - PubMed