Noninvasive Disease Assessment in Eosinophilic Esophagitis With Fractionated Exhaled Nitric Oxide, Blood, and Fecal Biomarkers
- PMID: 39212998
- PMCID: PMC12329813
- DOI: 10.1097/MCG.0000000000002068
Noninvasive Disease Assessment in Eosinophilic Esophagitis With Fractionated Exhaled Nitric Oxide, Blood, and Fecal Biomarkers
Abstract
Background: Eosinophilic Esophagitis (EoE) is a chronic inflammatory condition of the esophagus triggered by food and aeroallergens. There is a need for noninvasive biomarkers that reliably detect EoE in patients with cardinal symptoms and predict treatment response to reduce endoscopic evaluations.
Study: Nonasthmatic patients 18 years or above with suspected or diagnosed EoE, gastroesophageal reflux disease (GERD), and control individuals with indication for endoscopy were enrolled prospectively between November 2020 and May 2022. Participants underwent body plethysmography with fractionated exhaled nitric oxide (FeNO) level measurement. Besides, serum and fecal biomarkers were measured by ELISA. A follow-up examination was scheduled after treatment initiation in patients with active EoE.
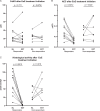
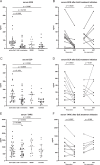
Results: The median FeNO level in active EoE (20 ppb) was higher compared with GERD (15 ppb, P =0.038) and control individuals (14 ppb, P =0.046). Median FeNO did not significantly differ in EoE patients who underwent follow-up assessment after treatment response (20 ppb vs. 18 ppb, P =0.771). Serum EDN, ECP, and the absolute eosinophil blood count (AEC) were elevated in active EoE compared with control individuals but not compared with GERD except for AEC. Serum EDN, ECP and AEC decreased in EoE in remission at follow-up assessment. None of the fecal biomarkers was elevated in active EoE or during treatment.
Conclusions: Assessment of FeNO may have diagnostic value in differentiating patients with active EoE from non-EoE patients but is not a suitable marker for monitoring disease activity. Serum EDN, ECP, TARC, and AEC levels are emerging as potential candidates for monitoring disease activity in EoE.
Keywords: ECP; EDN; FeNO; biomarker; eosinophilic esophagitis.
Copyright © 2024 The Author(s). Published by Wolters Kluwer Health, Inc.
Conflict of interest statement
The authors declare that they have nothing to disclose.
Figures


References
-
- Straumann A, Katzka DA. Diagnosis and treatment of eosinophilic esophagitis. Gastroenterology. 2018;154:346–359. - PubMed
-
- Attwood SE, Smyrk TC, Demeester TR, et al. Esophageal eosinophilia with dysphagia. A distinct clinicopathologic syndrome. Dig Dis Sci. 1993;38:109–116. - PubMed
-
- Hruz P, Straumann A, Bussmann C, et al. Escalating incidence of eosinophilic esophagitis: a 20-year prospective, population-based study in Olten County, Switzerland. J Allergy Clin Immunol. 2011;128:1349–1350.e5. - PubMed
MeSH terms
Substances
LinkOut - more resources
Full Text Sources
Medical

