. 2024 Aug 30:13:RP96992.
doi: 10.7554/eLife.96992.

Inhibition of ULK1/2 and KRASG12C controls tumor growth in preclinical models of lung cancer

Affiliations

Inhibition of ULK1/2 and KRASG12C controls tumor growth in preclinical models of lung cancer

Phaedra C Ghazi et al. Elife. .

Abstract

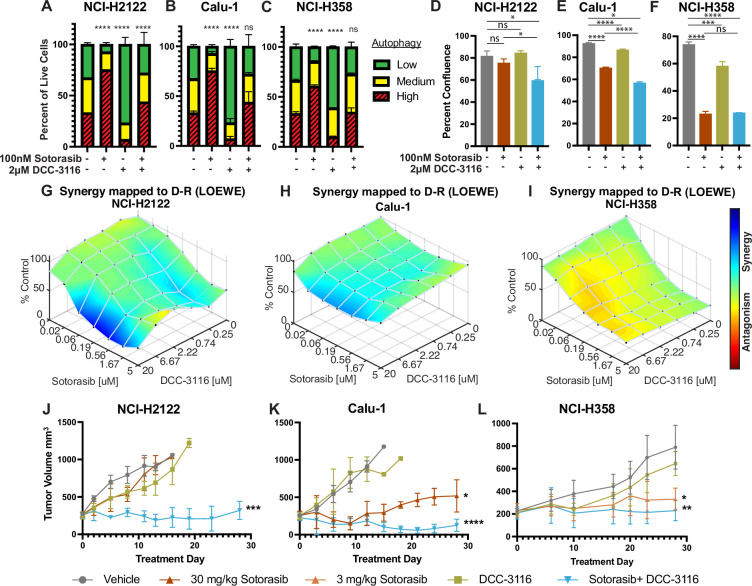
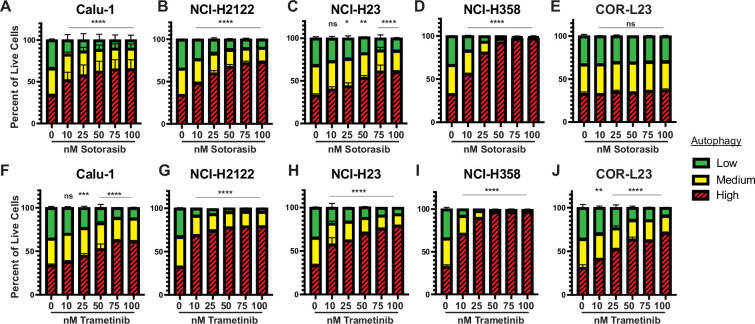
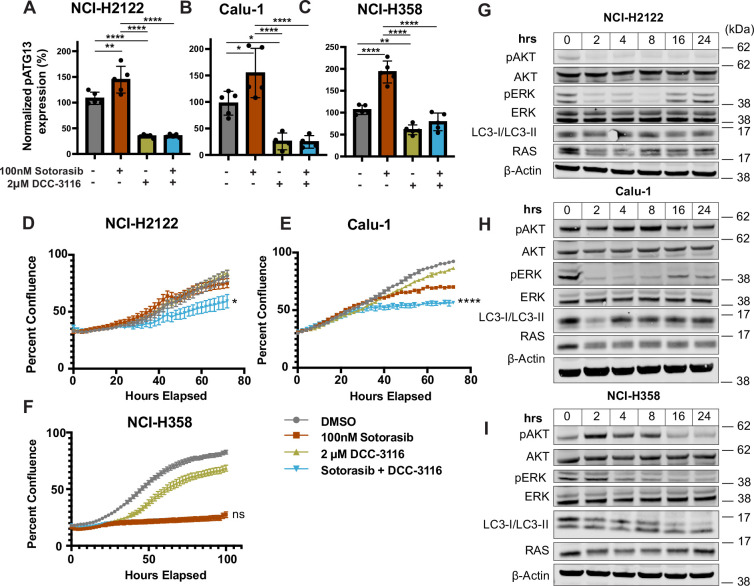
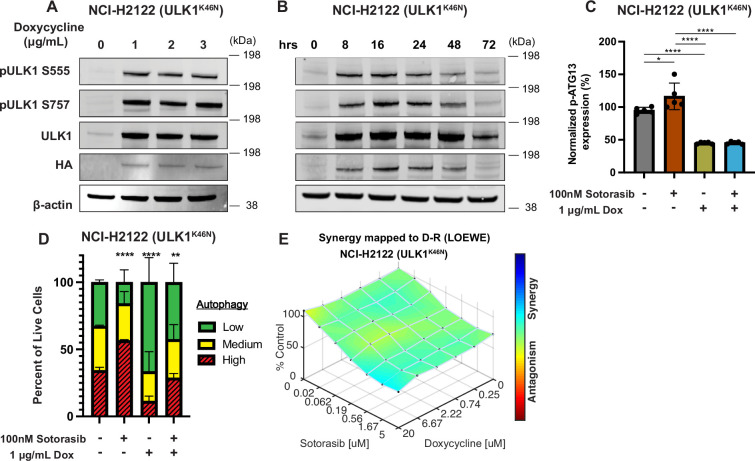
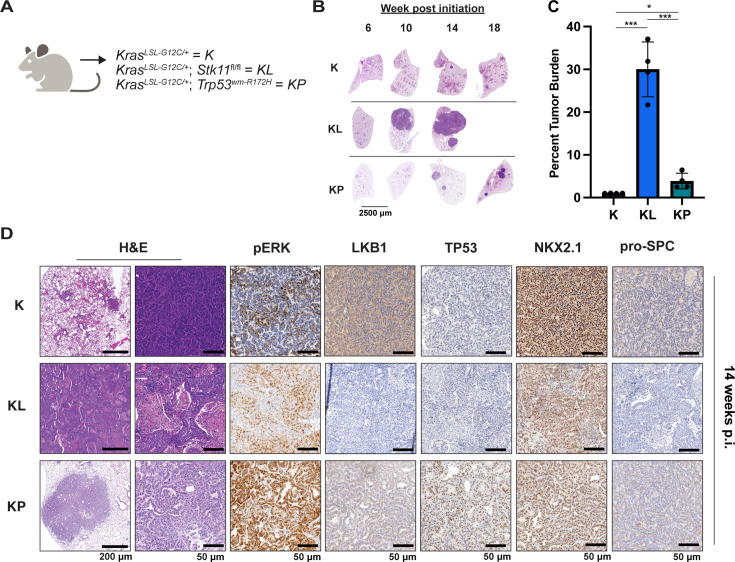
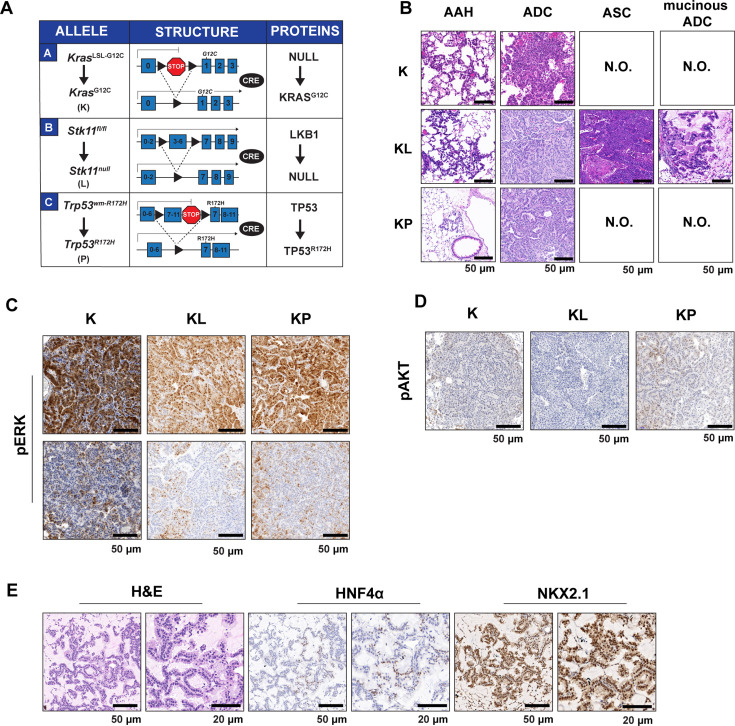
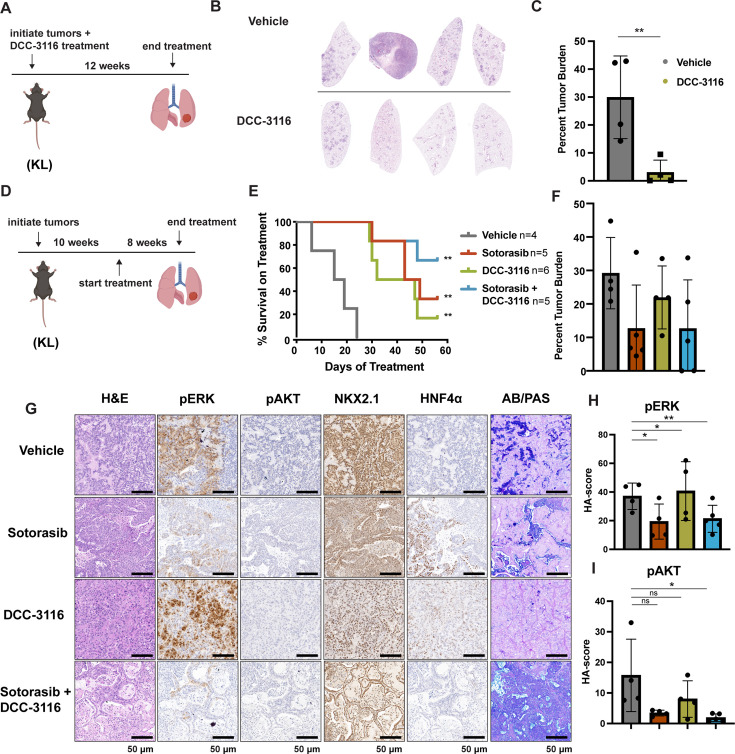
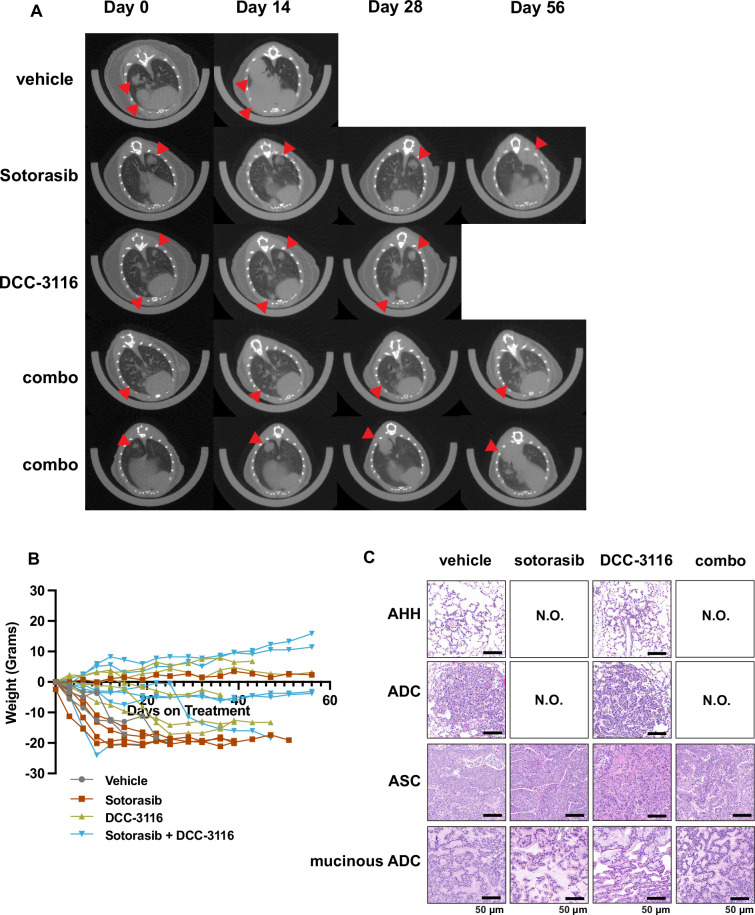
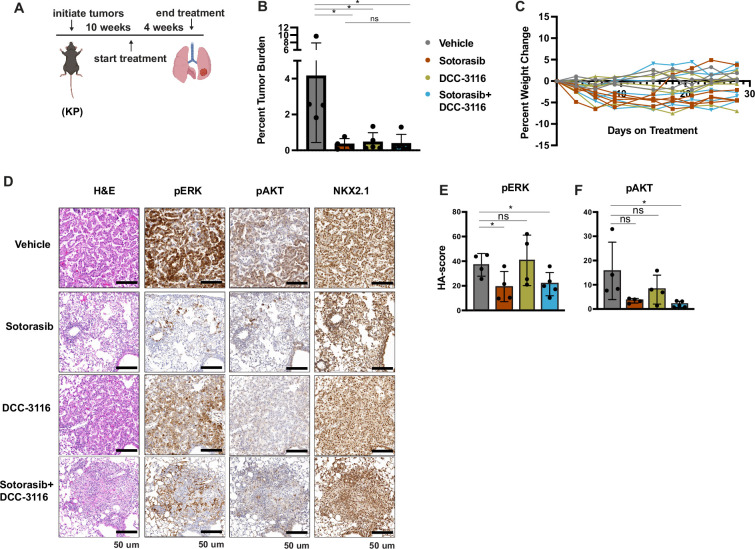
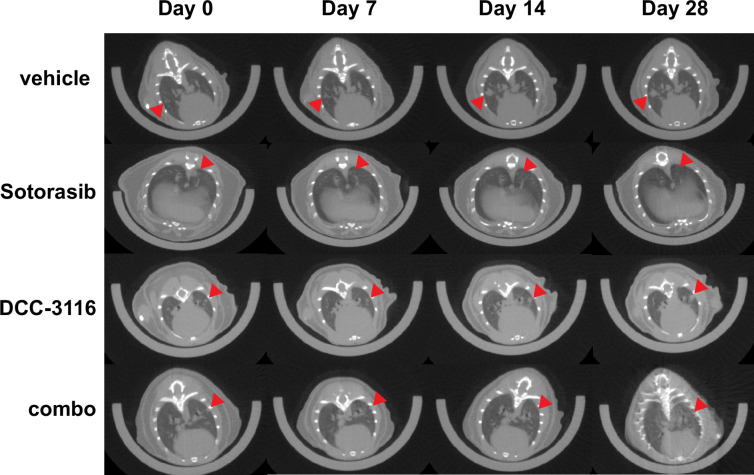
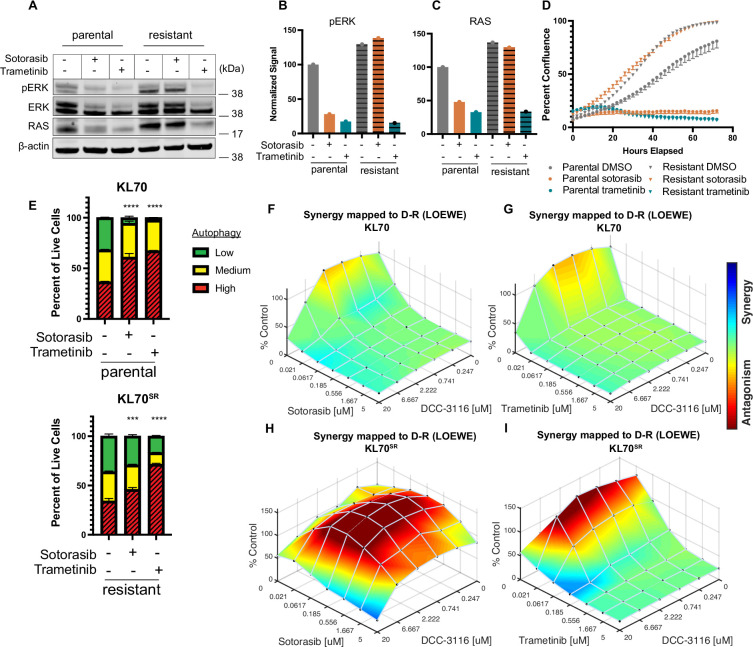
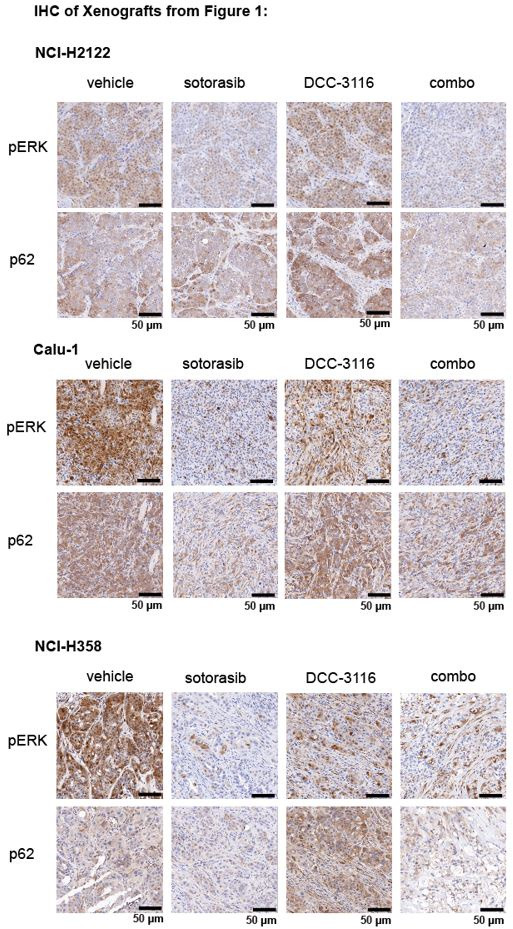
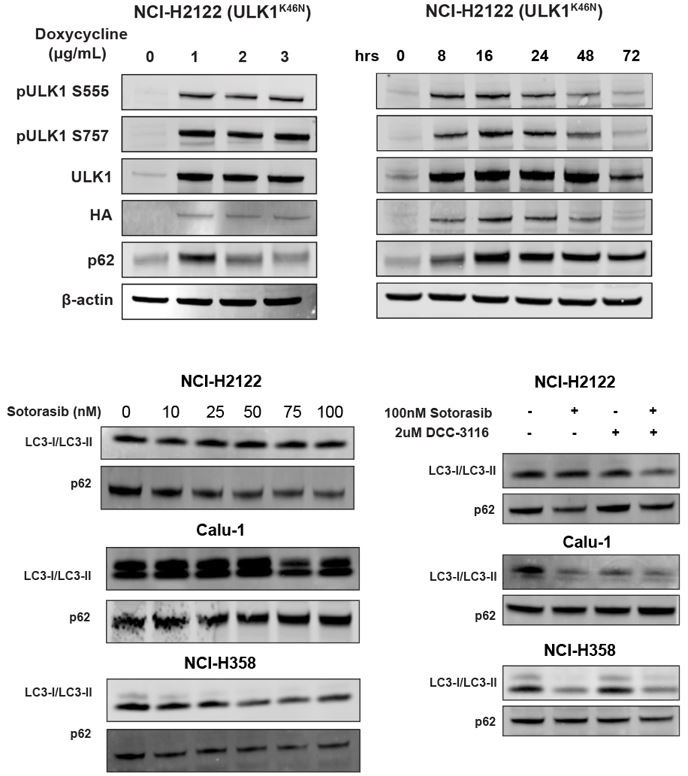
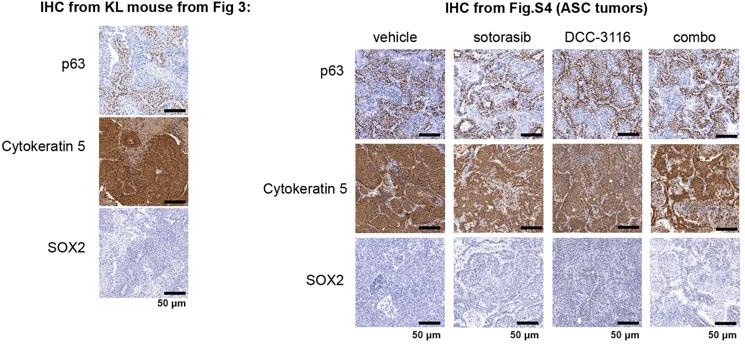
Mutational activation of KRAS occurs commonly in lung carcinogenesis and, with the recent U.S. Food and Drug Administration approval of covalent inhibitors of KRASG12C such as sotorasib or adagrasib, KRAS oncoproteins are important pharmacological targets in non-small cell lung cancer (NSCLC). However, not all KRASG12C-driven NSCLCs respond to these inhibitors, and the emergence of drug resistance in those patients who do respond can be rapid and pleiotropic. Hence, based on a backbone of covalent inhibition of KRASG12C, efforts are underway to develop effective combination therapies. Here, we report that the inhibition of KRASG12C signaling increases autophagy in KRASG12C-expressing lung cancer cells. Moreover, the combination of DCC-3116, a selective ULK1/2 inhibitor, plus sotorasib displays cooperative/synergistic suppression of human KRASG12C-driven lung cancer cell proliferation in vitro and superior tumor control in vivo. Additionally, in genetically engineered mouse models of KRASG12C-driven NSCLC, inhibition of either KRASG12C or ULK1/2 decreases tumor burden and increases mouse survival. Consequently, these data suggest that ULK1/2-mediated autophagy is a pharmacologically actionable cytoprotective stress response to inhibition of KRASG12C in lung cancer.

Keywords: KRAS; LKB1; TP53; ULK; autophagy; cancer biology; lung cancer; mouse.


Conflict of interest statement

PG, KO, SS, MS, MS, YZ, GL, ES No competing interests declared, MB, BS, DF stockholder of Deciphera Pharmaceuticals, CK, MM Research described here was supported through a Sponsored Research Agreement between the University of Utah and Deciphera Pharmaceuticals award to MM and CK

Figures

Figure 1.
Figure 1.. Human KRASG12C-driven lung cancer cells are sensitive to co-inhibition of KRASG12C and ULK1/2.
(A–C) Human KRASG12C-driven cell lines NCI-H2122 (A), Calu-1 (B), and NCI-H358 (C) increase autophagy as assessed by mCherry-EGFP-LC3 reporter after 48 hr of sotorasib treatment and decrease autophagy after 48 hr of DCC-3116 treatment. Red = high autophagy, yellow = medium autophagy, green = low autophagy. Statistical significance was determined by comparing autophagy levels to DMSO control, and an ordinary one-way ANOVA with Dunnett’s multiple comparisons was used. Ns = not significant, *p<0.05, **p<0.01, ***p<0.001, ****p<0.0001. N = 9 biological replicates. (D–F) Quantification of percent confluence of human KRASG12C-driven cell lines at 72 hr post-drug treatment. Statistical significance was determined by an ordinary one-way ANOVA. Ns = not significant, *p<0.05, **p<0.01, ***p<0.001, ****p<0.0001. N = 3 biological replicates. (G–I) In vitro synergy assay of human KRASG12C-driven cell lines using the Loewe method after 72 hr of treatment. N = 3 biological replicates. (J–L) Tumor volume measured over 28 days of treatment in mice inoculated with NCI-H2122 (J), Calu-1 (K), and NCI-H358 (L) cells. Vehicle and sotorasib were administered once daily via oral gavage and DCC-3116 was formulated in the chow. Statistical significance was determined by an ordinary one-way ANOVA compared to vehicle-treated tumors. Ns = not significant, *p<0.05, **p<0.01, ***p<0.001, ****p<0.0001. N = 4–5 mice per treatment.
Figure 1—figure supplement 1.
Figure 1—figure supplement 1.. Human KRAS-driven lung cancer cells increase autophagy after KRASG12C or MEK inhibition.
(A–E) Autophagy levels in human KRASG12C-driven lung cancer cells Calu-1 (A), NCI-H2122 (B), NCI-H23 (C), NCI-H358 (D), and the KRASG12V-driven human lung cancer cell line Cor-L23 (E) after 48 hr of sotorasib at indicated concentrations with the fluorescent autophagy reporter (FAR). Red = high autophagy, yellow = medium autophagy, green = low autophagy. Statistical significance was determined by comparing autophagy levels to DMSO control, and an ordinary one-way ANOVA with Dunnett’s multiple comparisons was used. ns = not significant, *p<0.05, **p<0.01, ***p<0.001, ****p<0.0001. N = 9. (F–J) Autophagy levels in human KRASG12C-driven lung cancer cells Calu-1 (F), NCI-H2122 (G), NCI-H23 (H), NCI-H358 (I), and the KRASG12V-driven human lung cancer cell line Cor-L23 (J) after 48 hr of trametinib at indicated concentrations with the FAR. Red = high autophagy, yellow = medium autophagy, green = low autophagy. Statistical significance was determined by comparing autophagy levels to DMSO control, and an ordinary one-way ANOVA with Dunnett’s multiple comparisons was used. ns = not significant, *p<0.05, **p<0.01, ***p<0.001, ****p<0.0001. N = 9.
Figure 1—figure supplement 2.
Figure 1—figure supplement 2.. Human KRASG12C-driven lung cancer cell lines increase autophagy and decrease cellular proliferation after sotorasib treatment.
(A–C) ELISA measurement of pS318-ATG13 signal after 16 hr of drug treatment in NCI-H2122 (A), Calu-1 (B), and NCI-H358 cell lines (C). N = 3. Statistical analysis was performed using an ordinary one-way ANOVA with Tukey’s multiple comparisons test. ns = not significant, *p<0.05, ****p<0.0001. (D–F) Percent confluence over time of NCI-H2122 (D), Calu-1 (E), and NCI-H358 (F) cell lines treated with indicated compounds over time. Statistical analysis was performed using an ordinary one-way ANOVA with Tukey’s multiple comparisons test. ns = not significant, *p<0.05, **p<0.01, ***p<0.001, ****p<0.0001. N = 3–5. (G–I) Immunoblotting analysis of NCI- H2122 (G), Calu-1 (H), and NCI-H358 (I) cell lines after 100 nM sotorasib treatment over 24 hr.
Figure 2.
Figure 2.. Genetic inhibition of ULK1 decreases autophagy and cooperates with sotorasib to reduce cell viability.
(A) Immunoblot of NCI-H2122:ULK1K46N cells after 24 hr of doxycycline treatment. (B) Immunoblot of NCI-H2122:ULK1K46N cells treated with 1 ug/mL doxycycline over time (hours). (C) ELISA of pS318-ATG13 expression after 16 hr of doxycycline treatment. Statistical significance was determined by an ordinary one-way ANOVA. Ns = not significant, *p<0.05, **p<0.01, ***p<0.001, ****p<0.0001. N = 3 biological replicates. (D) NCI-H2122:ULK1K46N cells were engineered to express the mCherry-EGFP-LC3 reporter, and a decrease in autophagy was demonstrated after 48 hr of doxycycline treatment. N = 3. All statistical significance was measured using an ordinary one-way ANOVA with Dunnett’s multiple comparisons test. *p<0.05, **p<0.01, ***p<0.001, ****p<0.0001. (E) In vitro synergy assay of NCI-H2122:ULK1K46N cells treated with DMSO control, sotorasib, and/or doxycycline over 48 hr using the Loewe method. N = 3 biological replicates.
Figure 3.
Figure 3.. Either LKB1 silencing or expression of dominant-negative TP53R172H cooperates with KRASG12C in genetically engineered mouse (GEM) models of lung cancer.
(A) Schematic of genotypes of GEM models and abbreviations. Panel (A) was created with BioRender.com and published using a CC BY-NC-ND license with permission. (B) Representative images of lung lobes from GEM models at indicated time points post-initiation of lung tumorigenesis. (C) Quantification of lung tumor burdens from GEM models 14 weeks post-initiation of tumorigenesis. Statistical analysis was performed using an ordinary one-way ANOVA. Ns = not significant, *p<0.05, **p<0.01, ***p<0.001, ****p<0.0001. N = 4 mice. (D) Hematoxylin and eosin (H&E) and immunohistochemical analysis of representative lung sections from GEM models 14 weeks post-initiation of tumorigenesis. p.i. = post-initiation.
Figure 3—figure supplement 1.
Figure 3—figure supplement 1.. Loss of LKB1 expression leads to mixed adenosquamous cell carcinoma (ASC) and mucinous adenocarcinoma (ADC) lung tumors in KRASG12C-driven genetically engineered mouse (GEM) models.
(A) Schematic of allele, structure, and protein changes in GEM models used. (B) Representative hematoxylin and eosin (H&E) stains of K, KL, and KP GEM models 14 weeks post-initiation. N.O. = not observed, AAH = atypical adenomatous hyperplasia, mucinous ADC = mucinous adenocarcinoma. (C, D) Representative immunohistochemical stains of pERK1/2 (C) and pAKT1-3 (D) signal in K, KL, and KP GEM models. (E) Representative images of staining and immunohistochemistry of indicated proteins in KL mice.
Figure 4.
Figure 4.. Combined inhibition of KRASG12C and ULK1/2 decreases tumor initiation and increases survival in KL genetically engineered mouse (GEM) models.
(A) Schematic of lung tumor prevention dosing strategy of KL GEMs. Panel (A) was created with BioRender.com and published using a CC BY-NC-ND license with permission. DCC-3116 was administered in drug-formulated chow. N = 4–6 mice. (B) Representative images of lung lobes from GEM models 12 weeks post-initiation of tumorigenesis and DCC-3116 treatment. (C) Quantification of tumor burden of (B). Statistical analysis was measured by an unpaired Student’s t-test. Ns = not significant, *p<0.05, **p<0.01, ***p<0.001, ****p<0.0001. N = 4 mice. (D) Schematic of treating tumor-bearing KL mice with vehicle control, 30 mg/kg sotorasib, chow containing DCC-3116 or the combination. Panel (D) was created with BioRender.com and published using a CC BY-NC-ND license with permission. DCC-3116 was administered in drug-formulated chow (Key resources table). Mice were treated daily for 56 days or until termination criteria were reached, whichever was reached first. N = 4–6 mice. (E) Kaplan–Meier survival curve of survival on treatment of KL mice treated as indicated. Statistical analysis was performed using a log-rank test. **p<0.01, N = 4–6 mice. (F) Quantification of tumor burden of (E). (G) H&E analysis of representative lung sections from KL mice after treatment. AB/PAS = Alcian Blue Periodic Acid Schiff, for staining mucins. (H, I) Quantification of immunohistochemical staining of treated mice pERK (H) and pAKT (I) as described in ‘Materials and methods’. Statistical analysis was measured with an ordinary one-way ANOVA. *p<0.05, **p<0.01, ns = not significant. N = 4–5 mice.
Figure 4—figure supplement 1.
Figure 4—figure supplement 1.. MicroCT, body weight, and pathological analysis of treated KL mice.
(A) Representative microCT images of KL mice pre-treatment (day 0) and 14 days, 28 days, and 56 days post-treatment. Vehicle-treated mice and most DCC-3116-treated mice reached termination criteria before the 56-day endpoint. Red arrows indicate lung tumors. (B) Percent change in the body weight of mice over the course of the treatment period. Each line depicts an individual mouse. (C) Representative images of hematoxylin and eosin staining of lung sections of KL mice at the end of treatment. N.O. = not observed, AH = alveolar hyperplasia, ADC = adenocarcinoma, ASC = adenosquamous cell carcinoma, mucinous ADC = mucinous adenocarcinoma.
Figure 5.
Figure 5.. Inhibition of KRASG12C and ULK1/2 reduces tumor burden in a KP genetically engineered mouse (GEM) model.
(A) Schematic of the treatment of KP GEM models. Panel (A) was created with BioRender.com and published using a CC BY-NC-ND license with permission. Mice were administered vehicle control or 30 mg/kg sotorasib once daily via oral gavage. DCC-3116 was administered in drug-formulated chow. N = 4–5 mice. (B) Quantification of tumor burden of mice after 4 weeks of treatment. Statistical analysis was performed using an ordinary one-way ANOVA. *p<0.05, ns = not significant. N = 4–5 mice. (C) Percent change in the body weight of mice on treatment over 4 weeks. Each line depicts an individual mouse. (D) Representative images of histological analysis of lung lobes from KP mice 4 weeks after treatment. (E, F) Quantification of immunohistochemical staining of treated mice pERK1/2 (E) and pAKT1-3 (F) as described in ‘Materials and methods’. Statistical analysis was performed using an ordinary one-way ANOVA. *p<0.05, **p<0.01. ns = not significant. N = 4–5 mice.
Figure 5—figure supplement 1.
Figure 5—figure supplement 1.. MicroCT images of KP mice on treatment.
Representative microCT images of KP mice pre-treatment (day 0) and 7 days, 14 days, and 28 days post-treatment. Red arrows indicate lung tumors.
Figure 6.
Figure 6.. KL lung-cancer-derived cells that acquire resistance to sotorasib increase RAS and pERK1/2 expression and do not increase autophagy after sotorasib treatment.
(A) Immunoblot analysis of KL.70 and KL.70R cells treated with 100 nM sotorasib or 100 nM trametinib after 48 hr of treatment. (B, C) Quantification of signal from A normalized to b-actin. (D) Live-cell imaging of percent confluence of KL.70 cells over time treated with DMSO, 100 nm sotorasib of 100 nM trametinib. N = 3 biological replicates. (E) Autophagy measurement with fluorescent autophagy reporter (FAR) in cells assessed by mCherry-eGFP-LC3 reporter after 48 hr of 100 nM sotorasib or 100 nM trametinib treatment. Red = high autophagy, yellow = medium autophagy, green = low autophagy. Statistical significance was determined by comparing autophagy levels to DMSO control, and an ordinary one-way ANOVA with Dunnett’s multiple comparisons was used. Ns = not significant, *p<0.05, **p<0.01, ***p<0.001, ****p<0.0001. N = 9 biological replicates. (F, G) In vitro synergy assay of KL70 cells treated with indicated doses of sotorasib and/or DCC-3116 using the Loewe method after 72 hr of treatment. N = 3 biological replicates. (H, I) In vitro synergy assay of KL70SR cells treated with indicated doses of sotorasib and/or DCC-3116 using the Loewe method after 72 hr of treatment. N = 3 biological replicates.
Author response image 1.
Author response image 2.
Author response image 3.

Update of

References

    1. Ahrendt SA, Decker PA, Alawi EA, Zhu Yr YR, Sanchez-Cespedes M, Yang SC, Haasler GB, Kajdacsy-Balla A, Demeure MJ, Sidransky D. Cigarette smoking is strongly associated with mutation of the K-ras gene in patients with primary adenocarcinoma of the lung. Cancer. 2001;92:1525–1530. doi: 10.1002/1097-0142(20010915)92:6<1525::aid-cncr1478>3.0.co;2-h. - DOI - PubMed
    1. Al-Bari MAA. Chloroquine analogues in drug discovery: new directions of uses, mechanisms of actions and toxic manifestations from malaria to multifarious diseases. The Journal of Antimicrobial Chemotherapy. 2015;70:1608–1621. doi: 10.1093/jac/dkv018. - DOI - PMC - PubMed
    1. Amaravadi RK, Kimmelman AC, Debnath J. Targeting autophagy in cancer: Recent advances and future directions. Cancer Discovery. 2019;9:1167–1181. doi: 10.1158/2159-8290.CD-19-0292. - DOI - PMC - PubMed
    1. Ashrafi A, Akter Z, Modareszadeh P, Modareszadeh P, Berisha E, Alemi PS, Chacon Castro MDC, Deese AR, Zhang L. Current landscape of therapeutic resistance in lung cancer and promising strategies to overcome resistance. Cancers. 2022;14:4562. doi: 10.3390/cancers14194562. - DOI - PMC - PubMed
    1. Awad MM. Acquired resistance to KRASG12C inhibition in cancer. New England Journal of Medicine. 2021;384:2382–2393. doi: 10.1056/NEJMoa2105281. - DOI - PMC - PubMed

MeSH terms