. 2024;40(3-4):297-317.
doi: 10.3233/CBM-230517.

Identification of DNA methylation-regulated WEE1 with potential implications in prognosis and immunotherapy for low-grade glioma

Affiliations

Identification of DNA methylation-regulated WEE1 with potential implications in prognosis and immunotherapy for low-grade glioma

Wang-Jing Zhong et al. Cancer Biomark. 2024.

Abstract

Background: WEE1 is a critical kinase in the DNA damage response pathway and has been shown to be effective in treating serous uterine cancer. However, its role in gliomas, specifically low-grade glioma (LGG), remains unclear. The impact of DNA methylation on WEE1 expression and its correlation with the immune landscape in gliomas also need further investigation.

Methods: This study used data from The Cancer Genome Atlas (TCGA), Chinese Glioma Genome Atlas (CGGA), and Gene Expression Omnibus (GEO) and utilized various bioinformatics tools to analyze gene expression, survival, gene correlation, immune score, immune infiltration, genomic alterations, tumor mutation burden, microsatellite instability, clinical characteristics of glioma patients, WEE1 DNA methylation, prognostic analysis, single-cell gene expression distribution in glioma tissue samples, and immunotherapy response prediction based on WEE1 expression.

Results: WEE1 was upregulated in LGG and glioblastoma (GBM), but it had a more significant prognostic impact in LGG compared to other cancers. High WEE1 expression was associated with poorer prognosis in LGG, particularly when combined with wild-type IDH. The WEE1 inhibitor MK-1775 effectively inhibited the proliferation and migration of LGG cell lines, which were more sensitive to WEE1 inhibition. DNA methylation negatively regulated WEE1, and high DNA hypermethylation of WEE1 was associated with better prognosis in LGG than in GBM. Combining WEE1 inhibition and DNA methyltransferase inhibition showed a synergistic effect. Additionally, downregulation of WEE1 had favorable predictive value in immunotherapy response. Co-expression network analysis identified key genes involved in WEE1-mediated regulation of immune landscape, differentiation, and metastasis in LGG.

Conclusion: Our study shows that WEE1 is a promising indicator for targeted therapy and prognosis evaluation. Notably, significant differences were observed in the role of WEE1 between LGG and GBM. Further investigation into WEE1 inhibition, either in combination with DNA methyltransferase inhibition or immunotherapy, is warranted in the context of LGG.

Keywords: DNA methylation; WEE1; immunotherapy; low-grade glioma; prognosis.


Conflict of interest statement

No commercial or financial relationships could be construed as potential conflicts of interest by the authors.

Figures

Figure 1.
Figure 1.
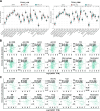
Analysis of WEE1 expression in gliomas and its correlation with patient prognosis in multiple cancer types. (A) Analysis of top 500 significant survival-associated genes in LGG from TCGA database. (B) Pan-cancer survival analysis of WEE1 family members in TCGA database. Mantel-Cox test was performed. (C) The expression of WEE1 in two types of gliomas (LGG and GBM) and normal brain tissue in TCGA and GTEx database. (D–E) WEE1 expression in LGG and GBM from three datasets of CGGA database (D) and four datasets of GEO database (E). Data are shown as mean ± SEM and unpaired Student’s t-test was carried out to detect significance (C–E). *P < 0.05; ***P < 0.001.
Figure 2.
Figure 2.
Prognosis analysis of WEE1 expression according to IDH mutation or 1p/19q codeletion status in LGG. Survival curves were used to analyze OS of patients with LGG from three datasets of CGGA database (Log-rank test). WT, wildtype; Mut, mutant; Codel, codeletion; Non-codel, Non-codeletion.
Figure 3.
Figure 3.
Analysis of the effects of WEE1 inhibition on proliferation and migration of LGG and GBM cell lines. (A) Confirm the effect of WEE1 inhibitor MK-1775 on WEE1/CDK1 signaling pathway. SW1088 and U251 cell lines were treated with 0.1, 0.2 and 0.4 μM MK-1775 for 36h, respectively, and then subjected to western blotting. β-actin was used as an internal control. (B) Confirm the effect of WEE1 inhibitor MK-1775 on the proliferation of LGG and GBM cell lines. SW1088 and U251 cells were treated with 0.05, 0.1, 0.2 and 0.4 μM MK-1775 for 48h, respectively, and then subjected to CCK-8 assay. (C) Confirm the effect of WEE1 inhibitor MK-1775 on the proliferation of LGG and GBM cell lines by wound healing assay. SW1088 and U251 cells were treated with 0.1, 0.2 and 0.4 μM MK-1775 for 24h after scratch, and then the distance the cells migrated was measured. Scale bar, 200 μm. Ctrl, control.
Figure 4.
Figure 4.
Analysis of WEE1 expression in LGG and GBM in correlation with immune infiltration. (A) Comparison of the infiltration of 28 kinds of immune cells between high and low WEE1 expression subpopulations in TCGA_LGG and TCGA_GBM databases. (B–C) The correlation between the expression of WEE1 and the abundance of immune cells in LGG (B) and GBM (C) from TCGA database. Act CD4, Activated CD4 T cell; Act CD8, Activated CD8 T cell; Act B, Activated B cell; Tgd, Gamma delta T cell; Th1, Type 1 T helper cell; Act DC, Activated dendritic cell; Th2, Type 2 T helper cell; NK, Natural killer cell; MDSC, myeloid-derived suppressor cell; NKT, Natural killer T cell; Treg, Regulatory T cell; Tcm CD8, Central memory CD8 T cell; Tem CD8, Central memory CD8 T cell; Tcm CD4, Central memory CD4 T cell; Tem CD4, Central memory CD4 T cell; Tfh, T follicular helper cell; Th17, Type 17 T helper cell; CD56bright, CD56bright natural killer cell; CD56dim, CD56dim natural killer cell; Mem B, Memory B cell; pDC, Plasmacytoid dendritic cell; iDC, Immature dendritic cell. ns, no significance; *P < 0.05; **P < 0.01; ***P < 0.001; ****P < 0.001.
Figure 5.
Figure 5.
Correlation between WEE1 expression and DNA methylation. (A) Correlation analysis between the expression of WEE1 and three DNA methyltransferases in LGG and GBM from TCGA database. (B) Correlation analysis between WEE1 DNA methylation levels and WEE1 expression in LGG and GBM from TCGA database. Ten probes targeting methylation sites in the promoter region and nine probes targeting methylation sites in the gene body region were marked. (C) The correlation between WEE1 DNA methylation levels and immune cells abundance in LGG and GBM from TCGA database. *P < 0.05; **P < 0.01; ***P < 0.001. DNMT1_exp, DNMT1 expression; DNMT3A_exp, DNMT3A expression; DNMT3B_exp, DNMT3B expression; WEE1_exp, WEE1 expression.
Figure 6.
Figure 6.
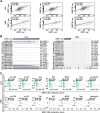
Prognosis analysis of WEE1 DNA methylation in LGG and GBM. (A) Survival curves of patients with low- and high-methylation levels of six representative WEE1 DNA methylation sites in LGG and GBM from TCGA database were determined. (B) WEE1 DNA methylation levels in LGG and GBM from Methyl_159 dataset of CGGA database. (C) Survival curves of patients with low- and high-WEE1 DNA methylation levels in LGG and GBM from Methyl_159 dataset of CGGA database. Log-rank test was conducted (A, C). Data are shown as mean ± SEM and unpaired Student’s t-test was carried out to detect significance (B). ***P < 0.001.
Figure 7.
Figure 7.
Synergistic effect of WEE1 inhibition and DNA methyltransferase inhibitor or temozolomide on glioma cells. (A) Effects of DNA methyltransferase inhibitors on WEE1 expression. SW1088 and U251 cell lines were treated with 2, 5 and 10 μM 5-Azacytidine for 48h, respectively, and then subjected to western blotting. β-actin was used as an internal control. The representation is on the left and the statistical results are on the right. (B) Synergistic effect of WEE1 inhibition and DNA methyltransferase inhibitor on glioma cells. SW1088 and U251 cells were treated with MK-1775 and 5-Azacytidine for 48h, respectively, and then subjected to CCK-8 assay. (C) Synergistic effect of WEE1 inhibition and temozolomide on glioma cells. SW1088 and U251 cells were treated with MK-1775 and temozolomide for 48h, respectively, and then subjected to CCK-8 assay. The differences between two groups were statistically evaluated by unpaired Student’s t-test. ns, no significance; *P < 0.05; **P < 0.01; ***P < 0.001. 5aza, 5-Azacytidine; MK, MK-1775.
Figure 8.
Figure 8.
Single-cell RNA-seq analysis of WEE1 expression in gliomas. (A) Heatmap of WEE1 expression in different cell types of gliomas from twelve datasets. (B) Heatmap of WEE1 expression in various cell subtypes of gliomas from twelve datasets. The average expression level of WEE1 in each cell type was showed. CD8Tex, exhausted CD8 T Cells; M1, M1 macrophages; M2, M2 macrophages; AC-like Malignant, astrocyte-like malignant cells; MES-like Malignant, mesenchymal-like malignant cells; OC-like Malignant, oligodendrocyte-like malignant cells; NPC-like Malignant, neural-progenitor-like malignant Cells; OPC-like Malignant, oligodendrocyte-precursor-cell-like malignant cells.
Figure 9.
Figure 9.
Analysis of predictive value of WEE1 in immunotherapy response. (A) Analysis of WEE1 expression in mouse tumor cell lines before and after treatment with cytokines in vitro. (B) Analysis of WEE1 expression in the response group or non-response group after ICB treatment in mouse tumors. (C) Analysis of WEE1 expression in tumors of the response or non-response patients after ICB therapy. (D) Distribution of WEE1 expression in high- or low- immunophenoscore (IPS) group. Violin plot representation of WEE1 expression in high- or low- immunophenoscore (IPS) groups in TCGA-LGG cohort. Data are shown as mean ± SEM. The differences between two groups were statistically evaluated by unpaired Student’s t-test. P*< 0.05, **P < 0.01, ***P < 0.001. Abbreviations: Ctrl, baseline; Res, response. Non-res, non-response.

Similar articles

References

    1. Ceccarelli M., et al., Molecular Profiling Reveals Biologically Discrete Subsets and Pathways of Progression in Diffuse Glioma, Cell 164 (2016), 550–563. - PMC - PubMed
    1. Louis D.N., et al., The 2021 WHO Classification of Tumors of the Central Nervous System: a summary, Neuro-Oncology 23 (2021), 1231–1251. - PMC - PubMed
    1. Zhao Z., et al., Chinese Glioma Genome Atlas (CGGA): A Comprehensive Resource with Functional Genomic Data from Chinese Glioma Patients, Genomics, Proteomics & Bioinformatics 19 (2021), 1–12. - PMC - PubMed
    1. Lapointe S., Perry A. and Butowski N.A., Primary brain tumours in adults, Lancet (London, England) 392 (2018), 432–446. - PubMed
    1. Picca A., Berzero G. and Sanson M., Current therapeutic approaches to diffuse grade II and III gliomas, Therapeutic Advances in Neurological Disorders 11 (2018), 1756285617752039. - PMC - PubMed

MeSH terms

LinkOut - more resources