

Magnetic Resonance Imaging to Detect Structural Brain Changes in Huntington's Disease: A Review of Data from Mouse Models
- PMID: 39213087
- PMCID: PMC11494634
- DOI: 10.3233/JHD-240045
Magnetic Resonance Imaging to Detect Structural Brain Changes in Huntington's Disease: A Review of Data from Mouse Models
Abstract
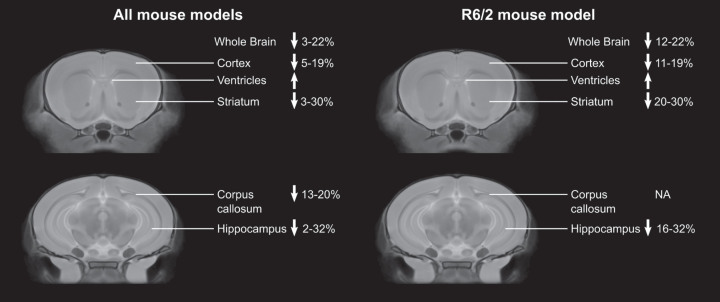
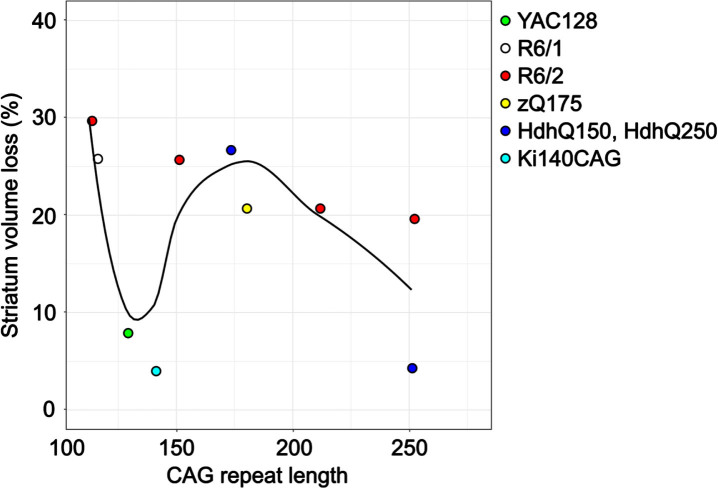
Structural magnetic resonance imaging (MRI) is a powerful tool to visualize 3D neuroanatomy and assess pathology and disease progression in neurodegenerative disorders such as Huntington's disease (HD). The development of mouse models of HD that reproduce many of the psychiatric, motor and cognitive impairments observed in human HD has improved our understanding of the disease and provided opportunities for testing novel therapies. Similar to the clinical scenario, MRI of mouse models of HD demonstrates onset and progression of brain pathology. Here, we provided an overview of the articles that used structural MRI in mouse models of HD to date, highlighting the differences between studies and models and describing gaps in the current state of knowledge and recommendations for future studies.
Keywords: Brain structure; Huntington’s disease; magnetic resonance imaging; mouse models; neuroanatomy.
Conflict of interest statement
The authors have no conflict of interest to report.
Figures
Similar articles
-
Structural Magnetic Resonance Imaging in Huntington's Disease.Int Rev Neurobiol. 2018;142:335-380. doi: 10.1016/bs.irn.2018.09.006. Epub 2018 Oct 8. Int Rev Neurobiol. 2018. PMID: 30409258 Review.
-
Huntington's disease: Brain imaging in Huntington's disease.Prog Mol Biol Transl Sci. 2019;165:321-369. doi: 10.1016/bs.pmbts.2019.04.004. Epub 2019 May 15. Prog Mol Biol Transl Sci. 2019. PMID: 31481169 Review.
-
In Vivo Multidimensional Brain Imaging in Huntington's Disease Animal Models.Methods Mol Biol. 2018;1780:285-301. doi: 10.1007/978-1-4939-7825-0_15. Methods Mol Biol. 2018. PMID: 29856025
-
Longitudinal in vivo MRI in a Huntington's disease mouse model: Global atrophy in the absence of white matter microstructural damage.Sci Rep. 2016 Sep 1;6:32423. doi: 10.1038/srep32423. Sci Rep. 2016. PMID: 27581950 Free PMC article.
-
Early grey matter changes in structural covariance networks in Huntington's disease.Neuroimage Clin. 2016 Oct 12;12:806-814. doi: 10.1016/j.nicl.2016.10.009. eCollection 2016. Neuroimage Clin. 2016. PMID: 27830113 Free PMC article.
Cited by
-
Imaging the enteric nervous system.Front Neuroanat. 2025 Mar 12;19:1532900. doi: 10.3389/fnana.2025.1532900. eCollection 2025. Front Neuroanat. 2025. PMID: 40145027 Free PMC article. Review.
References
-
- Parsons MP and Raymond LA . Huntington disease. In: Zigmond MJ, Wiley CA and Chesselet M-F (eds) Neurobiology of Brain Disorders. 2nd ed. Academic Press, 2023, pp. 275–292.
-
- Ross CA, Aylward EH, Wild EJ, et al.. Huntington disease: Natural history, biomarkers, and prospects for therapeutics. Nat Rev Neurol 2014; 10: 204–216. - PubMed
Publication types
MeSH terms
LinkOut - more resources
Full Text Sources
Medical
