. 2024 Aug 30;134(22):e180983.
doi: 10.1172/JCI180983.

Parkin activates innate immunity and promotes antitumor immune responses

Affiliations

Parkin activates innate immunity and promotes antitumor immune responses

Michela Perego et al. J Clin Invest. .

Abstract

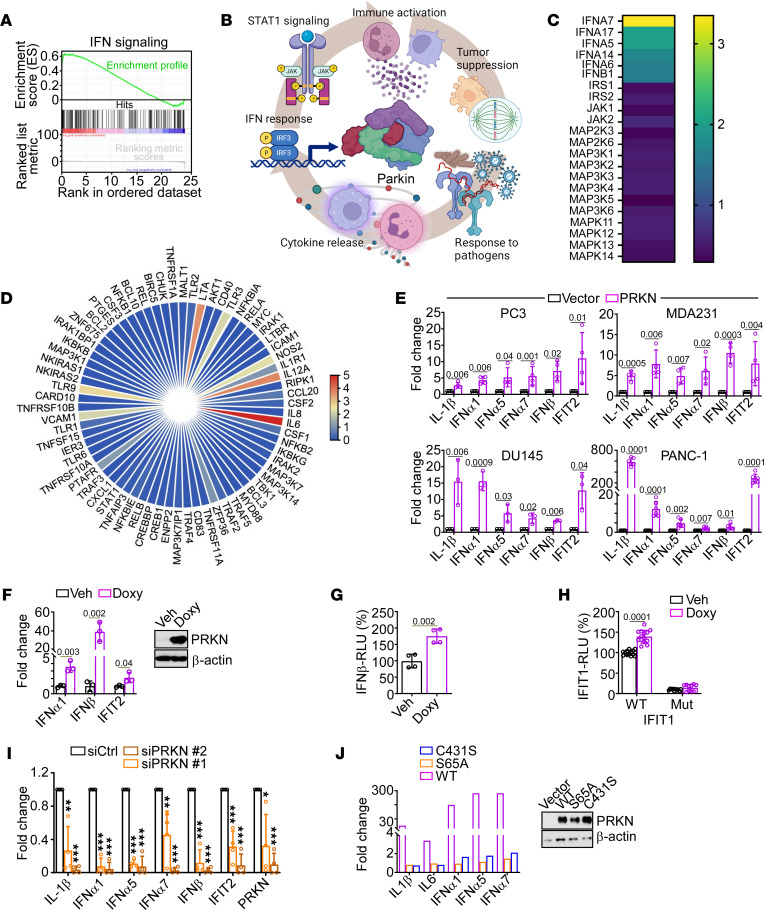
The activation of innate immunity and associated interferon (IFN) signaling have been implicated in cancer, but the regulators are elusive and links to tumor suppression remain undetermined. Here, we found that Parkin, an E3 ubiquitin ligase altered in Parkinson's Disease, was epigenetically silenced in cancer and its reexpression by clinically approved demethylating therapy stimulated transcription of a potent IFN response in tumor cells. This pathway required Parkin E3 ubiquitin ligase activity, involved the subcellular trafficking and release of the alarmin High Mobility Group Box 1 (HMGB1) and was associated with inhibition of NF-κB gene expression. In turn, Parkin-expressing cells released an IFN secretome that upregulated effector and cytotoxic CD8+ T cell markers, lowered the expression of immune inhibitory receptors TIM3 and LAG3, and stimulated high content of the self renewal/stem cell factor, TCF1. PRKN-induced CD8+ T cells selectively accumulated in the microenvironment and inhibited transgenic and syngeneic tumor growth in vivo. Therefore, Parkin is an epigenetically regulated activator of innate immunity and dual mode tumor suppressor, inhibiting intrinsic tumor traits of metabolism and cell invasion, while simultaneously reinvigorating CD8 T cell functions in the microenvironment.

Keywords: Immunology; Innate immunity; Mitochondria; Oncology; Tumor suppressors.


Conflict of interest statement

Conflict of interest: The authors have declared that no conflict of interest exists.

Figures

Figure 1
Figure 1. PRKN IFN response in cancer.
(A) PC3 cells were transfected with vector or PRKN and analyzed for an IFN enrichment gene signature by RNA-Seq. (B) Schematic diagram of innate immunity pathways activated by PRKN in PC3 cells by RNA-Seq. Created with BioRender.com. (C) PC3 cells expressing PRKN (as in A) were analyzed in an IFN/MAPK array by RT-qPCR. Heatmap from a representative experiment. (D) The conditions are the same as in A and PRKN-expressing PC3 cells were analyzed in an NF-κB gene array by RT-qPCR. Heatmap from a representative experiment out of 2 independent determinations. (E) The indicated tumor cell types expressing vector or PRKN were analyzed for IFN gene expression by RT-qPCR. Mean ± SD (n = 3). (F) PC3 cells that conditionally express PRKN (TetON system) in response to Doxycycline (Doxy) were analyzed by Western blotting (inset) and RT-qPCR in the presence of vehicle (Veh) or Doxy. Mean ± SD (n = 3). (G) PRKN TetON PC3 cells were analyzed for IFN-β promoter luciferase activity in the presence of vehicle (Veh) or Doxy. RLU, relative luciferase activity. Mean ± SD (n = 4). (H) The conditions are the same as in G except that PRKN TetON PC3 cells were analyzed for WT or mutant (Mut) IFIT1 promoter luciferase activity in the presence of vehicle (Veh) or Doxy. Mean ± SD (n = 3). (I) Normal breast epithelial MCF10A cells expressing endogenous PRKN were transfected with control nontargeted siRNA (siCtrl) or 2 independent siRNA sequences to PRKN (siPRKN #1 and siPRKN #2) and analyzed for IFN gene expression by RT-qPCR. Mean ± SD (n = 3). (J) PC3 cells expressing WT PRKN (WT) or E3-ligase defective PRKN C431S or S65A mutants (inset) were analyzed for IFN gene expression by RT-qPCR. Data are from a representative experiment out of 4 independent determinations. Numbers represent P values by 2-tailed unpaired t test. *P = 0.01; **P = 0.002–0.009; ***P = <0.0001–0.0003.
Figure 2
Figure 2. PRKN epigenetic silencing in human tumors.
(A) Heatmap of PARK2 gene methylation in cancer versus normal samples (TCGA). The individual probes are indicated. (B) Hypermethylation of PARK2 promoter in cancer versus normal samples (TCGA). Boxes show the quartiles (0.25 and 0.75) of the data, center lines show the median, and whiskers show the rest of the distribution except for outliers (1-sided paired sample rank-sum test P values are reported). 2 methylation 450 K probes are used. A P value is indicated. KIRC, kidney clear cell carcinoma; BRCA, breast adenocarcinoma; PRAD, prostate adenocarcinoma. (C) Kaplan-Meier curves for PARK2 hyper- or hypomethylation in patient cohorts (TCGA) of PRAD, pancreatic ductal adenocarcinoma (PAAD), liver hepatocellular carcinoma (LIHC), pheochromocytoma and paraganglioma (PCPG), or low-grade glioma (LGG, 2 independent PARK2 methylation probes). A P value per patient cohort is indicated (2-tailed unpaired t test). (D) Methylation-specific PCR amplification of PARK2 promoter region from PC3 or MDA231 cells approximately 200 bp upstream of the transcriptional start site in the presence or absence of the hypomethylating agent, decitabine. Mean ± SD (n = 3). (E) The indicated tumor cell lines were treated with vehicle or decitabine and analyzed for PRKN or IFN gene expression by RT-qPCR. Mean ± SD (n = 4). (F) The indicated human (PC3, DU145, MDA231) or murine (P3098) tumor cell lines were treated with vehicle (Veh) or decitabine (Dec) and analyzed by Western blotting. Numbers represent P values by 2-tailed unpaired t test.
Figure 3
Figure 3. Mechanisms of PRKN regulation of IFN signaling.
(A) The indicated human (PC3, DU145, MDA231) or murine (TRAMP-C2, MPTEN1, AT3) tumor cell lines expressing vector or PRKN were analyzed by Western blotting. (B) Aliquots of whole cell extracts (WCE) or conditioned medium (CM) harvested from PC3 cells expressing WT PRKN or C431S PRKN mutant were analyzed by Western blotting. (C) Aliquots of CM from PC3 cells expressing vector, WT PRKN, or PRKN C431S mutant were analyzed by ELISA. Mean ± SD (n = 3). (D) The indicated tumor cell lines were treated with vehicle (Veh) or decitabine (Dec) and aliquots of WCE or CM were analyzed by Western blotting. (E) Aliquots of CM from PRKN-expressing PC3 cells were analyzed by mass spectrometry in a volcano plot. Selected proteins in the PRKN secretome are indicated. OX, PRKN overexpression; EV, empty vector. (F and G) PRKN-expressing PC3 (top) or TRAMP-C2 (bottom) cells were transfected with control nontargeting siRNA (siCtrl) or HMGB1-directed siRNA (siHMGB1) and analyzed by Western blotting (F) or IFN gene expression by RT-qPCR (G). Mean ± SD (n = 3–5). (H and I) PC3 cells expressing vector or PRKN were transfected with 2 independent siRNA sequences targeting HMGB1 (siHMGB1 #1, siHMGB1 #2), reconstituted with Flag-HMGB1, and analyzed by Western blotting (H) or IFN gene expression by RT-qPCR (I). Mean ± SD (n = 3). Numbers represent P values by 2-tailed unpaired t test (C and G) or 2-way ANOVA (I).
Figure 4
Figure 4. Paracrine CD8 T cell activation by PRKN IFN signaling.
(A) Recipient PC3 cells were incubated with CM harvested from PC3 cells expressing vector, PRKN, or PRKN C431S mutant and analyzed for IFN gene expression by RT-qPCR. Mean ± SD (n = 4). Numbers represent P value by 2-way ANOVA. (B) Diagram of flow cytometry gating to characterize CD8+ (left) or CD4+ (right) T cell subsets from CD3+/CD19 splenocytes of C57BL/6 mice. Created with BioRender.com. (C) CD8+ T cells isolated from C57BL/6 splenocytes by negative selection were incubated with CM harvested from PRKN TetON TRAMP-C2 cells in the presence of vehicle or Doxy and analyzed by flow cytometry. Representative plots are shown. The percentage of cells in each quadrant is indicated. (D) The conditions are the same as in C and PRKN CM modulation of CD8+ T cell markers was quantified by flow cytometry in 5 independent experiments. Numbers represent P values by 2-tailed unpaired t test. (E and F) The conditions are the same as in C and double positive PD-1+/TCF1+ CD8+ T cells were analyzed by flow cytometry in representative density plots (E) and results were quantified in 6 independent experiments (F). (G) CD8+ T cells isolated from IFNAR1–/– splenocytes were incubated with CM harvested from PRKN TetON TRAMP-C2 cells as in C and analyzed by flow cytometry in representative density plots. The percentage of cells in each quadrant is indicated. (H) The conditions are the same as in G and modulation of the indicated CD8+ T cell markers was quantified in 6 independent experiments. (I and J) CD8+ T cells isolated from IFNAR1–/– splenocytes were analyzed for double-positive PD-1+/TCF1+ subsets by flow cytometry in representative density plots (I) and results were quantified in 6 independent experiments (J). The percentage of cells in each quadrant is indicated. Symbols indicate an individual determination.
Figure 5
Figure 5. PRKN deletion accelerates prostate tumorigenesis.
(A) Male TRAMP or TRAMP-PRKN–KO mice were analyzed for prostate tumor formation by IHC at 26 wks of age. (B) Representative macroscopic images of prostate tumors formed in TRAMP (29 wks) or TRAMP-PRKN KO (25 wks) mice. (C) Tumors harvested from TRAMP or TRAMP-PRKN–KO mice at 30 wks were analyzed for a disease severity (tumor size, hemorrhage, and seminal vesicle invasion; cutoff = 3). For panels A and C, the number of animals is indicated. (D) Prostate tissues from the indicated mouse groups at 26 wks were analyzed by H&E staining (left) or intratumoral accumulation of CD8+ T cells, by IHC (right). The percentage of cells is indicated. Representative images. Scale bar: 100 μm. (E) Plasma samples from C57BL/6 (WT), TRAMP, or TRAMP-PRKN–KO mice were analyzed for IFN-α (top) or IL6 (bottom) levels, by ELISA. Each point corresponds to an individual determination. (F) Prostate tissues from TRAMP or TRAMP-PRKN–KO mice were harvested at 26 wks and analyzed for the indicated immune cell subsets by flow cytometry. DC, dendritic cells; Mono, monocytes; Macro, macrophages. (G) The conditions are the same as in F and residual intratumoral CD8+ T cells were analyzed for expression of the indicated markers by flow cytometry. For all panels, mean ± SD. (H) The conditions are the same as in G and the percentage of TCF1+ CD8+ T cells was quantified in TRAMP or TRAMP-PRKN–KO mice (26 wks) by flow cytometry. Representative density plots are shown. (I) The conditions are the same as in G and geometrical mean fluorescence intensity for PD-1 (top) or LAG3 (bottom) expression in CD8+ T cells from TRAMP or TRAMP-PRKN–KO mice is indicated. Mean ± SD. Each point corresponds to an individual determination. Numbers represent P values by 2-tailed unpaired t test.
Figure 6
Figure 6. PRKN antitumor immunity.
(A) C57BL/6 (left) or nude Nu/Nu (right) mice were engrafted with syngeneic PRKN TetON AT3 cells in the mammary fat pad, and tumor growth was quantified with a caliper. Doxy (500 ng/mL) or vehicle (Veh) was administered in the drinking water (arrow) when tumors reached a volume of approximately 120–150 mm3. Each line is an individual tumor. Two independent experiments (Exp) with Nu/Nu mice are shown. (B) AT3 tumors (as in A) were quantified with a caliper at the end of the experiment. Veh, vehicle; B6, C57BL/6; Nu (Nu/Nu) mice. Mean ± SD. Veh-B6 (n = 10), Doxy-B6 (n = 8), Doxy-Nu (n = 8). (C) AT3 tumors grown in C57BL/6 mice in the presence of vehicle (Veh) or Doxy were analyzed by IHC or H&E staining. Scale bar: 50 μm. (D) CD8+ T cells harvested from PRKN TetON AT3 tumors in vehicle (Veh)- or Doxy-treated C57BL/6 mice were analyzed for the indicated markers by flow cytometry. Arrow indicates an outlier in TIM3 reactivity. (E and F). Intratumoral CD8+ T cells (as in D) were analyzed for double-positive PD1+/TCF1+ (E) or KLRG1+/GrzB+ (F) subsets by flow cytometry. Representative density plots are shown. The percentage of double-positive cells is indicated. For all panels, each point corresponds to an individual determination. (G) CD4+ T cells harvested from PRKN TetON AT3 tumors in vehicle (Veh)- or Doxy-treated C57BL/6 mice were analyzed for the indicated markers by flow cytometry. (H) C57BL/6 mice engrafted with syngeneic flank TRAMP-C2 tumors were administered vehicle (Veh) or decitabine (2.5 mg/kg daily) once tumors reached approximately 150 mm3 (arrow) and tumor growth was quantified with a caliper. (I) TRAMP-C2 tumors harvested from the indicated mouse group were analyzed by IHC. Representative images are shown. Scale bar: 50 μm. Numbers represent P values by 2-tailed unpaired t test.

Comment in

  • Parkin paves the path to antitumor immunity: Expanding Parkin’s role as a tumor suppressor

References

    1. McNab F, et al. Type I interferons in infectious disease. Nat Rev Immunol. 2015;15(2):87–103. doi: 10.1038/nri3787. - DOI - PMC - PubMed
    1. Tang D, et al. PAMPs and DAMPs: signal 0s that spur autophagy and immunity. Immunol Rev. 2012;249(1):158–175. doi: 10.1111/j.1600-065X.2012.01146.x. - DOI - PMC - PubMed
    1. Galluzzi L, et al. Immunogenic cell death in cancer and infectious disease. Nat Rev Immunol. 2017;17(2):97–111. doi: 10.1038/nri.2016.107. - DOI - PubMed
    1. Mills EL, et al. Mitochondria are the powerhouses of immunity. Nat Immunol. 2017;18(5):488–498. doi: 10.1038/ni.3704. - DOI - PubMed
    1. Weinberg SE, et al. Mitochondria in the regulation of innate and adaptive immunity. Immunity. 2015;42(3):406–417. doi: 10.1016/j.immuni.2015.02.002. - DOI - PMC - PubMed

MeSH terms

LinkOut - more resources