. 2024 Aug 30;10(35):eadn9857.
doi: 10.1126/sciadv.adn9857. Epub 2024 Aug 30.

Multi-armored allogeneic MUC1 CAR T cells enhance efficacy and safety in triple-negative breast cancer

Affiliations

Multi-armored allogeneic MUC1 CAR T cells enhance efficacy and safety in triple-negative breast cancer

Piril Erler et al. Sci Adv. .

Abstract

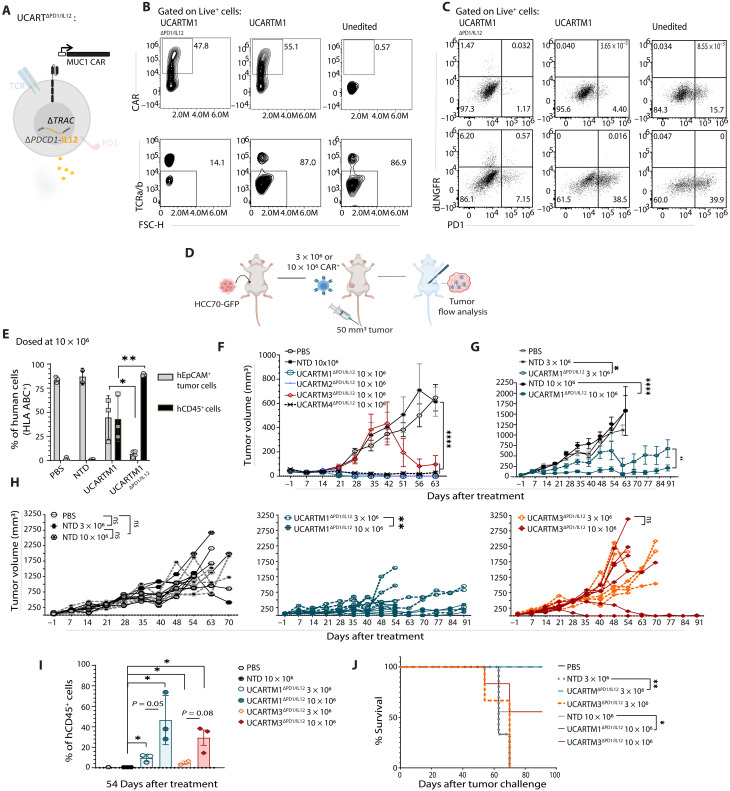
Solid tumors, such as triple-negative breast cancer (TNBC), are biologically complex due to cellular heterogeneity, lack of tumor-specific antigens, and an immunosuppressive tumor microenvironment (TME). These challenges restrain chimeric antigen receptor (CAR) T cell efficacy, underlining the importance of armoring. In solid cancers, a localized tumor mass allows alternative administration routes, such as intratumoral delivery with the potential to improve efficacy and safety but may compromise metastatic-site treatment. Using a multi-layered CAR T cell engineering strategy that allowed a synergy between attributes, we show enhanced cytotoxic activity of MUC1 CAR T cells armored with PD1KO, tumor-specific interleukin-12 release, and TGFBR2KO attributes catered towards the TNBC TME. Intratumoral treatment effectively reduced distant tumors, suggesting retention of antigen-recognition benefits at metastatic sites. Overall, we provide preclinical evidence of armored non-alloreactive MUC1 CAR T cells greatly reducing high TNBC tumor burden in a TGFB1- and PD-L1-rich TME both at local and distant sites while preserving safety.


Figures

Fig. 1.
Fig. 1.. CAR T cells engineered with tumor-specific MUC1 scFvs show dose-dependent killing in vitro.
(A) Design of the MUC1 CAR. (B) Flow cytometry analysis of CAR expression in T cells. The range is based on percentages observed in different donors (n = 3), staining was done with anti-human F(ab′)2 or anti-mouse F(ab′)2 based on the origin of the scFvs. (C) Flow cytometry analysis of MUC1 expression in breast cancer cell lines, with three different antibodies. (D) Cytotoxic assay with cocultures set up with different E:T ratios (n = 3). Each point represents a technical replicate. (E) Flow cytometry detection of MUC1 scFv-derived antibodies binding to healthy lung, kidney, and cervical epithelial primary cells and breast cancer cell lines. (F) Flow cytometry detection of MUC1 scFv-derived antibodies binding to healthy mammary epithelial primary cells and the HCC70 breast cancer cell line. (G) Tissue microarray IHC staining of breast cancer tumors with MUC1 scFv-derived antibodies and negative control.
Fig. 2.
Fig. 2.. PD1KO and IL-12 release equipped UCARTM1 show dose-dependent tumor control, T cell infiltration, and extended survival.
(A) Schematic representation of the non-alloreactive CAR T cell with TRAC and PDCD1 knockout via TALEN, and IL-12 knock-in (UCART∆PD1/IL12). Representative phenotyping of edited CAR T cells via flow cytometry analysis of (B) CAR expression, TCRa/b knockout, (C) PD1 knockout, and IL12/dLNGFR insertion detected with PMA/ionomycin activation (top panels; no PMA/ionomycin treatment, bottom panels; with PMA/ionomycin treatment). (D) Design of in vivo experiments. (E) Flow cytometry analysis of PBS-, NTD∆PD1/IL12-, UCARTM1-, and UCARTM1∆PD1/IL12-treated cohorts for EpCAM+ and hCD45+ cells among HLA-ABC+ human cells engrafted, 77 days after treatment (n = 2 to 4 per cohort). (F) Tumor growth curve for cohorts treated with UCARTM1∆PD1/IL12, UCARTM2∆PD1/IL12, UCARTM3∆PD1/IL12, UCARTM4∆PD1/IL12, and NTD (n = 10 per cohort) or PBS (n = 5). (G) Tumor growth curve for cohorts treated with PBS (n = 4), different doses of NTD, and UCARTM1∆PD1/IL12 (n = 6 per cohort). (H) Individual tumor growth. (I) Flow cytometry analysis of percent hCD45+ cells in tumors. (J) Kaplan-Meier survival analysis of cohorts treated with either PBS (n = 3) or different doses of NTD, UCARTM3∆PD1/IL12, and UCARTM1∆PD1/IL12 (n = 3 to 6 per cohort). Each point represents a biological replicate for (E) to (I) and statistical significance was calculated using unpaired t test. Each point represents a biological replicate for (F) to (H) and mixed-effects analysis was performed for comparisons over time for tumor growth. Statistical significance was calculated using the log-rank Mantel-Cox test for the survival curve in (J). *P < 0.05, **P ≤ 0.01, ****P ≤ 0.0001, ns (not significant) indicates P > 0.05. Treatments were done using 3 × 10⁶ or 10 × 106 CAR+ cells as indicated on each graph.
Fig. 3.
Fig. 3.. Intratumoral administration of the UCARTM1 increases tumor control while still recognizing antigen at secondary site.
(A) Design of in vivo experiment. (B) Tumor growth of cohorts treated intratumorally with UCARTM1 (n = 4) or NTD (n = 2) and their matched contralateral tumors that are treated with PBS (UCARTM1 engineered using donor 1). Experiment repeated with donor 2 is shown in the Supplementary Materials. (C) Dissection images and comparison of tumor weight for tumors treated with UCARTM1, NTD, or PBS. (D) Tumor growth curve comparison of tumors treated intratumorally with 5 million UCARTM1 (n = 4) or NTD (n = 2) and intravenously with 5 million UCARTM1 (n = 5), NTD (n = 5), or PBS (n = 5) (UCARTM1 engineered using donor 1). (E) Tumor weight comparison of tumors treated with 5 × 10⁶ UCARTM1 either intratumorally or intravenously (n = 3 to 4). (F) Flow cytometry analysis of the number of hCD45+ cells per EpCAM+ cells per gram of tumor tumors treated with UCARTM1 and their matched contralateral PBS (n = 4). (G) Immunohistochemistry analysis of hCD45+ cells in tumors in the tumors treated with UCARTM1, NTD, and their matched contralateral PBS. (H) Flow cytometry detection of CD8+ among the hCD45+CAR+ cells in tumors treated with UCARTM1 and their matched contralateral PBS (n = 4). (I) Immunohistochemistry analysis of hCD45+ cells spleens of the cohorts treated with UCARTM1 and staining control. (J) Flow cytometry analysis of PB collected from intratumorally treated UCARTM1 (n = 4) and NTD (n = 2) cohorts for days 26, 40, and 80. Each point represents a biological replicate for (B) to (J). Statistical significance was calculated using unpaired t test for (C), (E), (H), and (J). Two-way ANOVA was performed for comparisons over time for tumor growth in (D). *P < 0.05, **P ≤ 0.01, ***P ≤ 0.001, ****P ≤ 0.0001, ns (not significant) indicates P > 0.05. All treatments were done using 5 × 10⁶ CAR+ cells.
Fig. 4.
Fig. 4.. TGFBR2KO armored UCARTM1 shows resistance to inhibitory effects of TGFB1.
(A) Schematic representation of the non-alloreactive CAR T cell with TRAC and TGFBR2 knockout with TALEN (UCARTM1∆TGFBR2). (B) Functional phenotyping of TGFBR2 knockout edited UCARTM1 compared to the unedited UCARTM1 via flow cytometry analysis of pSMAD2/3 staining in the presence of TGFB1. (C) Flow cytometry analysis of the percentage of CD25+ cells present in UCARTM1 and UCARTM1∆TGFBR2 following activation with MUC1 recombinant protein, in the presence or absence of TGFB1 (n = 2). Statistical significance was calculated using unpaired t test. (D) Proliferation assay for MUC1 recombinant protein activated UCARTM1 and UCARTM1∆TGFBR2 in the presence or absence of TGFB1 at days 0, 4, 6, 8, and 11 (n = 2 technical replicates per time point). Statistical significance was determined using a two-way ANOVA. (E) Design of in vivo experiment and individual tumor growth comparison of tumors treated intravenously with 5 million UCARTM1∆TGFBR2, UCARTM1, NTD, or PBS (n = 4 to 5 per cohort) for donor 1. Experiment repeated with donor 2 is shown in the Supplementary Materials. Two-way ANOVA was performed for comparisons over time for tumor growth. (F) Design of in vivo experiment, individual tumor growth comparison of tumors, and (G) Kaplan-Meier survival analysis of cohorts treated intratumorally with 2 million UCARTM1∆TGFBR2 (n = 4), UCARTM1 (n = 4), NTD (n = 2), or PBS (n = 3). Each point represents a biological replicate for (E) to (G). Statistical significance was calculated using mixed-effects analysis comparisons over time for tumor growth and the log-rank Mantel-Cox test. *P < 0.05, **P ≤ 0.01, ***P ≤ 0.001, ****P ≤ 0.0001, ns (not significant) indicates P > 0.05. (H) TGFB1 ELISA analysis of HCC70-GFP tumors averaging 50 to 100, 250, 450, and 600 mm3 per mm3 of tumor (n = 2 to 6). Each point represents a biological replicate. Treatments were done using 2 × 10⁶ or 5 × 10⁶ CAR+ cells as indicated on each in vivo design.
Fig. 5.
Fig. 5.. PD1KO/IL-12KI and TGFBR2KO armored CAR T cells clear tumors within weeks without relapse with less CAR T cell expansion.
(A) Schematic representation of the non-alloreactive CAR T cell with TRAC, PDCD1, and TGFBR2 knockouts and IL-12 knock-in. (B) Proliferation assay of MUC1 recombinant protein–activated UCARTM1∆PD1/IL12 and UCARTM1∆PD1/IL12; ∆TGFBR2 with or without TGFB1 (n = 2 technical replicates per time point). Two-way ANOVA was performed for statistical significance over time. (C) Cytotoxic assay of T47D cells cocultured with NTD, UCARTM1, UCARTM1∆TGFBR2, UCARTM1∆PD1/IL12, and UCARTM1∆PD1/IL12; ∆TGFBR2in the presence of TGFB1 with a 10-to-1 E:T ratio. CAR T cells were rechallenged after 24 hours (n = 3). Each point represents a technical replicate. Statistical significance was calculated using unpaired t test. (D) Design of in vivo experiment. (E) Tumor growth curve for cohorts intravenously treated with 5 million UCARTM1∆PD1/IL12; ∆TGFBR2, UCARTM1∆PD1/IL12, UCARTM1∆TGFBR2, UCARTM1, NTD, or PBS (n = 5 to 6 per cohort) and (F) flow cytometry analysis of PB collected from all cohorts, 40 days after treatment for number and percent of hCD45+ cells. Two-way ANOVA was performed for comparisons for tumor growth, and ordinary one-way ANOVA was performed to determine the statistical significance for (F). (G) Color mapping of tumor clearance and inflammation in the mammary glands of UCARTM1∆PD1/IL12- and UCARTM1∆PD1/IL12; ∆TGFBR2-treated cohorts (n = 5 and 6, consecutively) and representative dissection images of tumor cell injected (inj.) and no tumor cell injected mammary fat pad (MFP) (Control; Ctrl) of one animal each. (H) Kaplan-Meier survival analysis of cohorts treated with UCARTM1∆PD1/IL12; ∆TGFBR2, UCARTM1∆PD1/IL12, UCARTM1∆TGFBR2, UCARTM1, NTD, or PBS (n = 4 to 6 per cohort). Each point represents a biological replicate for (E) to (G). Statistical significance was calculated using the log-rank Mantel-Cox test in (H). *P < 0.05, **P ≤ 0.01, ****P ≤ 0.000, ns (not significant) indicates P > 0.05. All treatments were done using 5 × 10⁶ CAR+ cells.
Fig. 6.
Fig. 6.. Intratumoral administration of UCARTM1∆PD1/IL12; ∆TGFBR2 remarkably reduces large tumors even at distant sites and extends survival.
(A) Design of in vivo experiment. (B) Tumor growth curve (n = 9 to 11, pooled from two experiments using the same donor) and representative tumor images at termination; (C) tumor weight comparison of cohorts intratumorally treated with 1 million UCARTM1∆PD1/IL12; ∆TGFBR2, UCARTM1∆PD1/IL12, or NTD and their matched contralateral PBS tumors (n = 2 to 6). Each point represents a biological replicate. Statistical significance was calculated using mixed-effects analysis comparisons over time for tumor growth. Flow cytometry analysis of tumors (D) for total number of EpCAM+ cells and (E) the number of hCD45+ cells per EpCAM+ cells found per gram of tumor in UCARTM1∆PD1/IL12; ∆TGFBR2-, UCARTM1∆PD1/IL12-, UCARTM1-, or NTD-treated cohorts and their matched contralateral PBS tumors (n = 2 to 3). (F) Immunohistochemistry analysis of hCD8+ and GFP+ tumor cells in UCARTM1∆PD1/IL12; ∆TGFBR2 or UCARTM1∆PD1/IL12 and their matched contralateral PBS tumors on day 49 after treatment (n = 3). Each point represents a biological replicate for (D) to (F). Statistical significance was calculated using unpaired t test for (D) and (E). (G) Kaplan-Meier survival analysis of cohorts treated with 1 million UCARTM1∆PD1/IL12; ∆TGFBR2, UCARTM1∆PD1/IL12, or NTD (n = 5 to 10 per cohort, pooled from two experiments using the same donor). Statistical significance was calculated using the log-rank Mantel-Cox test for (G). *P < 0.05, **P ≤ 0.01, ***P ≤ 0.001, ns (not significant) indicates P > 0.05. All treatments were done using 1 × 10⁶ CAR+ cells.
Fig. 7.
Fig. 7.. Synergy of the attributes limit off tumor CAR T cells and IL-12.
(A) Flow cytometry analysis of PB, 26 days after treatment for the percent and the number of hCD45+ and hCD45+CD8+ cells per microliter of PB for NTD-, UCARTM1∆PD1/IL12-, or UCARTM1∆PD1/IL12; ∆TGFBR2-treated cohorts (n = 3 to 4). (B) Spleen weight comparison of NTD-, UCARTM1∆PD1/IL12-, or UCARTM1∆PD1/IL12; ∆TGFBR2-treated cohorts (n = 2 to 6). (C) Flow cytometry analysis of spleens for the percent and the number of hCD45+ cells in cohorts treated with NTD, UCARTM1∆PD1/IL12, or UCARTM1∆PD1/IL12; ∆TGFBR2 (n = 2 to 3). (D) Flow cytometry analysis of PB for UCARTM1∆PD1/IL12; ∆TGFBR2-, UCARTM1∆PD1/IL12-, or NTD-treated cohorts for percent and number of hCD45+dLNGFR+ cells (n = 3 to 4). (E) Flow cytometry analysis of hCD45+ for % of dLNGFR+ cells on day 49 in PB and the corresponding IL-12 and IFN G ELISA analysis of blood serum collected from UCARTM1∆PD1/IL12- and UCARTM1∆PD1/IL12; ∆TGFBR2-treated cohorts at 49 days after treatment (n = 3 to 4). NTD blood serum shown is collected on day 26 (controls reached termination). Each point represents a biological replicate for (A) to (E). Statistical significance was calculated using unpaired t test or ordinary one-way ANOVA. *P < 0.05, **P ≤ 0.01, ***P ≤ 0.001, ****P ≤ 0.0001, ns (not significant) indicates P > 0.05.

References

    1. Harbeck N., Penault-Llorca F., Cortes J., Gnant M., Houssami N., Poortmans P., Ruddy K., Tsang J., Cardoso F., Breast cancer. Nat. Rev. Dis. Primers. 5, 66 (2019). - PubMed
    1. Kumar P., Aggarwal R., An overview of triple-negative breast cancer. Arch. Gynecol. Obstet. 293, 247–269 (2016). - PubMed
    1. Bianchini G., De Angelis C., Licata L., Gianni L., Treatment landscape of triple-negative breast cancer—Expanded options, evolving needs. Nat. Rev. Clin. Oncol. 19, 91–113 (2022). - PubMed
    1. Dees S., Ganesan R., Singh S., Grewal I. S., Emerging CAR-T cell therapy for the treatment of triple-negative breast cancer. Mol. Cancer Ther. 19, 2409–2421 (2020). - PubMed
    1. Sterner R. C., Sterner R. M., CAR-T cell therapy: Current limitations and potential strategies. Blood Cancer J. 11, 69 (2021). - PMC - PubMed

Publication types

MeSH terms

LinkOut - more resources