. 2024 Sep 11;32(9):1488-1501.e5.
doi: 10.1016/j.chom.2024.08.003. Epub 2024 Aug 29.

Metabolic immaturity and breastmilk bile acid metabolites are central determinants of heightened newborn vulnerability to norovirus diarrhea

Affiliations

Metabolic immaturity and breastmilk bile acid metabolites are central determinants of heightened newborn vulnerability to norovirus diarrhea

Amy M Peiper et al. Cell Host Microbe. .

Abstract

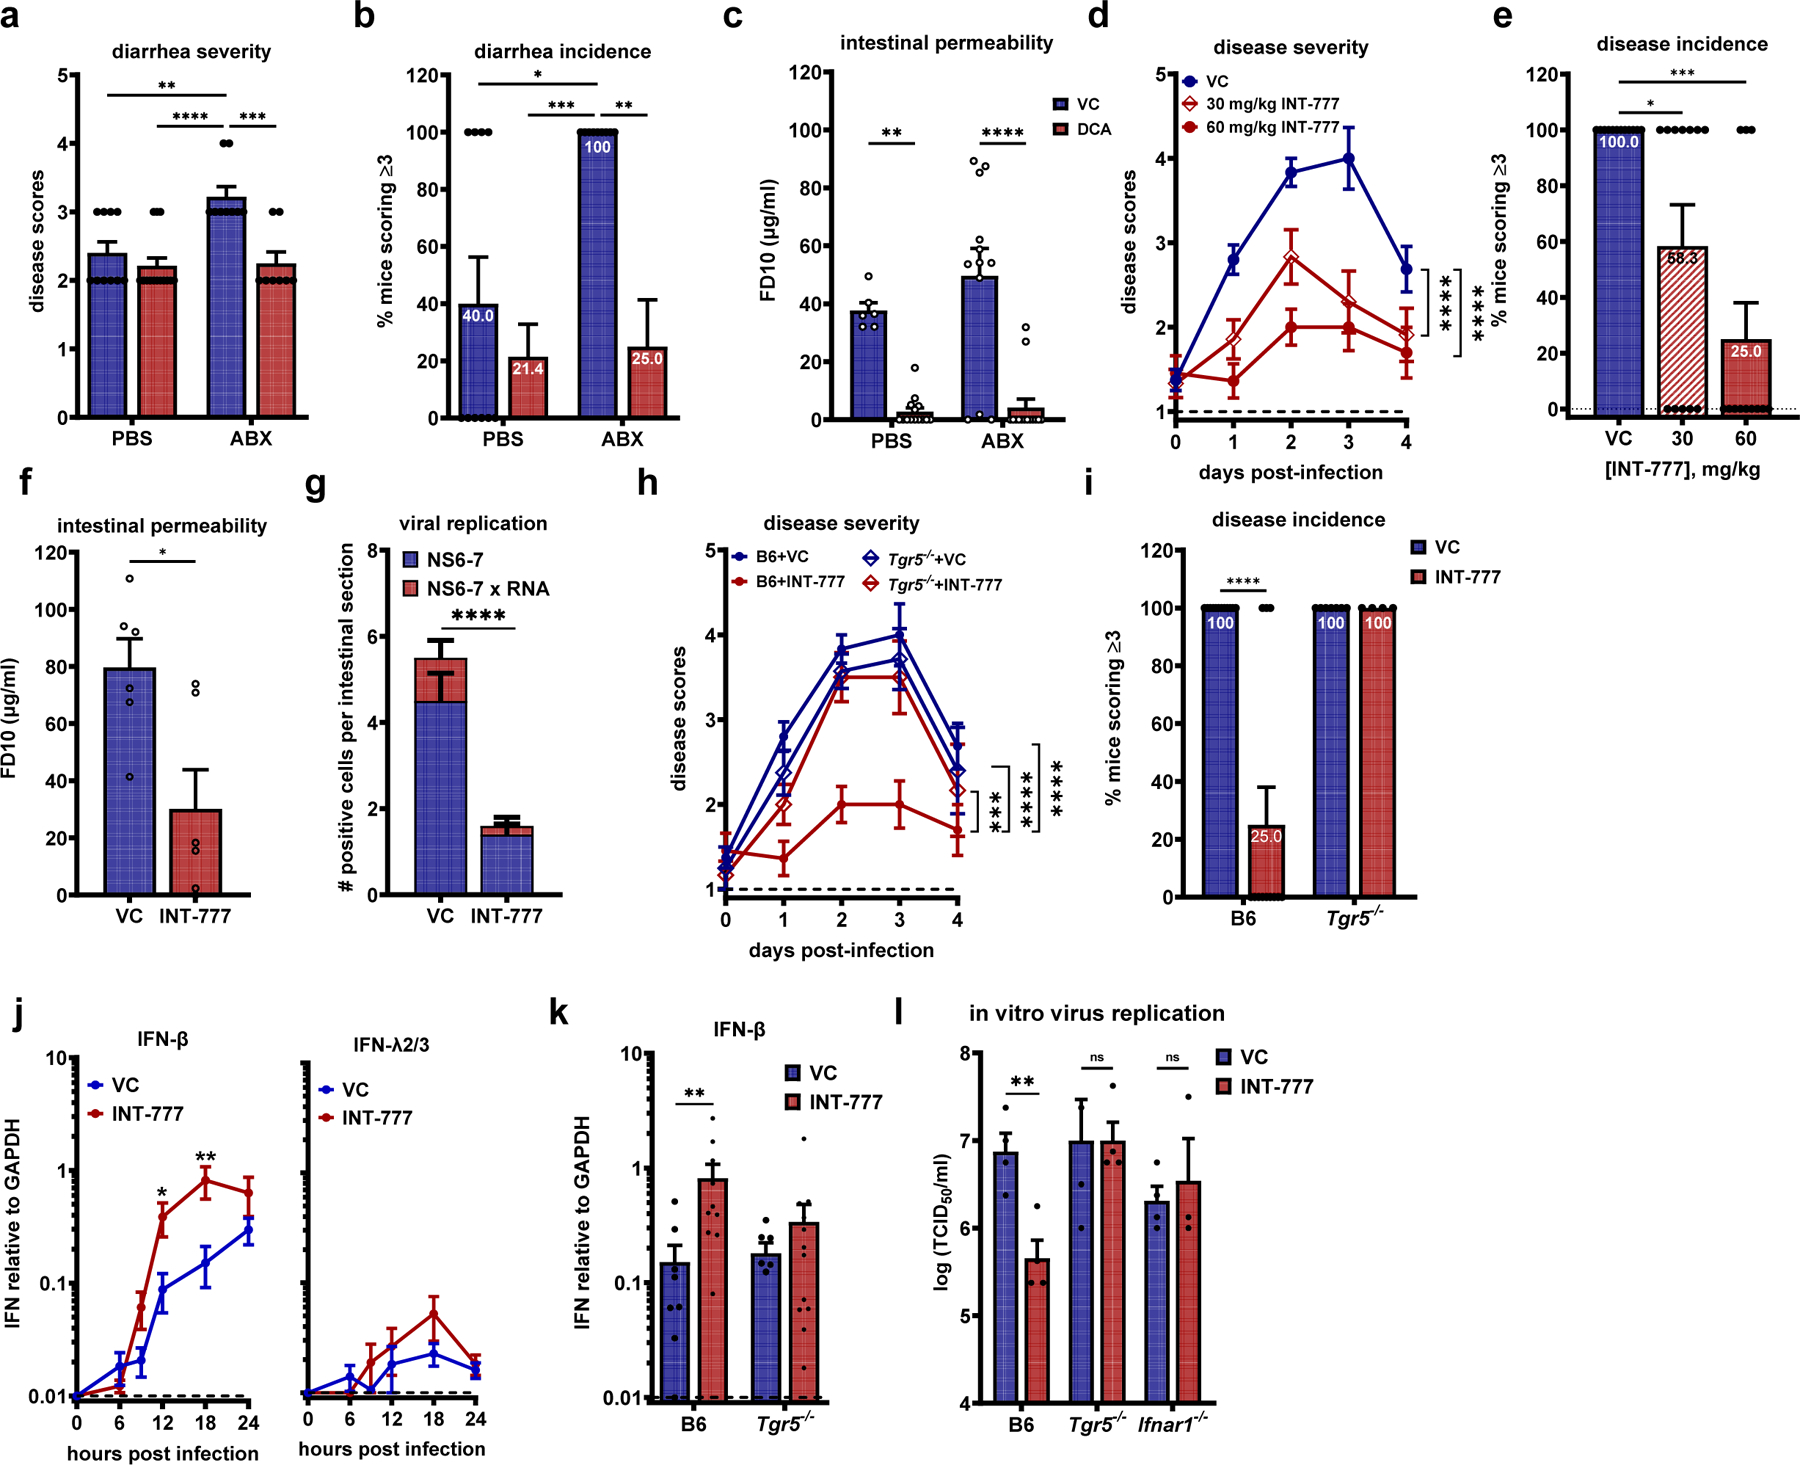
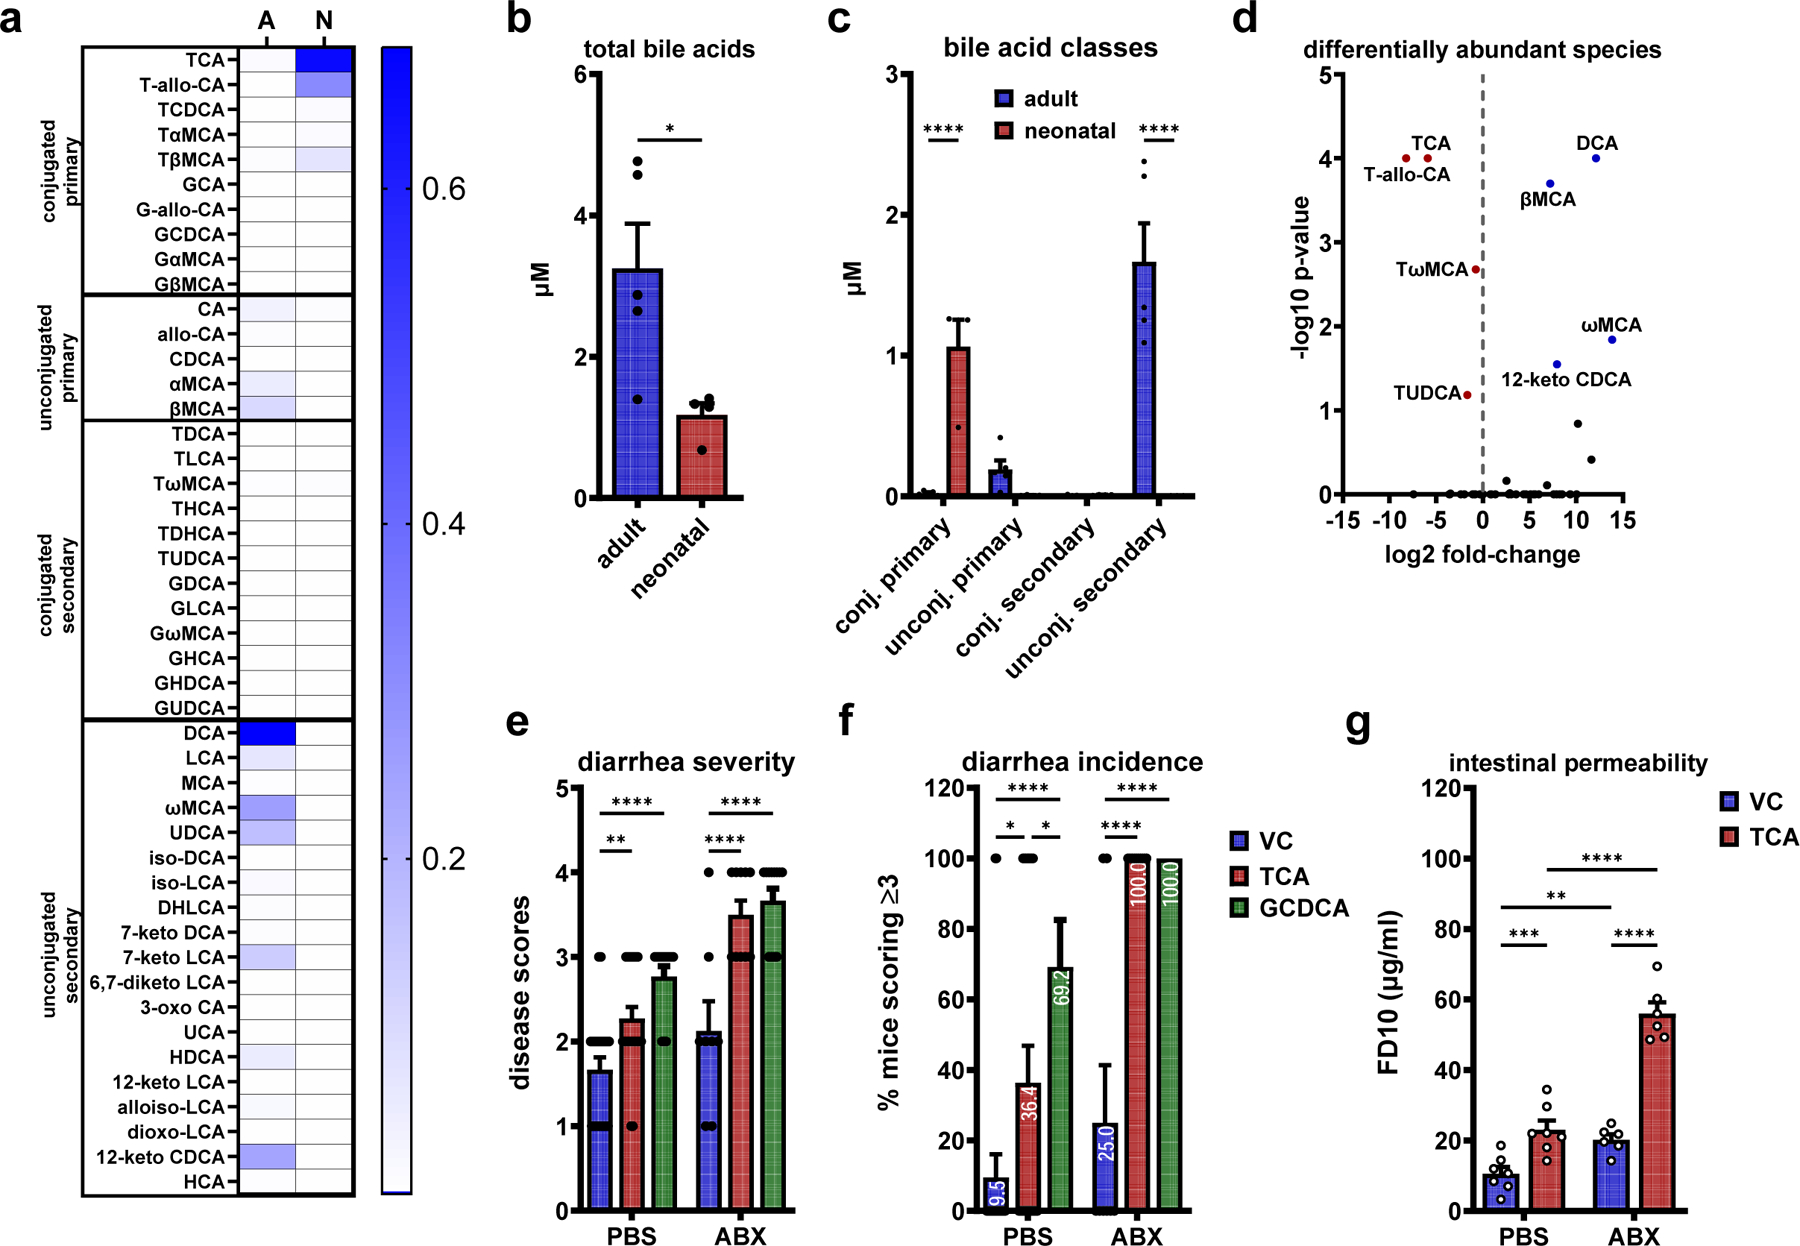
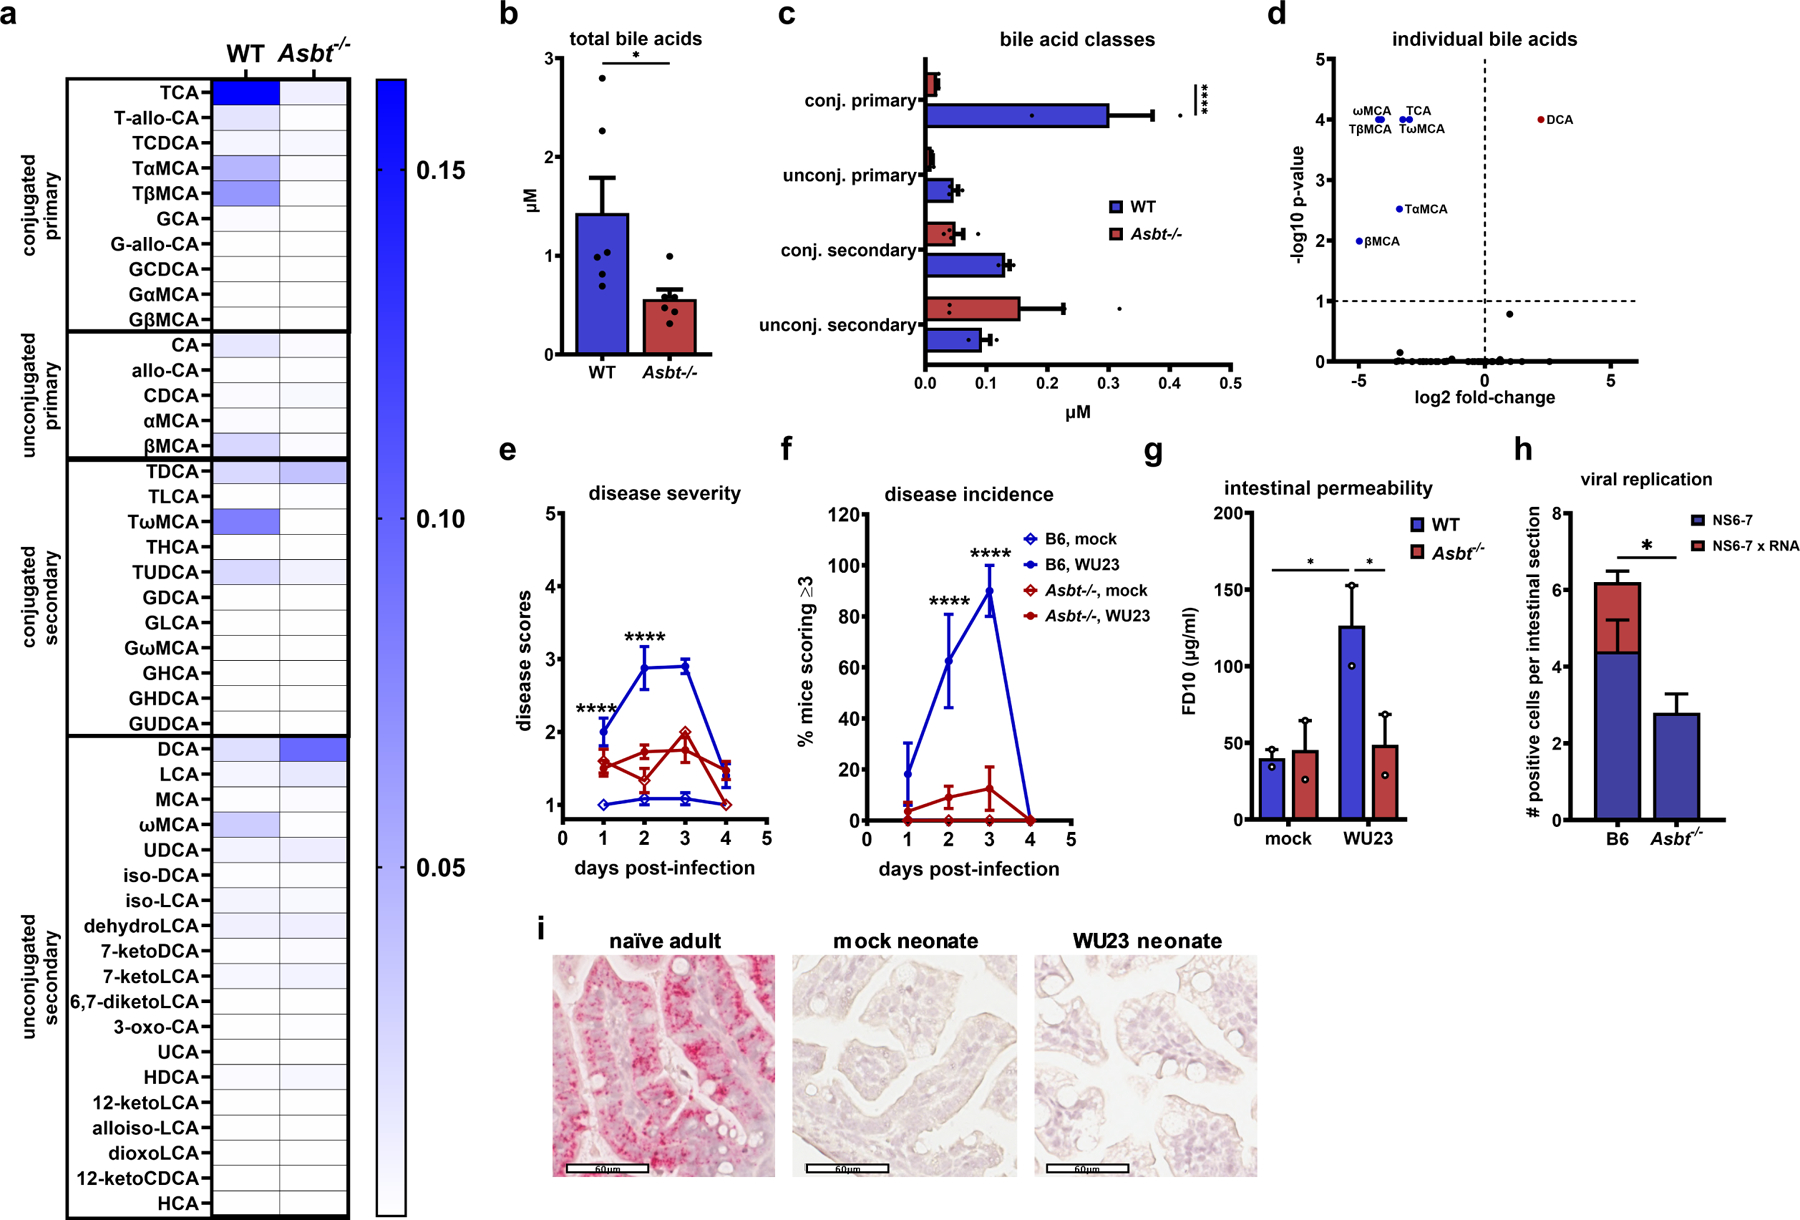
The pathogenic outcome of enteric virus infections is governed by a complex interplay between the virus, intestinal microbiota, and host immune factors, with metabolites serving as a key mediator. Noroviruses bind bile acid metabolites, which are produced by the host and then modified by commensal bacteria. Paradoxically, bile acids can have both proviral and antiviral roles during norovirus infections. Working in an infant mouse model of norovirus infection, we demonstrate that microbiota and their bile acid metabolites protect from norovirus diarrhea, whereas host bile acids promote disease. We also find that maternal bile acid metabolism determines the susceptibility of newborn mice to norovirus diarrhea during breastfeeding. Finally, targeting maternal and neonatal bile acid metabolism can protect newborn mice from norovirus disease. In summary, neonatal metabolic immaturity and breastmilk bile acids are central determinants of heightened newborn vulnerability to norovirus disease.

Keywords: ASBT; bile acids; breastmilk metabolites; enteromammary; gut-mammary; microbial metabolites; microbiota; neonatal infections; newborn infections; norovirus.


Conflict of interest statement

Declaration of interests The authors declare no competing interests.

Figures

Figure 1.
Figure 1.. Microbiota-mediated bile acid metabolism protects neonates from severe MNV diarrhea.
a-b) Neonatal B6 mice were treated with PBS or ABX via i.g. injection at P2, infected i.g. with 1 x 10⁷ TCID50 units of WU23 or mock inoculum at P3, and treated with PBS or ABX again at P4. Mice were monitored for disease severity (a) and incidence (b) for 3 dpi. c) To measure intestinal permeability, PBS- or ABX-treated neonates infected i.g. with 1 x 10⁷ TCID50 units of WU23 or mock inoculum were administered 40 mg/kg FD10 via i.g. injection at 69 hpi and the level of FD10 in serum measured at 72 hpi. d) Intestinal sections from PBS- and ABX-treated, WU23-infected neonates were assessed for viral replication at 18 hpi by enumerating NS6–7 positive (blue bars) and NS6–7 x viral genome double-positive (red bars) cells. e) Germ-free B6 neonates were treated with PBS or ABX at P2 and P4 and infected with 1 x 10⁷ TCID50 units of WU23 or mock inoculum at P3. Disease incidence was measured at 2 dpi. f-g) Neonatal B6 mice administered PBS or ABX 1 d before and 1 d after infection were infected with 1 x 10⁷ TCID50 units of WU23 on P5, P7, or P10. Mice were monitored for disease severity (f) and incidence (g) up to 7 dpi. h-i) B6 neonates were administered ABX at P2, reconstituted with 1 x 10⁶ CFU of C. scindens or bacterial media at P3, and infected with 1 x 10⁷ TCID50 units of WU23 at P5. They were monitored for disease severity (h) and incidence (i) for 3 dpi. j-k) B6 neonates were administered ABX at P2, reconstituted with 1 x 10⁶ CFU of C. scindens at P3, treated with 75 mg/kg of CAPE, 90 mg/kg of AAA-10, or vehicle control at P4 and P6, and infected with 1x10⁷ TCID50 units of WU23 at P5. Mice were monitored for disease severity (j) and incidence (k) for 3 dpi. Statistical significance was calculated using 2-way ANOVA with Tukey’s multiple comparison test for all panels. Due to the nature of our fecal scoring system which requires that a pup defecate upon stomach palpation at each time point in order to generate material to be scored, group sizes differ by time point. Precise group sizes per time point per condition are detailed in Supplemental Data Table 2.
Figure 2.
Figure 2.. Activation of the bile acid receptor TGR5 protects from MNV disease.
a-b) B6 neonatal mice were treated with PBS or ABX at P2, P4, and P6, administered 70 µg/g of DCA or vehicle control (VC) at P3, P4, and P5 via i.g. injection, and infected with 1 x 10⁷ TCID50 units of WU23 at P5.5. Disease severity (a) and incidence (b) were determined at 2 dpi. c) Separate groups of mice treated in the same manner were used to assess intestinal permeability by administering 40 mg/kg FD10 at 45 hpi and measuring FD10 in serum at 48 hpi. d-e) Neonatal B6 mice were treated with VC, 30 mg/kg INT-777, or 60 mg/kg INT-777 at P2, P3, P4 and P6 via i.g. injection, and infected at P5 with 5 x 10⁷ TCID50 units of WU23. Mice were monitored for disease severity for 4 dpi (d). The incidence at 2 dpi is shown (e). f) Pups treated in the same manner were used to assess intestinal permeability. g) Intestinal sections from INT-777- and VC-treated, WU23-infected neonates were assessed for viral replication at 18 hpi by enumerating NS6–7 positive (blue bars) and NS6–7 x viral genome double-positive (red bars) cells. h-i) P3 B6 or Tgr5−/− neonatal mice were treated with VC or 60 mg/kg of INT-777 at P2, P3, P4, and P6 and infected with 5 x 10⁷ TCID50 units of WU23 at P5. Mice were monitored for disease severity for 4 dpi (h). The incidence at 2 dpi is shown (i). j) B6 neonatal mice were treated with VC or 60 mg/kg of INT-777 at P2, P3 and P4 and infected with 5 x 10⁷ TCID50 units of WU23 at P5. Portions of the small intestine were harvested at the indicated time points. IFN-β and IFN-λ2/3 expression levels were determined using quantitative RT-PCR and normalized to the GAPDH housekeeping gene. k) Small intestinal tissue collected from B6 and Tgr5−/− mice treated in the same manner and collected at 18 hpi were analyzed for IFN-β expression. l) Primary macrophages prepared from wild-type B6, Tgr5, or Ifnar1 bone marrow were treated with 300 μM INT-777 for 6 h and then infected with MOI 0.05 WU23. Virus titers were determined at the indicated time points. Statistical significance was calculated using 2-way ANOVA with Tukey’s multiple comparison test for all panels. Precise group sizes per time point per condition are detailed in Supplemental Data Table 2.
Figure 3.
Figure 3.. Host-derived bile acids exacerbate MNV disease.
a-d) Fecal samples were collected from individual B6 adult mice (A) or pooled P4 B6 litters (neonatal; N) and bile acid profiling was performed with UPLC-MS. A heatmap showing the mean concentrations of individual bile acids (a), the abundance of total bile acid pools (b), the abundance of bile acid categories (c), and the abundance of individual bile acids that were statistically different between groups (d) are shown. e-f) B6 neonatal mice were treated with PBS or ABX at P2, P4, and P6, administered 70 µg/g of TCA, GCDCA, or VC at P3, P4, and P5 via i.g. injection, and infected with 1 x 10⁶ TCID50 units of WU23 at P5.5. Disease severity (e) and incidence (f) were determined at 2 dpi. g) Separate groups of mice treated in the same manner were used to assess intestinal permeability at 48 hpi. Statistical significance was calculated using an unpaired student t-test (b) and 2-way ANOVA with Tukey’s multiple comparison test (d-g). Precise group sizes per time point per condition are detailed in Supplemental Data Table 2.
Figure 4.
Figure 4.. The main intestinal bile acid transporter ASBT determines breastmilk bile acid pools and neonatal susceptibility to MNV.
a-d) Breastmilk samples were collected daily from naïve B6 or Asbt−/− lactating dams for 4 consecutive days and bile acid profiling was performed with UPLC-MS. A heatmap showing the mean concentrations of individual bile acids (a), the abundance of total bile acid pools (b), the abundance of bile acid categories (c), and the abundance of individual bile acids that were statistically different between groups (d) are shown. e-f) B6 or Asbt−/− P3 mice were infected with 1 x 10⁷ TCID50 units of WU23 or mock inoculum. Mice were monitored for disease severity (e) and incidence (f) for 4 dpi. g) To measure intestinal permeability, B6 or Asbt−/− P3 mice were infected with 1 x 10⁷ TCID50 units of WU23 or mock inoculum, 40 mg/kg FD10 was administered at 45 hpi, and the level of FD10 in serum measured at 48 hpi. Serum was pooled from whole litters for analysis. h) Intestinal sections from WU23-infected B6 and Asbt−/− neonates were assessed for viral replication at 18 hpi by enumerating NS6–7 positive (blue bars) and NS6–7 x viral genome double-positive (red bars) cells. i) Intestinal tissue sections were collected from naïve adult B6 mice and from neonatal B6 mice infected with 1 x 10⁸ TCID50 units of WU23 or mock inoculum at 18 hpi and hybridized with an ASBT-specific RNAscope probe. Representative images are shown. Statistical significance was calculated using an unpaired t-test (b) and 2-way ANOVA with Tukey’s multiple comparison test (c-i). Precise group sizes per time point per condition are detailed in Supplemental Data Table 2.
Figure 5.
Figure 5.. Maternal bile acids delivered via breast milk promote norovirus diarrhea in the neonatal host.
a-b) B6 or Asbt−/− neonatal mice fostered by dams of the same or opposite genotype at birth were infected with 1 x 10⁷ TCID50 units of WU23 at P3. Disease severity (a) and incidence (b) were determined at 2 dpi. c-e) Breastmilk samples were collected daily from lactating dams fed standard chow (SC) or chow supplemented with 2% of the bile acid sequestrant (BAS) cholestyramine beginning the day she gave birth and bile acid profiling was performed with UPLC-MS. A heatmap showing the mean concentrations of individual bile acids (c), the abundance of total bile acid pools (d), and the abundance of individual bile acids that were statistically different between groups (e) are shown. f-g) Neonates from dams fed either SC or chow supplemented with 2% or 5% BAS were infected with 1 x 10⁷ TCID50 units of WU23 or mock inoculum at P5. Disease severity (f) and incidence (g) were determined at 2 dpi. h-i) Asbt−/− neonates were administered 70 µg/g of TCA (or vehicle control at P3, P4, and P5 and infected with 1x10⁷ TCID50 units of WU23 at P5.5. Disease severity (h) and incidence (i) were determined at 2 dpi. j) The proportion of major bile acid classes in the total bile acid pool was compared between naïve B6 mouse breastmilk and human breastmilk samples. k-l) B6 or Asbt−/− neonatal mice fostered by dams of the same or opposite genotype at birth were administered 10 mg/kg anti-CD3 mAb or isotype control mAb subcutaneously at P2. k) At P3, intestinal sections were hematoxylin-eosin (H&E)-stained. Representative microscopic images of the distal small intestine are shown. Scale bars, 60 μm. l) At P3, pups were administered 40 mg/kg FD10 intragastrically and systemic FD10 levels measured 3 h later. m) Pregnant dams were fed standard chow (SC) or chow supplemented with 5% bile acid sequestrant cholestyramine (BAS) for one week prior to birth. P2 neonates were administered 10mg/kg anti-CD3 mAb or isotype control antibody and assessed for intestinal permeability at P3 using the FD10 assay. Statistical significance was calculated using a 2-way ANOVA with Tukey’s multiple comparison test (panels a, b, f, g, l, and m) and unpaired student t-tests (panels d, h, and i). Precise group sizes per time point per condition are detailed in Supplemental Data Table 2.

Update of

References

    1. Koo HL, Neill FH, Estes MK, Munoz FM, Cameron A, Dupont HL, and Atmar RL (2013). Noroviruses: The Most Common Pediatric Viral Enteric Pathogen at a Large University Hospital After Introduction of Rotavirus Vaccination. J Pediatric Infect Dis Soc 2, 57–60. 10.1093/jpids/pis070. - DOI - PMC - PubMed
    1. Patel MM (2008). Systematic Literature Review of Role of Noroviruses in Sporadic Gastroenteritis. Emerg. Infect. Dis 14, 1224–1231. 10.3201/eid1408.071114. - DOI - PMC - PubMed
    1. Ahmed SM, Hall AJ, Robinson AE, Verhoef L, Premkumar P, Parashar UD, Koopmans M, and Lopman BA (2014). Global prevalence of norovirus in cases of gastroenteritis: a systematic review and meta-analysis. The Lancet Infectious Diseases 14, 725–730. 10.1016/S1473-3099(14)70767-4. - DOI - PMC - PubMed
    1. Alard P (2011). Gut microbiota, immunity, and disease: a complex relationship. Front. Microbio 2, 180. 10.3389/fmicb.2011.00180. - DOI - PMC - PubMed
    1. Thaiss CA, Zmora N, Levy M, and Elinav E (2016). The microbiome and innate immunity. Nature 535, 65–74. 10.1038/nature18847. - DOI - PubMed

Substances

LinkOut - more resources