. 2024 Sep 9;42(9):1614-1629.e5.
doi: 10.1016/j.ccell.2024.08.002. Epub 2024 Aug 29.

Distinct clinical outcomes and biological features of specific KRAS mutants in human pancreatic cancer

Affiliations

Distinct clinical outcomes and biological features of specific KRAS mutants in human pancreatic cancer

Caitlin A McIntyre et al. Cancer Cell. .

Abstract

KRAS mutations in pancreatic ductal adenocarcinoma (PDAC) are suggested to vary in oncogenicity but the implications for human patients have not been explored in depth. We examined 1,360 consecutive PDAC patients undergoing surgical resection and find that KRASG12R mutations are enriched in early-stage (stage I) disease, owing not to smaller tumor size but increased node-negativity. KRASG12R tumors are associated with decreased distant recurrence and improved survival as compared to KRASG12D. To understand the biological underpinnings, we performed spatial profiling of 20 patients and bulk RNA-sequencing of 100 tumors, finding enhanced oncogenic signaling and epithelial-mesenchymal transition (EMT) in KRASG12D and increased nuclear factor κB (NF-κB) signaling in KRASG12R tumors. Orthogonal studies of mouse KrasG12R PDAC organoids show decreased migration and improved survival in orthotopic models. KRAS alterations in PDAC are thus associated with distinct presentation, clinical outcomes, and biological behavior, highlighting the prognostic value of mutational analysis and the importance of articulating mutation-specific PDAC biology.

Keywords: KRAS; clinical outcomes; genomics; organoids; pancreatic cancer; spatial transcriptomics.


Conflict of interest statement

Declaration of interests E.M.O., research funding: Genentech/Roche, BioNTech, AstraZeneca, Arcus, Elicio, Parker Institute, NIH/NCI, Pertzye; consulting/DSMB: Boehringer Ingelheim, BioNTech, Ipsen, Merck, Novartis, AstraZeneca, BioSapien, Astellas, Thetis, Autem, Novocure, Neogene, BMS, Tempus, Fibrogen, Merus, Agios (spouse), Genentech-Roche (spouse), Eisai (spouse). G.M.C.:A full listing of G.M.C.’s interests can be found at http://arep.med.harvard.edu/gmc/tech/html. C.E.M., founder: Onegevity, Twin Orbit, and Cosmica Biosciences; consulting: Nanostring. L.E.D., research funding/consulting: Revolution Medicines; scientific advisory board: Mirimus. R.C., research funding: Sanofi; consulting/DSMB: Boston Scientific.

Figures
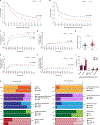
Figure 1.
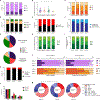
Figure 1.. Distinct clinical features of resected early-stage pancreatic adenocarcinoma.
A-B, Kaplan-Meier curves of (A) overall survival and (B) recurrence-free survival (RFS) between early- (n = 397) and late- (n = 963) stage patients. C-F, Cumulative incidence of (C) RFS, (D) local recurrence (LR), I distant recurrence (DR), and (F) simultaneous local and distant recurrence between early- (n = 397) and late- (n = 963) stage patients. G, Bar charts for the indicated clinical variables between early- and late-stage disease. H, Tumor size (largest dimension) dot plot between early- and late-stage disease (box-and-whiskers indicate mean +/− SEM). I, Rates of indicated margin positivity among pancreaticoduodenectomy patients with early- and late-stage disease. See also Figure S1 and Tables S1–S2.
Figure 2.
Figure 2.. Specific genomic features are associated with early-stage PDAC.
A, OncoPrint of selected gene mutations between early- (n = 103) and late- (n = 294) stage disease patients. B-C, Bar charts showing frequencies of (B) top 4 driver mutations or (C) other selected mutations, between early- and late- stage disease patients. D, Violin plot of overall number of mutations between early- and late-stage tumors. E, Frequency of KRAS mutations (KRASG12D, KRASG12R and KRASG12V; Other = other KRAS mutation; KRASWT = Wild-type) in early- and late- stage tumors. F, Frequency of early- and late-stage tumors for each of the indicated KRAS mutants or WT. See also Figure S2 and Tables S3–S7.
Figure 3.
Figure 3.. KRASG12R mutant PDAC has distinct clinical features and increased tumor suppressor inactivation.
A, Bar chart of frequency of T-stage by KRAS status. B, Tumor size (largest dimension in cm) scatter plot by indicated KRAS status (mean +/− SEM shown). C, Bar chart of frequency of N-stages by KRAS status. D, Bar chart of frequency of a family history of pancreas, breast or pancreas and breast (both) or no cancer (none) by KRAS. E, Bar chart of frequency of smoking history among patients, by KRAS status. F, Bar chart of frequency of neoadjuvant chemotherapy (NAC) or upfront resection by KRAS status. G, Pie chart of KRAS status for cohorts receiving upfront resection (n = 308) or NAC (n = 89). H-I, Frequency of AJCC stage for upfront resected (H) and neoadjuvant chemotherapy (I) patients by KRAS status. J, Bar charts of frequency of T (top) and N (bottom) stage for either upfront resection (left) or neoadjuvant chemotherapy (right) groups. K, Chromatin modifier mutation frequency per KRAS mutations. L, Bar chart of tumor suppressor mutation frequency for each KRAS mutant. M, Donut charts representing each combination of TP53, CDKN2A and SMAD4 mutation for each of KRASG12D, KRASG12R and KRASG12V. Dunnett’s test with KRASG12D as reference was performed for the 0–1 versus 2–3 tumor suppressors mutated comparison. See also Figure S2 and Tables S8–S10.
Figure 4.
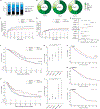
Figure 4.. Improved outcomes typify KRASG12R mutant PDAC.
A, Bar chart of frequency of first recurrence, by KRAS status. B, Donut chart of the frequency of distant recurrence site by KRAS status. C-D, Cumulative incidence of distant recurrence (DR) (C) and local recurrence (LR) (D) between KRAS alterations. E, Forest plot of cumulative incidence (2 year estimates with 95% confidence intervals) of distant and local recurrence by KRAS allele. Red circles indicate statistical significance in Dunnett’s test comparison to KRASG12D. F-G, Kaplan-Meier curves of overall survival (F) or recurrence-free survival (G) for each KRAS mutant and WT. H-I, Median OS (H) and RFS (I) estimates (with 95% confidence intervals) by each KRAS allele. Red circles indicate statistical significance in Dunnett’s test comparison to KRASG12D. J-L, Kaplan-Meier curves of overall survival for TP53 (J), CDKN2A (K), and SMAD4 (L) mutation versus wild-type. *p<0.05.
Figure 5.
Figure 5.. KRASG12R and KRASG12V are associated with improved survival in external datasets.
A, Kaplan-Meier curves of overall survival for ICGC-AU, ICGC-CA, Sausen and TCGA Firehose cohort. B, Kaplan-Meier curves of overall survival for all cohorts combined per KRAS alterations. C, Median OS estimates (95% confidence intervals from (B) by KRAS allele. Red circles indicate statistical significance. D, Kaplan-Meier curves of overall survival for all cohorts combined by number of tumor suppressors mutated (0 to 3). E, Univariate analysis by KRAS status using KRASG12D as reference or number of tumor suppressors mutated (0, 2 or 3) using 1 as reference. Hazard ratios with 95% confidence intervals are shown. F, Stratified multivariate analysis by KRAS status using KRASG12D as reference or number of tumor suppressors mutated (0, 2 or 3) using 1 as reference. Hazard ratios with 95% confidence intervals are shown. Red circles indicate statistical significance. *p<0.05; **p<0.01. See also Table S11.
Figure 6.
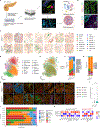
Figure 6.. Spatial profiling of PDAC reveals allele-specific differences between KRASG12D and KRASG12R.
A, Schematic delineating spatial molecular imaging workflow using the CosMx. B, Representative images showing the localization of indicated proteins following image reconstruction. C, Representative sections of all 14 PDAC patients following cell typing. D-E, UMAP of all profiled cells across the remaining 13 patients (after exclusion of Patient R2) stratified by cell type (D) or KRAS allele (E). F, Bar plots indicating abundance of the indicated cell types across all normal, KRASG12D, and KRASG12R samples. G, Representative sections of all 14 patients showing the identified niches across the cohort. H, Bar plot of niche abundance across all normal, KRASG12D, and KRASG12R samples. I, Boxplot of the proportion of cells in each field-ov-view (FOV) for each indicated genotype (KRASG12D or KRASG12R) belonging to niche 3. Student’s t-test was performed. ***p<0.001. J, Bar plots indicating abundance of each cell type within the corresponding niche. K, Heatmap of differentially abundant proteins for normal, KRASG12D, and KRASG12R samples. See also Figure S3.
Figure 7.
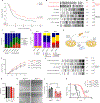
Figure 7.. KrasG12R displays attenuated malignant features in human and mouse PDAC.
A, Kaplan-Meier curves of overall survival for upfronted resected KRASG12D and KRASG12R PDAC patients in the COMPASS cohort. B, Gene set enrichment analysis (GSEA) for selected Hallmark pathways for the 100 KRASG12D and KRASG12R patients in (A). C, Bar plots indicating KRAS allelic imbalance across KRASG12D, KRASG12R, and KRASG12V patients in the COMPASS cohort. D, Bar plots indicating PDAC molecular subtype (as per Collisson, Moffitt, and Bailey classifications) for KRASG12D, KRASG12R, and KRASG12V patients in the COMPASS cohort. E, Schematic describing KrasMUT; p53KO mouse PDAC organoid generation. F, Growth over time of the indicated organoid lines. G, Cell viability after 72 hour incubation under standard growth conditions in Alamar blue assays. H, Representative brightfield images for the indicated time points and PDAC lines in a wound healing (migration) assay in vitro. I, Quantification of wound healing / migration assays conducted for the indicated organoids. n=3 independent experiments. J, Gene set enrichment analysis (GSEA) for selected Hallmark pathways for the KrasG12D and KrasG12R organoids. K, Kaplan-Meier curves of overall survival for mice orthotopically transplanted with the indicated organoid lines. See also Figure S4.

References

    1. Rahib L, Smith BD, Aizenberg R, Rosenzweig AB, Fleshman JM, & Matrisian LM (2014). Projecting cancer incidence and deaths to 2030: the unexpected burden of thyroid, liver, and pancreas cancers in the United States. Cancer research, 74(11), 2913–2921. 10.1158/0008-5472.CAN-14-0155 - DOI - PubMed
    1. Park W, Chawla A, & O’Reilly EM (2021). Pancreatic Cancer: A Review. JAMA, 326(9), 851–862. 10.1001/jama.2021.13027 - DOI - PMC - PubMed
    1. Song M, Yoon SB, Lee IS, Hong TH, Choi HJ, Choi MH, Lee MA, Jung ES, & Choi MG (2018). Evaluation of the prognostic value of the new AJCC 8th edition staging system for patients with pancreatic adenocarcinoma; a need to subclassify stage III?. European journal of cancer (Oxford, England : 1990), 104, 62–69. 10.1016/j.ejca.2018.08.027 - DOI - PubMed
    1. Allen PJ, Kuk D, Castillo CF, Basturk O, Wolfgang CL, Cameron JL, Lillemoe KD, Ferrone CR, Morales-Oyarvide V, He J, et al. (2017). Multi-institutional Validation Study of the American Joint Commission on Cancer (8th Edition) Changes for T and N Staging in Patients With Pancreatic Adenocarcinoma. Annals of surgery, 265(1), 185–191. 10.1097/SLA.0000000000001763 - DOI - PMC - PubMed
    1. Tonini V, & Zanni M (2022). Early diagnosis of pancreatic cancer: What strategies to avoid a foretold catastrophe. World journal of gastroenterology, 28(31), 4235–4248. 10.3748/wjg.v28.i31.4235 - DOI - PMC - PubMed

MeSH terms

LinkOut - more resources