. 2024 Sep 9;42(9):1582-1597.e10.
doi: 10.1016/j.ccell.2024.08.007. Epub 2024 Aug 29.

Combination anti-PD-1 and anti-CTLA-4 therapy generates waves of clonal responses that include progenitor-exhausted CD8+ T cells

Affiliations

Combination anti-PD-1 and anti-CTLA-4 therapy generates waves of clonal responses that include progenitor-exhausted CD8+ T cells

Kevin Wang et al. Cancer Cell. .

Abstract

Combination checkpoint blockade with anti-PD-1 and anti-CTLA-4 antibodies has shown promising efficacy in melanoma. However, the underlying mechanism in humans remains unclear. Here, we perform paired single-cell RNA and T cell receptor (TCR) sequencing across time in 36 patients with stage IV melanoma treated with anti-PD-1, anti-CTLA-4, or combination therapy. We develop the algorithm Cyclone to track temporal clonal dynamics and underlying cell states. Checkpoint blockade induces waves of clonal T cell responses that peak at distinct time points. Combination therapy results in greater magnitude of clonal responses at 6 and 9 weeks compared to single-agent therapies, including melanoma-specific CD8+ T cells and exhausted CD8+ T cell (TEX) clones. Focused analyses of TEX identify that anti-CTLA-4 induces robust expansion and proliferation of progenitor TEX, which synergizes with anti-PD-1 to reinvigorate TEX during combination therapy. These next generation immune profiling approaches can guide the selection of drugs, schedule, and dosing for novel combination strategies.

Keywords: CTLA-4 blockade; Checkpoint blockade; PD-1 blockade; T cell exhaustion; clonotypic analysis; combination checkpoint blockade; immunotherapy; melanoma; progenitor exhausted CD8(+) T cells; single-cell sequencing.


Conflict of interest statement

Declaration of interests A.C.H. performed consulting work for Immunai and received research funding from Bristol Myers Squibb and Merck. R.S.H. has performed consulting work for Bristol Myers Squibb (exclusive of the current work). T.C.M. received honorarium for Scientific Advisory Board participation from: BMS, GigaGen, Merck, Pliant, Pfizer. G.C.K. is on the Merck Advisory Board. J.W. consulted for and have received less than $10,000 per annum from Merck, Genentech, AstraZeneca, GSK, Novartis, Nektar, Celldex, Incyte, Biond, Moderna, ImCheck, Sellas, Evaxion, Pfizer, Regeneron, and EMD Serono and received $10–$25,000 from BMS for membership on advisory boards. J.W. also holds equity in Biond, Evaxion, OncoC4, and Instil Bio, and on scientific advisory boards for CytomX, Incyte, ImCheck, Biond, Sellas, Instil Bio, OncoC4, and NexImmune and remunerated between $10,000–$50,000. In addition, J.W. is named on a patent filed by Moffitt Cancer Center on an ipilimumab biomarker and on TIL preparation and also on a PD-1 patent filed by Biodesix; J.W. receives less than $6000 in royalties. D.B., E.K., and C.S. were employed by Immunai when engaged in this project. S.G. and D.T. are employees of BMS. C.A. is a consultant for Biotherapy Partners.

Figures

Figure 1.
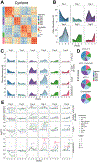
Figure 1.. Combination therapy induces TEX and effector CD8+ T cell responses
A. Study schema. Peripheral blood collected from 36 patients at baseline and every 3 weeks after checkpoint blockade. Clinical metadata. Median age. Response includes complete response and partial response. B. Uniform Manifold Approximation and Projection (UMAP) representation of non-naive CD8+ T cells (n=273,508). CM indicates central memory, SCM indicates stem cell-like memory. C. Auto-correlation of top 3000 genes ranked by Hotspot and 4 identified modules by agglomerative clustering. D. Pathway enrichment analysis of modules, with selected enriched pathways colored by −log 10 of the adjusted p-value (p-adj). Abbreviations: Effector – Eff, Memory – Mem, AP-1/IFN – AP1, Mito/ATP – ATP. E. UMAPs colored by gene module signature scores. F. Average module expression by metacluster. G. Fold change from baseline of frequencies for each metacluster. Significance as indicated by p-value or star is the change in frequency from baseline. One patient in the αPD-1 group with an extremely large exhausted CD8+ T cell population at baseline (15.8%), confirmed by flow cytometry, was excluded from the heatmap. Flow cytometry data is in Figure S1. αCTLA-4 (n=10), αPD-1 (n=15), combination (αPD-1 and αCTLA-4) (n=9). Wilcoxon signed-rank test. H. Frequency of exhausted and effector CD8+ T cells for combination therapy at indicated times. Transparent lines indicate individual patients (n=9). Opaque lines indicate mean. Wilcoxon signed-rank test. NS non-significance; *p<0.05. See also Figures S1 and S2, Tables 1 and S2.
Figure 2.
Figure 2.. Checkpoint blockade induces distinct clonal trajectories over time
A. Pairwise correlation of clonotypic trajectories using Cyclone. B. Cumulative frequencies for 6 clonotypic patterns. Each line denotes a single clone, and height between adjacent lines at each timepoint denotes frequency. C. Cumulative clonotypic frequencies split by treatment. Asterisk indicates significantly greater expansion per clone for the following comparisons: Traj 4: αPD-1 vs αPD-1 (prior ipi) ***, αPD-1 vs αCTLA-4 **, Combination vs αPD-1 (prior ipi) ***; Traj 5: Combination vs αPD-1 *, Combination vs αCTLA-4 **; Traj 6: Combination vs αPD-1 **, Combination vs αPD-1 (prior ipi) **, Combination vs αCTLA-4 ***. *p<0.05, **p<0.01, ***p<0.001, Wilcoxon rank-sum test. See Figure S4 for all comparisons and statistics. Combination therapy indicates αPD-1 and áCTLA-4. D. Trajectory composition of each treatment, scaled by absolute number of clones. E. Fold change of cell state composition stratified by pattern, averaged by patient. Percent of cells that have Ki67 gene expression, capped at 10% for visualization. CM indicates central memory, SCM indicates stem cell-like memory. For all: αCTLA-4 (n=4), αPD-1 (prior ipi) (n=7), αPD-1 (n=4), combination (n=3). Large outlier clones greater than 2.5 standard deviations above mean frequency were excluded from visualization in B-E. See also Figures S1, S3, S4, and S5.
Figure 3.
Figure 3.. Combination checkpoint blockade induces melanoma-specific CD8+ T cell responses at 3 and 6 weeks
A. Representative flow plots showing combinatorial tetramer gating for HLA-A2 restricted (indicated by A2) melanoma and viral specific CD8+ T cells in one sample. B. Representative flow plots showing melanoma and viral specific CD8+ T cells at indicated timepoints. Week 9+ indicates weeks 9-15. A2 and A3 indicate HLA-A2 and HLA-A3 restricted epitopes, respectively. C. Frequencies of HLA-A1, HLA-A2, HLA-A3, and HLA-B7 restricted melanoma and viral specific CD8+ T cells in combination therapy (αPD-1 and αCTLA-4) at indicated timepoints. Each line indicates one patient-specific antigen-specificity. Melanoma (n=6 patients, n=13 patient antigen-specificities); Viral (n=4 patients, n=7 patient antigen-specificities). NS non-significance; *p<0.05, **p<0.01, Wilcoxon signed-rank test. D. Cumulative frequencies of antigen specific CD8+ T cells. Each line denotes an antigen specificity for individual patients in combination therapy. E. Phenotypic compositions of antigen specific CD8+ T cells. Each line denotes a phenotype within an antigen specificity for individual patients in combination therapy. C-E. One large viral clone (CMV pp65 NLV) in patient 16-2189 with frequencies 0.99%, 1.4%, 1.37%, and 1.25% at weeks 0, 3, 6, and 9, respectively, was excluded for clarity. See also Figure S6 and Table S3.
Figure 4.
Figure 4.. Combination therapy reinvigorates progenitor and differentiated exhausted CD8+ T cells
A. Monocle 3 tree fitted onto exhausted CD8+ T cells (TEX), colored by pseudotime. B. Relative expression of top differentially expressed genes for each cluster, across pseudotime. C. Gene expression for individual cells along pseudotime with fitted spline curve, for selected markers. Cells with 0 expression of a gene are excluded from the respective plot. D. Relative expression of selected protein markers across pseudotime. E. Fold change from baseline of frequencies for TEX subsets. Significance indicates change in frequency from baseline. One patient in the αPD-1 group with an extremely large TEX population at baseline (15.8%), confirmed by flow, was excluded from the heatmap. αCTLA-4 (n=10), áPD-1 (n=15), combination (αPD-1 and αCTLA-4) (n=9). Wilcoxon signed-rank test. F. Frequency of progenitor (Prog) and differentiated (Diff) TEX subsets after combination therapy. Transparent lines indicate individual patients (n=9). Opaque line indicates mean. *p<0.05, **p<0.01. See also Figures S7, S8, and S9.
Figure 5.
Figure 5.. CTLA-4 blockade reinvigorates progenitor exhausted CD8+ T cells
A. Expression of selected markers for indicated CD8+ T cell subsets 3 weeks after combination therapy (αPD-1 and αCTLA-4). Flow cytometry was performed on PBMC from 8 patients. Central memory (CM), effector memory (EM), terminal effector memory (EMRA). B. Ki67 expression over time for indicated CD8+ T cell subsets after combination therapy (n=8). Differentiated TEX (Diff), Progenitor TEX (Prog). C. Study design for sequential treatment cohort. Flow cytometry was performed on blood collected every 3 weeks from a cohort of 8 patients who received ipilimumab followed by pembrolizumab. D. Ki67 expression in CD8+ T cells over time after ipilimumab (red) and pembrolizumab (blue). E. Frequency and Ki67 expression for progenitor exhausted CD8+ T cells (n=4). F. Study design for Checkmate 238 study. Flow cytometry was performed on blood collected before treatment and two weeks post-treatment from patients on ipilimumab (n=24) or nivolumab (n=21). G. Ki67 expression in progenitor TEX for ipilimumab (red, n=24) and nivolumab (blue, n=21). H. Frequency of progenitor TEX. I. Ki67 expression in progenitor TEX at Week 2, comparing ipilimumab and nivolumab. Error bars represent mean and 95th percentile confidence interval. B, D-I. Transparent lines indicate individual patients. Opaque line indicates mean. NS non-significance; *p<0.05, **p<0.01, ***p<0.001, ****p<0.0001, Wilcoxon signed-rank test. See also Figures S8 and S9 and Table S4.

References

    1. Larkin J, Chiarion-Sileni V, Gonzalez R, Grob JJ, Rutkowski P, Lao CD, Cowey CL, Schadendorf D, Wagstaff J, Dummer R, et al. (2019). Five-Year Survival with Combined Nivolumab and Ipilimumab in Advanced Melanoma. N Engl J Med 381, 1535–1546. 10.1056/NEJMoa1910836. - DOI - PubMed
    1. Wei SC, Duffy CR, and Allison JP (2018). Fundamental Mechanisms of Immune Checkpoint Blockade Therapy. Cancer Discov 8, 1069–1086. 10.1158/2159-8290.CD-18-0367. - DOI - PubMed
    1. Brunner MC, Chambers CA, Chan FK, Hanke J, Winoto A, and Allison JP (1999). CTLA-4-Mediated inhibition of early events of T cell proliferation. J Immunol 162, 5813–5820. - PubMed
    1. Walunas TL, Lenschow DJ, Bakker CY, Linsley PS, Freeman GJ, Green JM, Thompson CB, and Bluestone JA (1994). CTLA-4 can function as a negative regulator of T cell activation. Immunity 1, 405–413. 10.1016/1074-7613(94)90071-x. - DOI - PubMed
    1. Linsley PS, Brady W, Urnes M, Grosmaire LS, Damle NK, and Ledbetter JA (1991). CTLA-4 is a second receptor for the B cell activation antigen B7. J Exp Med 174, 561–569. 10.1084/jem.174.3.561. - DOI - PMC - PubMed

MeSH terms