. 2024 Nov;11(42):e2402652.
doi: 10.1002/advs.202402652. Epub 2024 Aug 30.

Cellular Uptake of Phase-Separating Peptide Coacervates

Affiliations

Cellular Uptake of Phase-Separating Peptide Coacervates

Anastasia Shebanova et al. Adv Sci (Weinh). 2024 Nov.

Abstract

Peptide coacervates self-assembling via liquid-liquid phase separation are appealing intracellular delivery vehicles of macromolecular therapeutics (proteins, DNA, mRNA) owing to their non-cytotoxicity, high encapsulation capacity, and efficient cellular uptake. However, the mechanisms by which these viscoelastic droplets cross the cellular membranes remain unknown. Here, using multimodal imaging, data analytics, and biochemical inhibition assays, we identify the key steps by which droplets enter the cell. We find that the uptake follows a non-canonical pathway and instead integrates essential features of macropinocytosis and phagocytosis, namely active remodeling of the actin cytoskeleton and appearance of filopodia-like protrusions. Experiments using giant unilamellar vesicles show that the coacervates attach to the bounding membrane in a charge- and cholesterol-dependent manner but do not breach the lipid bilayer barrier. Cell uptake in the presence of small molecule inhibitors - interfering with actin and tubulin polymerization - confirm the active role of cytoskeleton remodeling, most prominently evident in electron microscopy imaging. These findings suggest a peculiar internalization mechanism for viscoelastic, glassy coacervate droplets combining features of non-specific uptake of fluids by macropinocytosis and particulate uptake of phagocytosis. The broad implications of this study will enable to enhance the efficacy and utility of coacervate-based strategies for intracellular delivery of macromolecular therapeutics.

Keywords: cell uptake; drug delivery; macropinocytosis; peptide coacervates; phagocytosis.


Conflict of interest statement

The authors AM and YS have filed a US patent on HBpep‐SP used in this study.

Figures

Figure 1
Figure 1
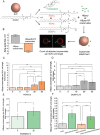
Interaction between HBpep and HBpep‐SP coacervates and GUVs. A) Schematics of the experimental setup for studying the attachment of coacervates to GUVs with varying lipid composition. The attachment was monitored using fluorescent imaging. B) Zeta‐potential of HBpep and HBpep coacervates loaded with EGFP. C, D) Plots of HBpep coacervate attachment to POPC GUVs with increasing amounts of negatively charged POPG (C) and positively charged DOEPC (D) showing that coacervate attachment increases when the content of charged lipids increases in GUVs. E) Plot of attachment of HBpep coacervates to POPC GUVs with and without 20% cholesterol indicates that coacervate attachment is higher for POPC GUVs with 20% cholesterol. Data are presented as the mean ± SD, N = 10, (N: number of GUVs). F) Plot of attachment of HBpep‐SP coacervates to POPC GUVs with and without 10% POPS and 20% cholesterol indicating higher attachment with 20% cholesterol. Data were normalized against baseline attachment to POPC GUVs and are presented as fold increase, mean ± SD, N = 8 (N: number of fields of view). One‐way ANOVA was used to compare the groups, * = P < 0.05, ** = P < 0.01, *** = P < 0.001.
Figure 2
Figure 2
Live cell imaging of HBpep and HBpep‐SP coacervate uptake. A) Interaction of GFP‐expressing HeLa cells with mCherry‐loaded HBpep coacervates demonstrates the attachment of coacervates (yellow arrowheads) to the cell, their colocalization with cell protrusions during uptake, and inward movement after the internalization. The cross‐section of the reconstructed stack in the yz plane (panel A, position 2) confirms the internalization. B) Enlarged vie ws of areas selected on images from panel A. C) Time‐lapse confocal images of cellular uptake of HBpep‐SP coacervates incubated with HeLa cells stained with cell mask membrane dye without (top) and with (bottom) MβCD treatment, demonstrating the progressive engulfment only without MβCD. D, E) Closeup views of coacervates selected on the images from panel (C) for the control (D) and in the presence of 5 mM MβCD (E). Magenta – Cell Mask Deep Red dye, green – EGFP. F) FACS analysis of HBpep‐SP coacervate uptake in the presence or absence of 5 mM MβCD (for cells in the presence of MβCD, 50 min of MβCD pre‐treatment was applied).
Figure 3
Figure 3
The uptake of HBpep and HBpep‐SP coacervates in HeLa and HepG2cells visualized by TEM. A–D) Ultrathin sections of fixed and resin embedded HeLa cells showing HBpep coacervates during different stages of cell uptake. (A,B) Different stages of membrane engulfment around the droplet. (C,D). Fully internalized coacervate in the cell cytoplasm. E–G) Ultrathin sections of fixed and resin embedded HeLa cells showing HBpep‐SP coacervates during the various stages of cell uptake after 15 min (E) and 3 h (F,G) of incubation. H–J) Ultrathin sections of fixed and resin embedded HepG2 cells showing HBpep‐SP coacervates during the various stages of cell uptake after 15 min (H) and 3 h (I,J) of incubation. N – nucleus, M – mitochondrion, G – Golgi complex. The observed membrane around the coacervates is indicated with arrows. Additional images are provided in Figures S9 and S10 (Supporting Information).
Figure 4
Figure 4
SEM images of HBpep and HBpep‐SP coacervates interacting with HeLa and HepG2 cell surface showing various stages of uptake. A–D) Representative SEM micrographs of HeLa cells with multiple HBpep coacervates after 15 min of incubation. E‐H. Close‐up views from A–D illustrate the three main types of coacervates/cell interaction topologies. Adhesion and filopodia capture E, F), sinking G), and ruffle/cup H). I) Representative SEM micrograph of HepG2 cell with multiple HBpep‐SP coacervates after 15 min of incubation. J–L) Close‐up views illustrating the three main coacervates/cell interaction topologies of coacervates from (I). Additional images are provided in Figures S12–S14 (Supporting Information).
Figure 5
Figure 5
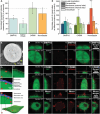
Cell cytoskeleton during coacervate uptake. A) FACS analysis of mCherry‐loaded HBpep‐SP coacervate uptake by GFP‐expressing HeLa cells in the presence of SMIFH2 (20 µM), CK666 (100 µM), and Nocodazole (10 µg ml−1). The data were normalized to control (no inhibitor added) and are shown as a mean ± SD, N = 3. B) TEM image showing vesicle fusion at the coacervate attachment site suggests the delivery of endomembranes (yellow arrows). C, D) 3D confocal imaging processed with CellProfiler to segment cell volume (using GFP channel) and coacervates (red mCherry channel). All coacervates were counted in different locations: extracellular, at the membrane (outside or inner side) and intracellular. C. Zoom‐in of a confocal slice (C1), threshold‐based membrane detection (C2), and 1 µm wide external and internal side of the membrane (C3). D) Schematic of coacervates at different locations in the cell. E) Number of coacervates at different locations normalized to the controls and shown as the mean ± SD, N = 8. F. Representative sections of HeLa‐GFP cells incubated with mCherry‐loaded coacervates in the presence of SMIFH2, CK666 and Nocodazole inhibitors. XY, XZ and YZ sections are shown for each inhibitor. Two sample t‐test was used to compare the groups with the controls. * = P < 0.05, ** = P < 0.01, *** = P < 0.001.
Figure 6
Figure 6
Cellular uptake of HBpep‐SP coacervates with the addition of a cholesterol‐binding peptide bearing the CRAC motif. A) Schematic of cholesterol‐mediated adhesion of coacervates with added CRAC peptide. B) FACS analysis of EGFP‐loaded HBpep‐SP coacervate with the addition of CRAC peptide and peptide with scrambled CRAC sequence, showing an increase in coacervate uptake only with the correct CRAC sequence. The data were normalized to control (no CRAC peptide added) and shown as a mean ± SD, N = 3. Two sample t‐test was used two compare the groups. * = P < 0.05, ** = P < 0.01, *** = P < 0.001. C) FIB‐SEM z‐stack images, showed in series, of cell uptake of HBpep‐SP coacervates with the addition of CRAC peptide, showing internalized and dissolving coacervates (yellow arrowheads). Two locations are shown, showing pores in the dissolving coacervates. Top dark area: extracellular space. D,E) Live cell imaging of cellular uptake of HBpep‐SP coacervates with the addition of CRAC peptide. Time‐lapse confocal maximum intensity z‐projection images of cells with coacervates (D, left) and close‐up vertical cross‐sections confirming the internalization (D, right). Time‐lapse confocal images of coacervates that underwent internalization and movement inside the cells (E). Red – Spy650‐tubulin, green – EGFP.
Figure 7
Figure 7
Observed cellular uptake behaviours of HBpep‐SP coacervates A) Confocal z‐stack imaging overview showing the uptake of mCherry‐loaded coacervates in HeLa‐GFP, with multiple coacervates detected in the cytoplasm (late internalization) at different stages of uptake in the same image. B) Representative enlarged views of mCherry‐loaded coacervates in different steps of uptake. C) Schematics of different stages of coacervate uptake observed by TEM, confocal fluorescence, and live cell imaging.

References

    1. Sun Y., Lim Z. W., Guo Q., Yu J., Miserez A., MRS Bull. 2020, 45, 1039.
    1. Johnson N. R., Wang Y., Expert Opin. Drug Deliv. 2014, 11, 1829. - PMC - PubMed
    1. Liu J., Spruijt E., Miserez A., Langer R., Nat. Rev. Mater. 2023, 8, 139.
    1. Lim Z. W., Ping Y., Miserez A., Bioconjugate Chem. 2018, 29, 2176. - PubMed
    1. Lim Z. W., Varma V. B., Ramanujan R. V., Miserez A., Acta Biomater. 2020, 110, 221. - PubMed