. 2024 Aug 31;15(1):7563.
doi: 10.1038/s41467-024-51894-6.

A catalog of small proteins from the global microbiome

Affiliations

A catalog of small proteins from the global microbiome

Yiqian Duan et al. Nat Commun. .

Abstract

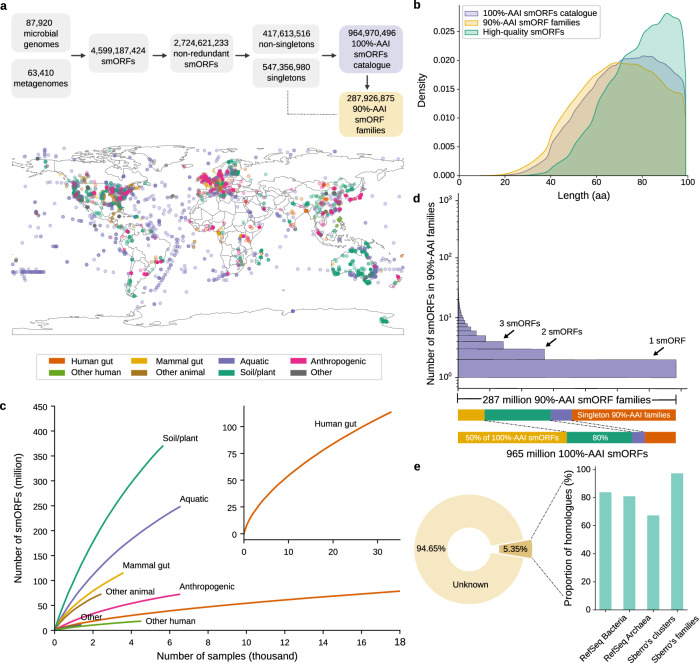
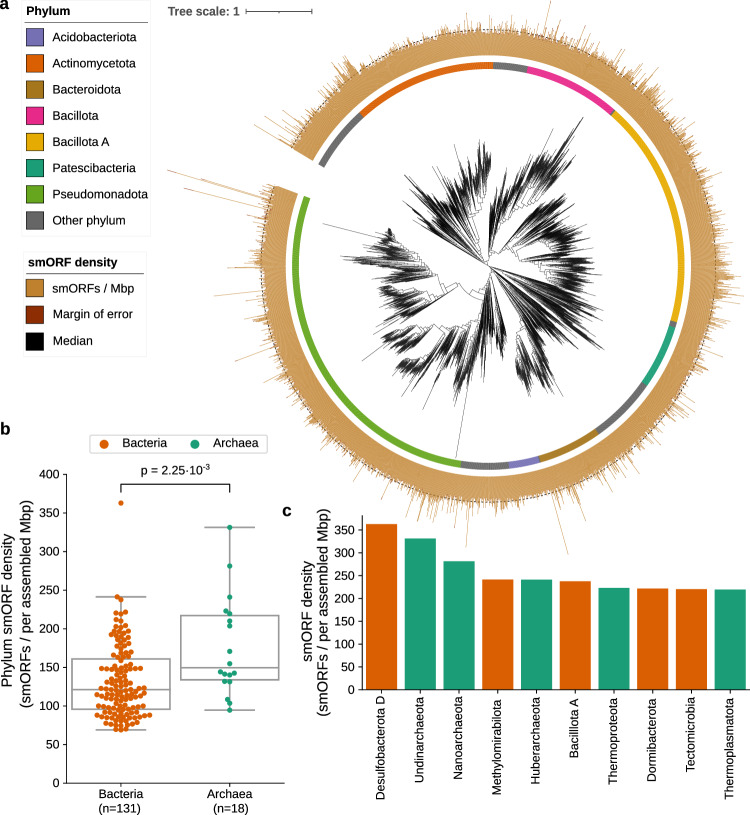
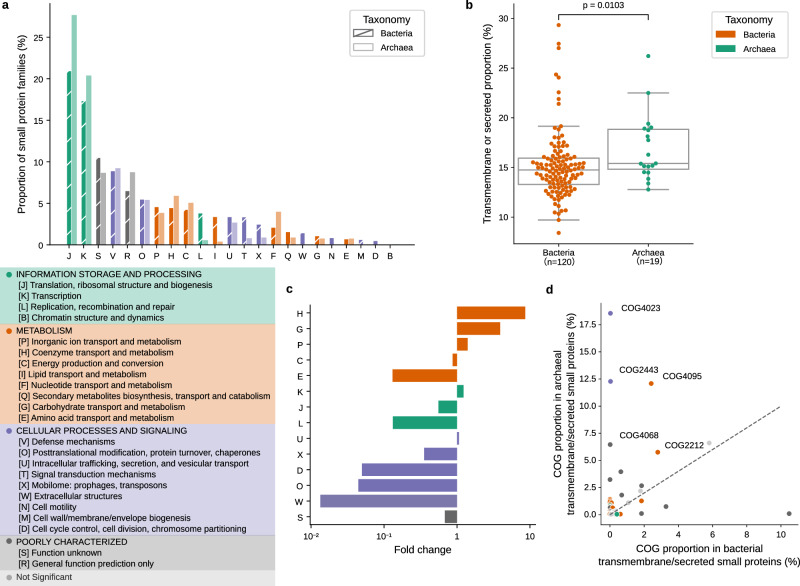
Small open reading frames (smORFs) shorter than 100 codons are widespread and perform essential roles in microorganisms, where they encode proteins active in several cell functions, including signal pathways, stress response, and antibacterial activities. However, the ecology, distribution and role of small proteins in the global microbiome remain unknown. Here, we construct a global microbial smORFs catalog (GMSC) derived from 63,410 publicly available metagenomes across 75 distinct habitats and 87,920 high-quality isolate genomes. GMSC contains 965 million non-redundant smORFs with comprehensive annotations. We find that archaea harbor more smORFs proportionally than bacteria. We moreover provide a tool called GMSC-mapper to identify and annotate small proteins from microbial (meta)genomes. Overall, this publicly-available resource demonstrates the immense and underexplored diversity of small proteins.


Conflict of interest statement

The authors declare no competing interests.

Figures

Fig. 1
Fig. 1. Global Microbial smORFs Catalog (GMSC).
a ORFs (open reading frames) were predicted from contigs from 63,410 assembled metagenomes from the SPIRE database and 87,920 microbial genomes from the ProGenomes2 database. The ORFs with at most 300 bps were considered smORFs. In total, 4,599,187,424 smORFs were predicted, of which 99.25% originated in metagenomes and 0.75% originated in microbial genomes. The number of smORFs was reduced to 2,724,621,233 by removing redundancy at 100% amino-acid identity (AAI) and 100% coverage. We further clustered the non-redundant smORFs into 287,926,875 clusters at a 90% amino-acid identity (AAI) cutoff (Methods). b Small proteins encoded by smORFs range in length from 9 to 99 amino acids. Sequences that pass all in silico quality tests and contain at least one piece of experimental evidence are considered high-quality predictions (Methods). c Shown are gene accumulation curves per habitat, showing how sampling affects the discovery of smORFs (see also Supplementary Fig. 2a). d The largest 90%-AAI smORF family contains 4577 sequences. The size of 90%-AAI smORF families exhibits a long tail distribution, and 47.5% of families consist of only one sequence, accounting for fewer than 15% of the total GMSC smORFs. A small fraction of large families account for the majority of GMSC smORFs (12.2% of families contain 50% of smORFs). e Only 5.35% of smORFs in the GMSC have a homologous sequence in another sequence catalog (Methods). On the other hand, more than 80% of bacterial and archaeal small proteins from the RefSeq database have a homolog in our catalog. Although only 67.3% of the 444,054 small protein clusters from the Sberro human microbiome dataset are homologous to a protein in our catalog, most of their clusters without homologous sequences only contain one sequence. Among the 4539 conserved small protein families from the Sberro human microbiome dataset, 97.4% of them are homologous to our catalog.
Fig. 2
Fig. 2. Taxonomic and functional annotation of small proteins.
a Predicting taxonomy for the contigs and genomes from which smORFs originate (Methods) resulted in a taxonomic assignment for 81.6% of smORFs (56.9% of smORFs at genus or species level). b When only families with >2 members were considered (96,721,815 families), there are three cases at each taxonomic rank. For example, considering the rank of class, a small protein family is annotated to a particular taxonomic class if all its members are annotated as belonging to that class (unannotated smORFs being ignored). We further distinguish three cases, namely whether its members are (i, marked specific in the next taxonomic rank) all be annotated to the same order (as order is the next taxonomic rank), (ii, marked multiple in the next taxonomic rank) annotated to different orders within that class, or (iii, marked only annotated at the current taxonomic rank) not annotated to any order. Other ranks are treated analogously (until we reach the level of species). c The enrichment of Pfam domains in small protein families present in multiple genera compared to the entire families with over two members (P value < 0.05, Hypergeometric Test, corrected by Bonferroni). Pfam domains were grouped by Pfam domain clans. Fold change is the ratio of the Pfam proportion of small protein families which present in multiple genera to the Pfam proportion of the entire families with over two members. d The Pfam annotation of small protein families that exist in multiple phyla, spanning >100 species and distributed across all the eight broad habitat categories (mammal gut, anthropogenic, other-human, other-animal, aquatic, human gut, soil/plant, and other).
Fig. 3
Fig. 3. Archaea harbor more smORFs than bacteria.
a Shown is the smORFs density distribution for the top 3000 bacterial genera with the highest density (brown bars, confidence interval of 95% shown as dark brown bars). Most of the densest genera are from Pseudomonadota, Bacillota A, and Actinomycetota. For reference, the black dashed line represents the median smORFs density for the presented genera. b Calculating the smORFs density of each phylum, the density of archaea is significantly higher than that of bacteria. Box plots indicate median (middle line), 25th, 75th percentile (box) and 5th and 95th percentile (whiskers) as well as outliers (single points) that lie within 1.5 IQRs of the lower and upper quartile. P values shown are from the Mann–Whitney test (two-sided). c The top 10 phyla with the highest smORF density are shown.
Fig. 4
Fig. 4. Differences in functional prediction for archaeal and bacterial small proteins.
a The COG distribution of archaeal and bacterial small proteins is shown. b Archaea contain a higher fraction of transmembrane or secreted small proteins than bacteria (calculated per phylum). Box plots indicate median (middle line), 25th, 75th percentile (box) and 5th and 95th percentile (whiskers) as well as outliers (single points) that lie within 1.5 IQRs of the lower and upper quartile. P values shown are from the Mann–Whitney Test (two-sided). c Shown is the difference in the proportion of COG class in archaeal transmembrane or secreted small proteins versus bacterial transmembrane or secreted small proteins. The fold change is the ratio of proportions. The P values were calculated using Fisher’s exact test (two-sided) and adjusted by Bonferroni correction. d Dots represent 43 COGs, which are enriched in archaeal transmembrane or secreted small proteins compared to the archaeal small proteins that are not transmembrane or secreted, as well as bacterial transmembrane or secreted small proteins. The proportion comparison of these 43 COGs between archaeal transmembrane or secreted small proteins and bacterial transmembrane or secreted small proteins is shown.
Fig. 5
Fig. 5. Workflow and benchmark of GMSC-mapper.
a GMSC-mapper uses Pyrodigal to predict small proteins with <100 amino acids from contigs. Users can alternatively provide smORF or protein sequences directly, skipping the initial step of gene prediction. DIAMOND or MMseqs2 are used for finding homologs within GMSC. In the end, GMSC-mapper combines all alignment hits and provides detailed annotations of small proteins. b Time cost tests were performed among different numbers of input sequences from 1000 to 1,000,000 using DIAMOND and MMseqs2 (Methods). We compared the number of recovered sequences with different lengths (20, 30, 40, 60, and 80 amino acids) at different amino acid identities from 10% to 100% using DIAMOND, MMseqs2, and BLAST (Methods). The recovered number is influenced by the E value cutoff used (103 in c and 105 in d).

References

    1. Kastenmayer, J. P. et al. Functional genomics of genes with small open reading frames (sORFs) in S. Cerevisiae. Genome Res.16, 365–373 (2006). 10.1101/gr.4355406 - DOI - PMC - PubMed
    1. Su, M., Ling, Y., Yu, J., Wu, J. & Xiao, J. Small proteins: untapped area of potential biological importance. Front. Genet.4, 286 (2013). 10.3389/fgene.2013.00286 - DOI - PMC - PubMed
    1. Pueyo, J. I., Magny, E. G. & Couso, J. P. New peptides under the s(ORF)ace of the genome. Trends Biochem. Sci.41, 665–678 (2016). 10.1016/j.tibs.2016.05.003 - DOI - PubMed
    1. Hobbs, E. C., Fontaine, F., Yin, X. & Storz, G. An expanding universe of small proteins. Curr. Opin. Microbiol.14, 167–173 (2011). 10.1016/j.mib.2011.01.007 - DOI - PMC - PubMed
    1. Storz, G., Wolf, Y. I. & Ramamurthi, K. S. Small proteins can no longer be ignored. Annu. Rev. Biochem.83, 753–777 (2014). 10.1146/annurev-biochem-070611-102400 - DOI - PMC - PubMed

Substances

LinkOut - more resources