. 2024 Aug 30;15(1):7551.
doi: 10.1038/s41467-024-51957-8.

Time-series sewage metagenomics distinguishes seasonal, human-derived and environmental microbial communities potentially allowing source-attributed surveillance

Affiliations

Time-series sewage metagenomics distinguishes seasonal, human-derived and environmental microbial communities potentially allowing source-attributed surveillance

Ágnes Becsei et al. Nat Commun. .

Erratum in

Abstract

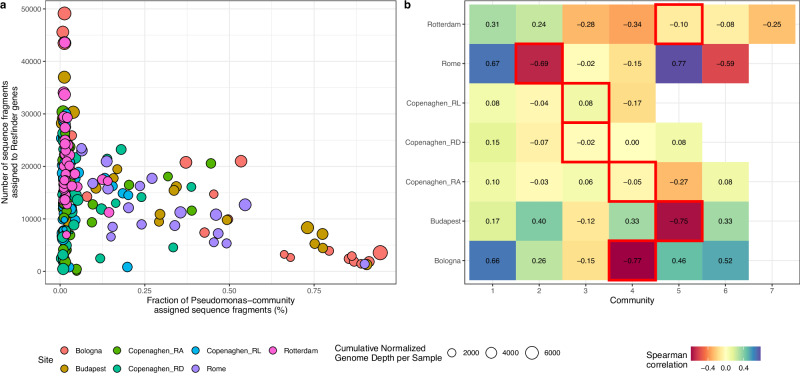
Sewage metagenomics has risen to prominence in urban population surveillance of pathogens and antimicrobial resistance (AMR). Unknown species with similarity to known genomes cause database bias in reference-based metagenomics. To improve surveillance, we seek to recover sewage genomes and develop a quantification and correlation workflow for these genomes and AMR over time. We use longitudinal sewage sampling in seven treatment plants from five major European cities to explore the utility of catch-all sequencing of these population-level samples. Using metagenomic assembly methods, we recover 2332 metagenome-assembled genomes (MAGs) from prokaryotic species, 1334 of which were previously undescribed. These genomes account for ~69% of sequenced DNA and provide insight into sewage microbial dynamics. Rotterdam (Netherlands) and Copenhagen (Denmark) show strong seasonal microbial community shifts, while Bologna, Rome, (Italy) and Budapest (Hungary) have occasional blooms of Pseudomonas-dominated communities, accounting for up to ~95% of sample DNA. Seasonal shifts and blooms present challenges for effective sewage surveillance. We find that bacteria of known shared origin, like human gut microbiota, form communities, suggesting the potential for source-attributing novel species and their ARGs through network community analysis. This could significantly improve AMR tracking in urban environments.


Conflict of interest statement

The authors declare no competing interests.

Figures

Fig. 1
Fig. 1. Abundance and diversity of recovered genomes through time and space.
a Shannon alpha diversity index of each sample. Circled dots indicate high levels of Pseudomonas_E. b Stacked bar plots of the relative abundance of genera, stratified by sampling site and left-to-right sorted according to sampling date. The ‘merged’ category includes all remaining genera, for which no genus exceeded 5% of any sample. c Multidimensional scaling of sample beta-diversity, based on Bray–Curtis (BC) dissimilarity. Point size is proportional to the inverse Shannon index. d Also, multidimensional scaling, but using the Aitchison distance instead of BC. Centroids are marked with a diamond and surrounded by an ellipse. These ellipses represent the 95% confidence intervals of the t-multivariate distribution for each sample group, serving as a graphical summary of the group’s variability.
Fig. 2
Fig. 2. Thousands of species’ genomes recovered de novo from sewage.
a Phylogeny of all highest-scoring members of species-level MAG clusters. From the inner to the outer ring, they show genome-assigned taxonomic order, the assembly method employed and whether a genome was classifiable at the species level. b A bar chart showing the number of classified and unclassified species from one or both assembly methods. The SHARED category refers to MAGs that were recovered using both the single-sample assembly (SSA) and the co-assembly approach (COASS). Classify refers to whether GTDB-tk assigned a species-level classification.
Fig. 3
Fig. 3. Diverse patterns emerge in the co-abundance networks of bacterial species across cities.
a Each vertex corresponds to a species’ genome, and the links represent significant positive (blue) and negative (red) correlations. The size of the vertices is proportional to the mean CLR-transformed depth of coverage, and the shapes encode variance level. Vertex colors are used to highlight the community membership. For the vertex placement, we used the Fruchterman-Reingold layout algorithm on the subgraph composed from only positive edges. Following this representation, many of the blue/positive links are covered by the circles, even if there are more positive links overall, see Supplementary Table S1). b Heatmap of the Jaccard similarity (J) with the hierarchical clustering of the Jaccard dissimilarity (1-J). The index J is defined as the ratio of the intersection of the links shared between two networks with respect to the union. See Supplementary Fig. S4 for an analogous version with nodes colored by taxonomy.
Fig. 4
Fig. 4. Association between microbiome-assigned antimicrobial resistance gene hits and microbial community abundances.
a This scatter plot shows the inverse correlation between the fraction of sequence fragments attributed to PEH communities and the number of fragments assigned to ResFinder AMR in samples. Points are colored by site and sized according to the cumulative normalized genome depth per sample. b Heatmap depicting Spearman’s ρ between the number of AMR-gene-attributed fragments and PEH community depth. Highlighted within red square rectangles are communities with heavy PEH species contribution.
Fig. 5
Fig. 5. Human gut microbiome species form communities and correlate with crAssphage abundance.
a Certain sampling sites show communities dominated by gut microbes. Light blue indicates the number of MAGs classified as human gut microbes, dark blue represents the number of MAGs not identified at the species level, and light green represents the number of other species in each community. Communities with fewer than 10 members were excluded from the analysis. The percentage values indicate the proportion of human gut microbes within each community. b Relative abundance of crAssphage (BK010471), an indicator of human fecal contamination shows low median level of fecal contamination in Rome but similarly high level of median abundance at other sites. The boxplot hinges represent the 25th and 75th percentiles, with the median indicated by a line inside the box. The whiskers extend to 1.5 times the IQR. c Spearman’s ρ between sample crAssphage depth and CLR-transformed depths of bacterial communities.
Fig. 6
Fig. 6. Time abundance of principal bacterial communities at each site.
The figure shows the smoothed (LOESS) trends of the CLR-transformed depths of bacterial communities, colored as in Fig. 3. The horizontal black dashed lines indicate where CLR-transformed depths are zero, highlighting the geometric means of the samples serving as the reference in CLR space. Only the communities composed of 30 or more bacterial species/MAG are included in the figures. Communities displaying periodic behavior aligned with the solar year are marked with dashed lines.

References

    1. Thomas, K. V. et al. Comparing illicit drug use in 19 European cities through sewage analysis. Sci. Total Environ.432, 432–439 (2012). - PubMed
    1. Hendriksen, R. S. et al. Global monitoring of antimicrobial resistance based on metagenomics analyses of urban sewage. Nat. Commun.10, 1124 (2019). - PMC - PubMed
    1. Munk, P. et al. Genomic analysis of sewage from 101 countries reveals global landscape of antimicrobial resistance. Nat. Commun.13, 7251 (2022). - PMC - PubMed
    1. Jespersen, M. L. et al. Global within-species phylogenetics of sewage microbes suggest that local adaptation shapes geographical bacterial clustering. Commun. Biol.6, 1–9 (2023). - PMC - PubMed
    1. Nieuwenhuijse, D. F. et al. Setting a baseline for global urban virome surveillance in sewage. Sci. Rep.10, 13748 (2020). - PMC - PubMed

LinkOut - more resources