. 2024 Aug 30;15(1):7545.
doi: 10.1038/s41467-024-51812-w.

Ion occupancy of the selectivity filter controls opening of a cytoplasmic gate in the K2P channel TALK-2

Affiliations

Ion occupancy of the selectivity filter controls opening of a cytoplasmic gate in the K2P channel TALK-2

Lea C Neelsen et al. Nat Commun. .

Abstract

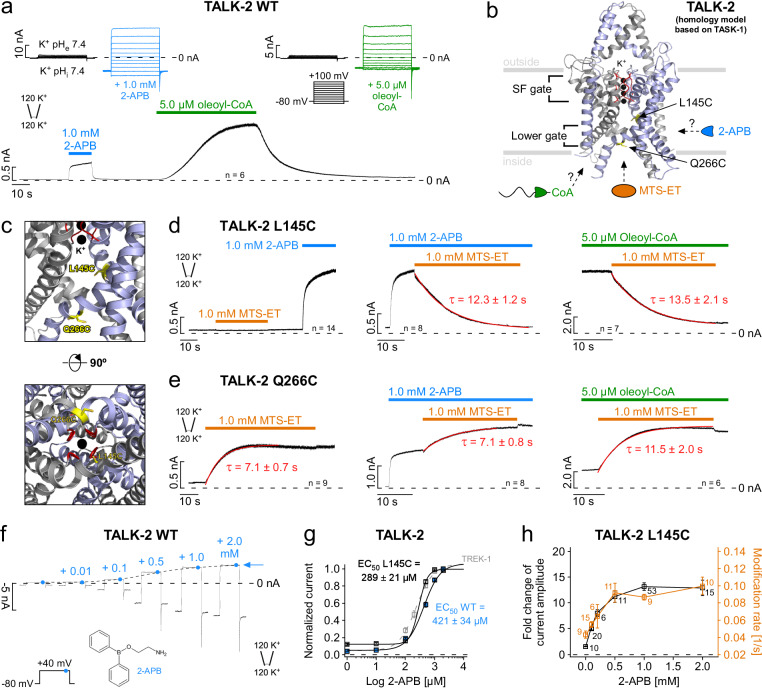
Two-pore domain K+ (K2P) channel activity was previously thought to be controlled primarily via a selectivity filter (SF) gate. However, recent crystal structures of TASK-1 and TASK-2 revealed a lower gate at the cytoplasmic pore entrance. Here, we report functional evidence of such a lower gate in the K2P channel K2P17.1 (TALK-2, TASK-4). We identified compounds (drugs and lipids) and mutations that opened the lower gate allowing the fast modification of pore cysteine residues. Surprisingly, stimuli that directly target the SF gate (i.e., pHe., Rb+ permeation, membrane depolarization) also opened the cytoplasmic gate. Reciprocally, opening of the lower gate reduced the electric work to open the SF via voltage driven ion binding. Therefore, it appears that the SF is so rigidly locked into the TALK-2 protein structure that changes in ion occupancy can pry open a distant lower gate and, vice versa, opening of the lower gate concurrently promote SF gate opening. This concept might extent to other K+ channels that contain two gates (e.g., voltage-gated K+ channels) for which such a positive gate coupling has been suggested, but so far not directly demonstrated.


Conflict of interest statement

The authors declare no competing interests.

Figures

Fig. 1
Fig. 1. State-dependent modification of inner pore cysteine residues in TALK-2 K2P channels.
a Representative current trace measured at +40 mV from an inside-out patch expressing WT TALK-2 channels with symmetrical K+ concentrations at pH 7.4. Channel currents were activated with the indicated compounds (1.0 mM 2-APB and 5.0 µM oleoyl-CoA) applied to the intracellular membrane side. Inlays show current-voltage responses of 2-APB- (blue) and oleoyl-CoA-activated (green) channels compared to basal state (black) using the indicated voltage step protocol. b Pore homology model of TALK-2 based on the crystal structure of TASK-1 (PDB ID: 6RV3, chains A, B) with the SF highlighted red, K+ ions black, and introduced cysteine residues (L145C and Q266C) for MTS-ET modification yellow. c Pore cavity zoom-in displaying the localization of L145C in the inner cavity and Q266C at the intracellular end of the pore. d Representative measurement of TALK-2 L145C channels showing state-dependent MTS-ET modification with no effect under unstimulated (basal) conditions or inhibition upon application of 1.0 mM MTS-ET in pre-activated states with 1.0 mM 2-APB (blue) or 5.0 µM oleoyl-CoA (green) with the indicated time constants (τ), respectively. e Measurement as in (d) with TALK-2 Q266C channels showing state-independent modification with activation upon application of 1.0 mM MTS-ET. f Current responses recorded using the indicated voltage step protocol in symmetrical K+ showing activation of WT TALK-2 with increasing 2-APB concentrations. The dotted line shows the increase and saturation of current amplitudes with 2-APB at + 40 mV. g 2-APB dose-response curves analyzed from measurements as in f for WT TALK-2 (blue, n = 26), TALK-2 L145C (black, n = 7), and WT TREK-1 (gray, n = 28) channels. h Correlation between the fold change in current amplitudes of TALK-2 L145C channels at +40 mV (black squares) and the rate of MTS-ET modification (1/τ) at +40 mV (orange squares) with different 2-APB concentrations. Data shown are the mean ± s.e.m and the number (n) of independent experiments is indicated in the figure and supplementary tables 1 and 2. The representative experiments were repeated with the similar results as indicated in the figure.
Fig. 2
Fig. 2. The lower constriction functions as a permeation gate.
a Representative measurement of WT TALK-2 channels from an inside-out patch in symmetrical K+ at +40 mV with increasing 2-APB concentrations (c1–c5) applied from the intracellular side at indicated time points (blue arrows). At steady-state, current levels with 2-APB intracellular K+ was exchanged by Rb+ showing an enhanced activatory Rb+ ion effect on the SF in 2-APB pre-activated channels. b Recording as in a for WT TREK-1 K2P channels showing the stepwise loss of Rb+ activation in the presence of increasing 2-APB concentrations. c Correlation of Rb+-induced currents from measurements as in a, b in the presence of 0.01, 0.1, 0.5, 1.0, or 2.0 mM 2-APB for either WT TALK-2 (black, n = 12) or WT TREK-1 (gray, n = 5) channels. d Gating scheme highlighting the effect of 2-APB and Rb+ on the lower and selectivity filter gate in TALK-2 channels. Data shown are the mean ± s.e.m and the number (n) of repeats of the representative measurements with similar results is indicated in the figure.
Fig. 3
Fig. 3. Functional characterization of the lower gate in TALK-2 K2P channels.
a Relative current amplitudes from TEVC measurements at pH 8.5 of WT and mutant TALK-2 channels. Currents were elucidated with a voltage protocol ramped from -120 mV to +45 mV within 3.5 s, analyzed at +40 mV and normalized to WT. Inlays showing representative WT TALK-2 (gray traces), TALK-2 L264A, L262A, W255A and V146A mutant channel currents (blue and green traces), respectively and a topology model of a channel protomer highlighting the localization of the g-o-f mutations. b Sequence alignment of the TM2, TM2-TM3 linker, and TM4 regions of the human K2P channels TALK-2 and TASK-1. c Pore homology model of TALK-2 based on the crystal structure of TASK-1 (PDB ID: 6RV3, chains A, B) highlighting the cluster of g-o-f mutations (V146A, L262A and L264A) at the cytosolic pore entrance. d Representative inside-out single channel measurements of WT TALK-2 (gray trace) and TALK-2 L264A mutant channels (blue trace) at -100 mV. e Relative open probability (NPO) and single channel amplitudes (SCA) analyzed from recordings as in d for WT and L264A TALK-2 channels (n = 6). fh Analysis of the mean channel-open times (g), closed time events (f), and burst behavior (h; see “Methods” section) for WT and TALK-2 L264A mutant channels. i Representative measurement of TALK-2 L264A mutant channels additionally carrying the inner pore mutation L145C (TALK-2 L264A/L145C) at +40 mV showing a fast and irreversible modification and subsequent block upon application of 1.0 mM MTS-ET. The experiment was repeated with similar results (n = 10). j Cartoon illustrating the pore accessibility of MTS-ET in L145C mutant TALK-2 channels with or without carrying an additional g-o-f mutation. k Modification rates of WT, L145C and double mutant TALK-2 channels at +40 mV as indicated. Data shown are the mean ± s.e.m and the number (n) of independent experiments is indicated in the figure and supplementary table 2. Statistical relevance has been evaluated using unpaired, two-sided t-test and exact P values are indicated in the figure. n.d. not determinable.
Fig. 4
Fig. 4. Direct stimulation of the SF produces a state-dependent cysteine modification in the pore of TALK-2.
a TALK-2 current responses to voltage step families as indicated using symmetrical K+ concentrations (120 mM [K+]ex./120 mM [K+]int.) at pH 7.4 on both sides (black traces), or at extracellular pH 9.5 (brown traces). b Cartoon illustrating a simplified TALK-2 channel gating model and pore accessibility to MTS-ET by alterations of the pHe that directly affects the SF. c Representative modification and subsequent irreversible inhibition with 1.0 mM MTS-ET of TALK-2 L145C channels pre-activated by extracellular alkalinization (pHe 9.5). d TALK-2 channel currents with intracellular Rb+ (120 mM [K+]ex./120 mM [Rb+]int.) at pH 7.4 for different potentials as indicated showing a maximum PO reached for potentials positive to ~+135 mV (Vmax), as further depolarizations do not increase the tail current amplitudes. e Voltage activation (conductance-voltage (GV) curves) with V1/2 values of 72 ± 2 mV and 66 ± 3 mV of WT TALK-2 (n = 15) and L145C mutant channels (n = 10), respectively. The highlighted voltages (orange) represent the voltage activation levels for MTS-ET modification experiments shown in i. f Cartoon of a simplified gating model with Rb+ as an amplifier for voltage activation targeting the SF and subsequently the lower gate in TALK-2 channels. g, h Representative measurements at +40 mV of WT (g) and L145C mutant TALK-2 channels (h) showing a non-modifiable state or an almost complete modification/inhibition with 1.0 mM MTS-ET within 60 s in intracellular Rb+, respectively. i Correlation between the fold change of tail current amplitudes (black squares) of TALK-2 L145C channels and the incidental rate of MTS-ET modification (1/τ) (orange squares) with intracellular Rb+ at different potentials as indicated. Data shown are the mean ± s.e.m and the number (n) of independent experiments and repeats of representative measurements with similar results is indicated in the figure and supplementary tables 1–3.
Fig. 5
Fig. 5. Open channel blocker show state-dependent pore accessibility and slowing of deactivation kinetics in TALK-2.
a Current responses of WT TALK-2 channels activated with indicated voltage steps under symmetrical ion conditions with either intracellular K+ (black trace, basal state) or Rb+ (red trace, activated state) and with 1.0 mM TPenA in Rb+ (orange trace). Note, the presence of TPenA shows slowing of deactivation resulting in a tail current cross-over. Cartoon depicting a simple model for TALK-2 channel gating, whereby Rb+ activation of the SF enables blocker (e.g., TPenA) binding in the pore and unbinding facilitates lower and SF gate closure at −80 mV. b Same recording as in (a) with TREK-2 channels showing inhibition with 50 µM TPenA without tail current cross-over. c Representative current responses of WT TALK-2 channels to voltage steps as indicated in the absence (black) and presence of 1.0 mM TPenA (orang) applied to the intracellular membrane side. d Representative measurement of TALK-2 channel currents at +40 mV showing dose-dependent TPenA inhibition in the pre-activated state with 1.0 mM 2-APB. e Dose-response curves of TPenA inhibition from measurements as in d for TALK-2 in unstimulated conditions (black, n = 16) and pre-activated states with 2-APB (blue) with altering apparent affinities for TPenA (IC50 (0.2 mM 2-APB, n = 7) = 778 ± 116, IC50 (0.5 mM 2-APB, n = 5) = 215 ± 28, IC50 (1.0 mM 2-APB, n = 16) = 54 ± 10). f Residual currents of WT and L264A mutant TALK-2 channels at +40 mV upon 1.0 mM TPenA block at indicated conditions. g Residual currents of unstimulated (black), 2-APB pre-activated WT (blue) and L264A mutant (gray) TALK-2 channels after inhibition with the indicated blocker. h Simplified gating scheme indicating that blocker interact with the open state of TALK-2 to produce inhibition. Data shown are the mean ± s.e.m and the number (n) of independent experiments and repeats of representative measurements with similar results is indicated in the figure. Statistical relevance has been evaluated using unpaired, two-sided t-test and exact P values are indicated in the figure.
Fig. 6
Fig. 6. Impact of ligand modulation on SF energetics in TALK-2 K2P channels.
ac GV curves analyzed from current-voltage families (−120 mV to +160 mV with 5 mV increments) measured under symmetrical ion conditions with intracellular Rb+ of WT TALK-2 (a), WT TREK-2 (b) and L264A mutant TALK-2 channels (c) in the absence (black traces, n = 15 TALK-2, n = 6 TREK-2, n = 15 TALK-2 L264A) and presence of 0.1 mM (brown trace, n = 7 TREK-2) or 1.0 mM TPenA (orange traces, n = 8 TALK-2, n = 7 TREK-2, n = 8 TALK-2 L264A), respectively. d GV curves analyzed from WT TALK-2 tail currents in the presence of pHe 7.4 (black trace, n = 15), pH 9.0 (blue trace, n = 6), and pH 10.5 (green trace, n = 6). e V1/2 values from GV curves analyzed as in d with varying pHe (pHe 7.0, n = 6; pHe 7.4, n = 15; pHe 8.0, n = 6; pHe 8.5, n = 7; pHe 9.0, n = 6; pHe 9.5, n = 9; pHe 10.0, n = 9; pHe 10.5, n = 6). f V1/2 values from GV curves of WT TALK-2 channels activated with 1.0 mM 2-APB (n = 5), 5.0 µM oleoyl-CoA (n = 7) or inhibited with 1.0 mM TPenA (n = 8). Dashed lines in e, f represent the level of WT (unstimulated) V1/2 at pHe 7.4. g Normalized currents from TEVC measurements of oocytes expressing WT (n = 11) and mutant L262A (n = 5) or L264A TALK-2 channels (n = 8), respectively. Channels were activated by increasing pHe from 5.5 to 10.5 with 0.5 pH increments. Currents were elucidated with a voltage protocol ramped from −120 mV to +45 mV within 3.5 s, analyzed at +40 mV and normalized to pH 10.5. Data shown are the mean ± s.e.m and the number (n) of independent experiments is indicated in the figure and supplementary tables 3 and 4.
Fig. 7
Fig. 7. Functional coupling of the SF and the lower gate in TALK-2 K2P channels.
a, b GV curves analyzed from tail currents at -80 mV after 300 ms pre-pulse steps (-120 mV to +160 mV with 5 mV increments) under symmetrical ion conditions with intracellular Rb+ of WT (n = 15) and V146A (n = 6), W255A (n = 14), L262A (n = 8), and L264A mutant TALK-2 channels (n = 15), respectively (b) and the summary of V1/2 values from Boltzmann fits to the corresponding GV curves (a). Dashed line in a represents the level of WT (unstimulated) V1/2 at pHe 7.4. c Correlation of the V1/2 shifts of mutant TALK-2 channels at basal and WT TALK-2 channels at indicated conditions with the time constants of modification of TALK-2 L145C channels under the corresponding activatory conditions or in combination with the respective g-o-f mutation. d Simplified energetic scheme depicting the electrical work (∆G = zF∆V1/2) required to open both gates (∆Gtotal) with the individual contribution of the SF gate (∆GSF) and lower gate (∆GLG). Mutations (as indicated in the inlay) that open the lower gate reduced this electrical work as seen in the positive V1/2 shifts of the GV curve. Note, our results actually show that both gates are strongly positively coupled and, thus, the pre-open state (with only the lower gate open) is just a conceptual state to illustrate the energetic contribution of the lower gate. Data shown are the mean ± s.e.m and the number (n) of independent experiments is indicated in the figure and supplementary tables 3 and 4. n.d. not determinable, n.e. no expression.

References

    1. Decher, N. et al. Characterization of TASK-4, a novel member of the pH-sensitive, two-pore domain potassium channel family. FEBS Lett.492, 84–89 (2001). 10.1016/S0014-5793(01)02222-0 - DOI - PubMed
    1. Girard, C. et al. Genomic and functional characteristics of novel human pancreatic 2P domain K(+) channels. Biochem. Biophys. Res. Commun.282, 249–256 (2001). 10.1006/bbrc.2001.4562 - DOI - PubMed
    1. Schmidt, C. et al. Upregulation of K(2P)3.1 K+ current causes action potential shortening in patients with chronic atrial fibrillation. Circulation132, 82–92 (2015). 10.1161/CIRCULATIONAHA.114.012657 - DOI - PubMed
    1. Trapp, S., Aller, M. I., Wisden, W. & Gourine, A. V. A role for TASK-1 (KCNK3) channels in the chemosensory control of breathing. J. Neurosci.28, 8844–8850 (2008). 10.1523/JNEUROSCI.1810-08.2008 - DOI - PMC - PubMed
    1. Leithner, K. et al. TASK-1 regulates apoptosis and proliferation in a subset of non-small cell lung cancers. PLoS ONE11, e0157453 (2016). 10.1371/journal.pone.0157453 - DOI - PMC - PubMed

LinkOut - more resources