. 2024 Aug 30;15(1):7553.
doi: 10.1038/s41467-024-51781-0.

Tumor-agnostic cancer therapy using antibodies targeting oncofetal chondroitin sulfate

Affiliations

Tumor-agnostic cancer therapy using antibodies targeting oncofetal chondroitin sulfate

Elena Ethel Vidal-Calvo et al. Nat Commun. .

Abstract

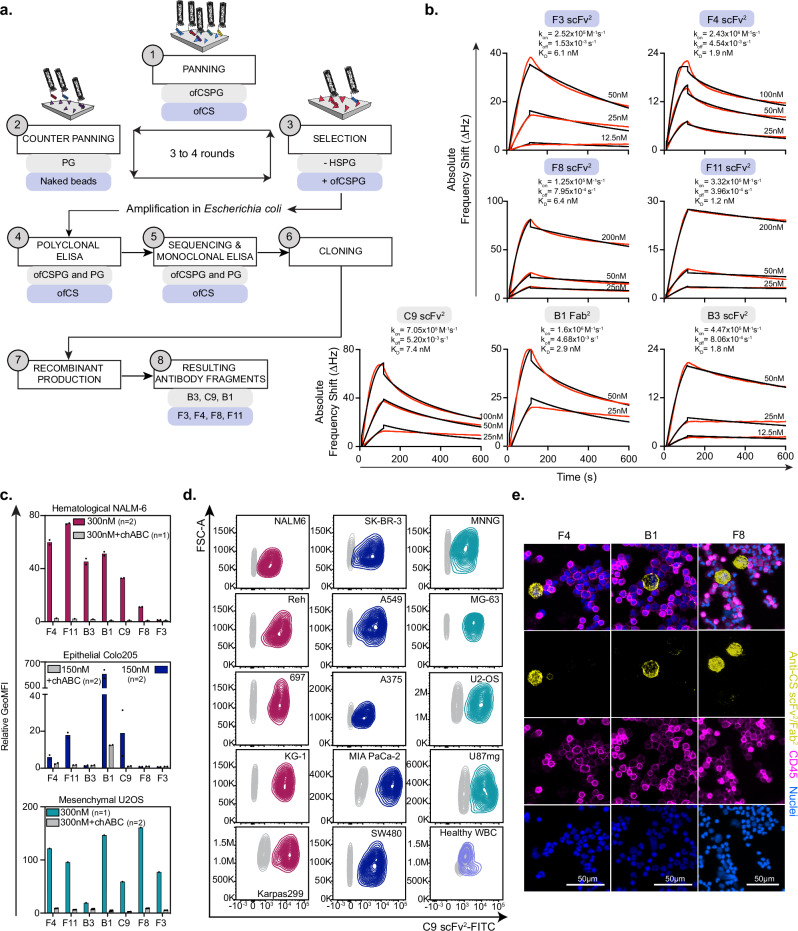
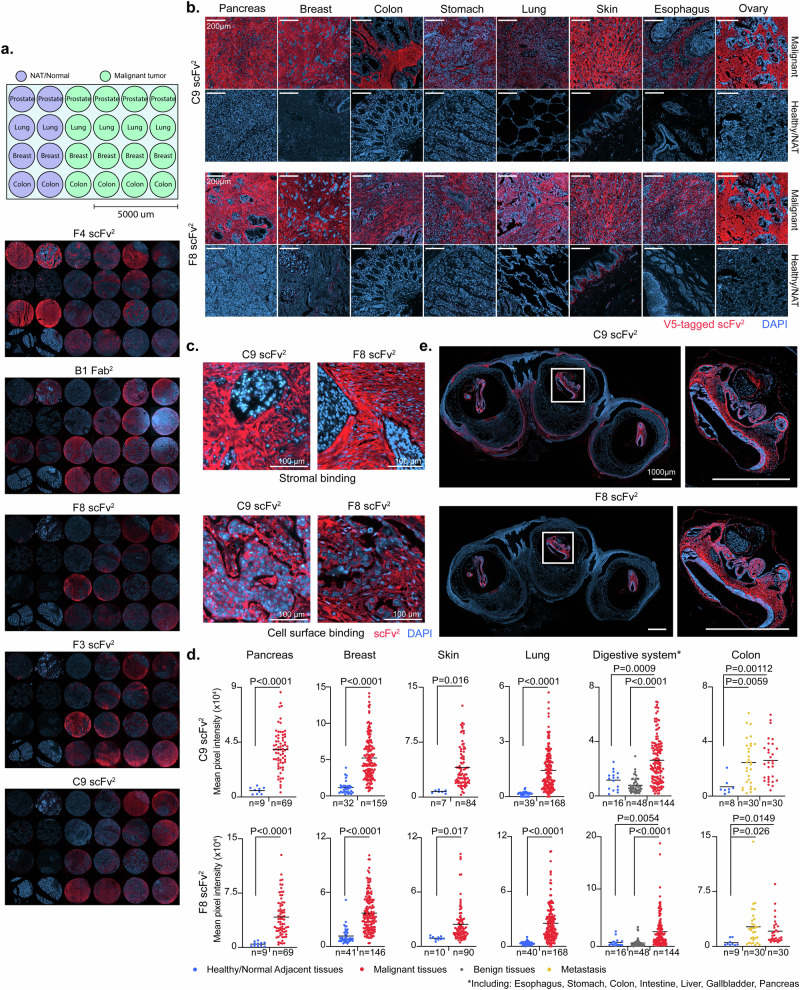
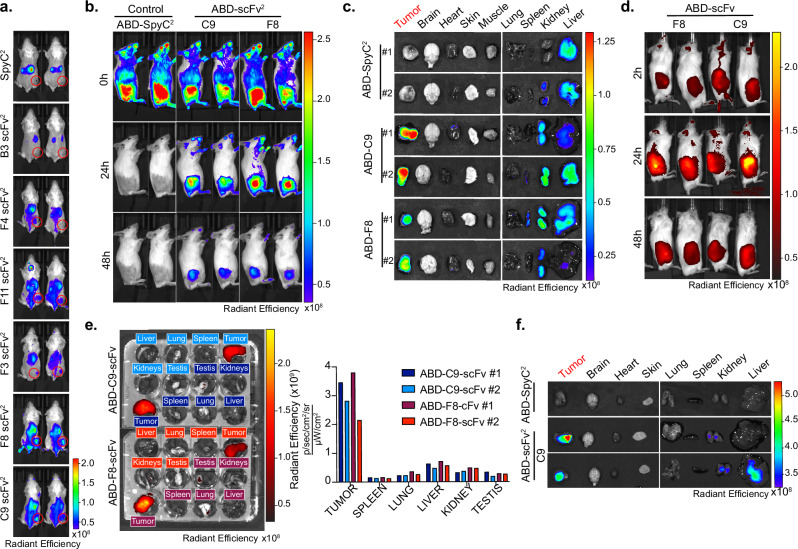
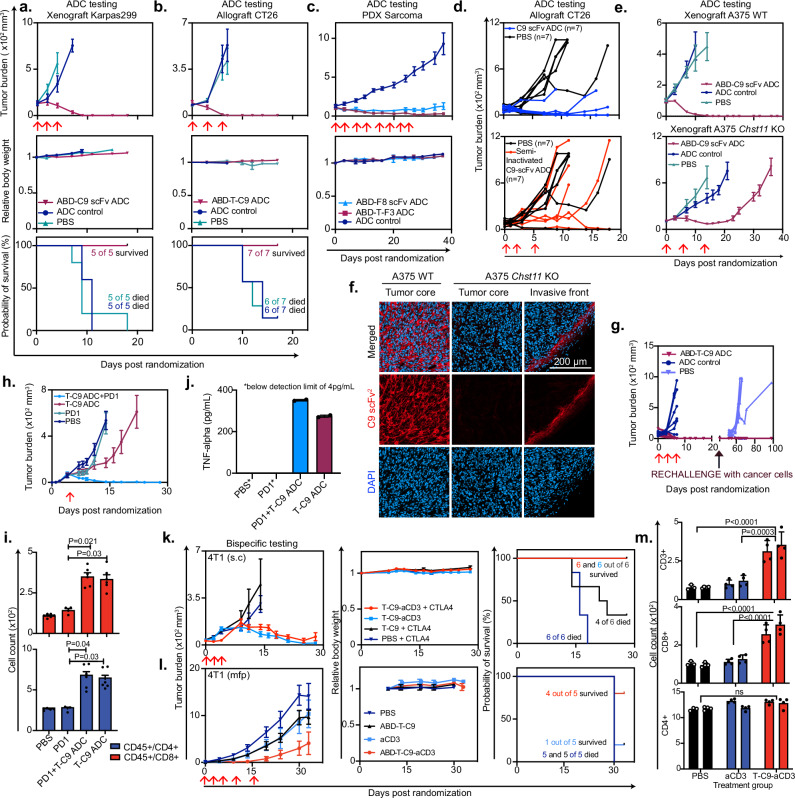
Molecular similarities between embryonic and malignant cells can be exploited to target tumors through specific signatures absent in healthy adult tissues. One such embryonic signature tumors express is oncofetal chondroitin sulfate (ofCS), which supports disease progression and dissemination in cancer. Here, we report the identification and characterization of phage display-derived antibody fragments recognizing two distinct ofCS epitopes. These antibody fragments show binding affinity to ofCS in the low nanomolar range across a broad selection of solid tumor types in vitro and in vivo with minimal binding to normal, inflamed, or benign tumor tissues. Anti-ofCS antibody drug conjugates and bispecific immune cell engagers based on these targeting moieties disrupt tumor progression in animal models of human and murine cancers. Thus, anti-ofCS antibody fragments hold promise for the development of broadly effective therapeutic and diagnostic applications targeting human malignancies.


Conflict of interest statement

A.S., M.D., M.Ø.A., T.M.C., M.A.N., and T.G.T. are shareholders of VAR2 Pharmaceuticals. The antibodies are subject to a patenting process owned by VAR2 Pharmaceuticals. H.C. is a shareholder of GlycoDisplay ApS, GlycoZym ApS, GlycoZym Inc, now GO Therapeutics Inc. The remaining authors declare no competing interests.

Figures

Fig. 1
Fig. 1. Phage-display derived antibody fragments are specific to cancer cells.
a Overview of the phage display process, illustrating key molecules involved at each step (1-panning, 2-counter panning, 3-phage selection, 4-polyclonal ELISA, 5-clone sequencing and monoclonal ELISA, 6-cloning, 7-recombinant production of positive candidates, 8-resulting antibody fragments) of the panning strategies performed on naive LiAb-SFMAXTM (scFv) and synthetic HuCAL (Fab) (gray boxes) or ALTHEA Gold semi-synthetic (scFv) library (purple boxes). b Sensograms depicting the interaction of resulting recombinant antibody fragments (F3 scFv2, F4 scFv2, F8 scFv2, F11 scFv2, C9 scFv2, B1 Fab2, and B3 scFv2) to ofCS, purified from human placenta and immobilized on a quartz crystal microbalance biosensor chip. Red curves correspond to experimental points and rate constants (association rate kon, dissociation rate koff, binding constant KD) were determined using a 1:2 fitting model with fitted curves in black. c Flow cytometry binding of V5-tagged-scFv2 (F4, F11, B3, C9, F8, and F3) and FLAG-tagged-Fab2 (B1) to cancer cell lines (hematological leukemic NALM-6 (top), epithelial colorectal Colo205 (middle) and mesenchymal glioblastoma U2OS (bottom)). The binding was measured as relative GeoMFI probed with FITC-labeled secondary antibodies without (colored) or with (gray) chABC treatment, with number of data point (n) indicated for each group. d C9 scFv2 binding to a larger panel of human cancer cell lines (hematological (red), epithelial (blue), and mesenchymal (green)) and to healthy purified white blood cells (purple), at 150 nM concentration, compared to the secondary antibody control (gray). e Immunofluorescence staining of A549 lung cancer cells spiked into healthy donor blood with PE-labeled scFv2 (F4, F8) or Fab2 (B1) (yellow), anti-CD45-Alexa647 (pink) and DAPI (blue). Top panel is a merged image of the three individuals shown below. These scans are representative of an image dimension of 2286 tiles and 41.06 mm × 14.03 mm per image (B1/F4) or 130 tiles and 5.12 mm × 2.91 mm (F8). Source data are provided as a Source data file.
Fig. 2
Fig. 2. ofCS-scFvs exhibit cancer-selective reactivity in tissues.
a Immunofluorescence (IF) analysis of paraffin-embedded fixed (FFPE) human tissue TP241b micro-array of healthy/normal adjacent (NAT) and malignant tissues from prostate, lung, breast and colon using 25 nM V5-tagged scFv2 (F4, F8, F3, C9) or V5-tagged Fab2 (B1) detected with Anti-V5-Alexa647 (red). DAPI was used for nuclear staining (blue). b Panel of malignant (top) and healthy (bottom) FFPE sections of different tissue types stained with C9 or F8 scFv2 as described in (a). c IF staining of FFPE lung adenocarcinoma (top) and carcinoma (bottom) sections from LC2085 TMA with C9 or F8 scFv2 as described in (a). d Mean pixel intensities of tissue micro-array (TMA) from different cancer types with number of sections (n) indicated for each group, stained as described in (a) comparing healthy/normal to malignant tissues from the pancreas (P < 0.0001), breast (P < 0.0001), skin (C9: P < 0.016; F8: P < 0.017), lung (P < 0.0001) the digestive system (C9: P < 0.0009; F8: P = 0.0054) and colon (C9: P = 0.00112; F8: P = 0.0149); healthy/normal to benign from the digestive system (P < 0.0001); and healthy/normal to metastatic colorectal tissues (C9: P = 0.0059; F8: P = 0.026). Intensities were measured on Fiji software and two-tailed unpaired parametric t-test was applied. e IF staining of mouse embryos stained with scFv2 as described in (a). To the right, a zoom-in of the dashed box is shown. Source data are provided as a Source data file.
Fig. 3
Fig. 3. F8 and C9 antibody fragments localize to solid tumors in vivo.
a In Vivo Imaging system (IVIS) localization of 50 μg Alexa750-labeled antibody (SpyC2, B3, F4, F11, F3, F8, and C9) injected in 4T1 allografted mice with two mice per construct. Tumor area is encircled in red. b IVIS localization of C9 and F8 scFv2 fused to albumin binding domain (ABD) in Karpas299 lymphoma xenografted mice after injection (0 h), 24 h, and 48 h after injection. c Ex vivo IVIS signals from the mice in panel b. 48 h after injection of ABD-control, ABD-C9, ABD-F8. d IVIS localization in patient-derived xenograft (PDX) model of neuroendocrine prostate cancer in male mice as described in b in vivo, and e ex vivo of mice from (d). 48 h, with radiant efficiency measured for each organ. f Ex vivo scanning in MiaPaca2 pancreatic xenograft model 24 h after injection of indicated proteins. Source data are provided as a Source data file.
Fig. 4
Fig. 4. Anti-ofCS antibody therapies elicit anti-tumor activity in vivo.
Tumor burden (mean +/− SEM mm3), body weight and survival curves of mice. a Xenografted with Karpas299 and treated with ABD-C9-scFv ADC, ADC control, or PBS (n = 5). b Allografted with colorectal cancer cells CT26 and treated with ABD-tandem-C9 (ABD-T-C9) or ADC control (n = 7). c Xenografted with patient-derived-xenograft (PDX) sarcoma cells and received F3 or F8-based ADCs (n = 6). d Individual tumor burden (mm3) of mice allografted with CT26 cells and treated with C9-scFv ADC, a lysine-conjugated semi-inactivated C9-ADC, or PBS (n = 7). e Tumor burden (mean +/− SEM mm3) of mice xenografted with melanoma A375 wild type (WT) or Chst11 knock-out (KO), treated with ABD-C9-scFv ADC, ADC control, or PBS (n = 5). f Analysis of tissues from (e), stained with C9-scFv2 (red) and DAPI for nuclei (blue). g Tumor burden (mean +/− SEM mm3) of cured mice from (b), re-challenged with CT26 cells, compared to naive mice injected with cells for the first time (PBS). h Same as in (e), but mice were allografted with CT26 cells and treated with T-C9 ADC alone, in combination with PD1, PD1 alone, or PBS (n = 7). i Immunoprofiling of tumor suspensions from mice treated as in (h), counting CD45+/CD4+ and CD45+/CD8+ populations (PDL-1, n = 2), PDL-1 + T-C9 ADC, T-C9, ADC, and PBS, n = 3)). with triplicate samples. Two-tailed nested t-test compared means and non-significant results were labeled “ns”. j TNFalpha levels from pooled plasma of mice in (i) measured in ELISA in duplicates. Levels in PBS and PD1 groups were below detection limit and marked with an asterisk. k Similar to (a), but mice received 4T1 cells subcutaneously (s.c), and were treated with T-C9-aCD3 with or without anti-CTLA4 checkpoint inhibitor and T-C9 as control (n = 6). l Similar to (e), but mice received 4T1 cells in the mammary fat pad (mfp) and were treated with ABD-T-C9-aCD3 and ABD-T-C9 as control (n = 5). m Immune cell counts (CD3+, CD8+, and CD4+) of 4T1 mfp tumors (n = 2) after three treatments with PBS, aCD3, or T-C9-aCD3. Replicate staining was performed (n = 4) and two-tailed nested t-test was applied to compare groups. Red arrows indicate days of treatment. Source data are provided as a Source data file.
Fig. 5
Fig. 5. Distinct CS sulfation patterns define the antibody binding specificities.
a Flow cytometry measured binding (relative GeoMFI +/− SEM) of 150 nM F4, F11, B3, C9, F8 and F3 scFv2, SpyC2 and B1 Fab2 to A375 WT melanoma cells or with B4GALT7 knocked out (KO) (n = 3). b Inhibition of the different antibody fragments’ ability to bind ofCS with soluble CSA, CSB, or CSC (0.4–400 μg/ml) measured in ELISA competition assay. c Composition of intact ofCS and the disaccharides binding the different antibody fragments (F11, F3, F8, C9 scFv2) by footprint analysis. d C9 and F8 scFv2 binding to genetically engineered CHO cells. The graphic overview (top) of the GAG biosynthesis pathways highlights the key genes studied and their assigned functions. Stars indicate genes investigated by knock-out (red) or knock-in (blue). Radar plot axis depict normalized mean fluorescence intensity of 200 nM C9 and F8 scFv2 binding to cells (n = 1–3) without (purple lines) or with chABC treatment (orange lines). e Heatmap of statistically significant hits obtained by Mass Spectrometry analysis of protein pull-downs from cell supernatants with C9, F4 and F3 scFv2 and SpyC2 as a control run in triplicates (n = 3). Two-sided unpaired t-test with Benjamin–Hochberg correction for multiple hypotheses testing was applied to determine differentially expressed proteins (significance threshold set to 1% and fold change to 2). Missing values are colored in gray, and lo2 transformed label-free quantification (LFQ) values are row mean normalized. f Heatmap representing row mean corrected LFQ values of hits obtained by MS analysis of CSPG pull-downs from human colon biopsy (H352) with C9, F4, and F8 scFv2 and SpyC2 in combination with chABC treatment as indicated, prior to enrichment analyzed as in (e). g Volcano plot of human colon biopsy (H352) processed and analyzed as in (e). with selected CSPG hits highlighted in black for each protein. Source data are provided as a Source data file.
Fig. 6
Fig. 6. Antibody-CS complexing depends on oligomerization on a long CS chain.
a Mass photometry contrasts of dimerized antibody fragments (B1, C9, and F8) analyzed alone (red) or in combination with soluble CSA or CSC (green). Soluble uncomplexed CS (yellow) was analyzed as a control. b 2D classification of B1 Fab:CSA complex from cryo-EM. c Cryo-EM density map depicting CS glycan chains (red) traversing across B1 Fabs in a tetramer complex. d Heavy chain:heavy chain homotypic interactions of B1 Fab. e Structure of B1 Fab interaction with CSA showing electrostatic surface potential of the complex. Above, a zoom-in of the dashed box is shown. f Single-cell RNAseq analysis of CS-related genes in a non-small lung carcinoma (NSCLC) transcriptome atlas (left and right) and a schematic overview of studied CS synthesis pathways (middle).

References

    1. Sung, H. et al. Global cancer statistics 2020: GLOBOCAN estimates of incidence and mortality worldwide for 36 cancers in 185 countries. CA Cancer J. Clin.71, 209–249 (2021). 10.3322/caac.21660 - DOI - PubMed
    1. Fu, Z., Li, S., Han, S., Shi, C. & Zhang, Y. Antibody drug conjugate: the “biological missile” for targeted cancer therapy. Sig Transduct. Target Ther.7, 1–25 (2022).10.1038/s41392-022-00947-7 - DOI - PMC - PubMed
    1. Watanabe, K. & Hakomori, S. I. Status of blood group carbohydrate chains in ontogenesis and in oncogenesis. J. Exp. Med.144, 644–653 (1976). 10.1084/jem.144.3.644 - DOI - PMC - PubMed
    1. Banwo, O., Versey, J. & Hobbs, J. R. New oncofetal antigen for human pancreas. Lancet1, 643–645 (1974). 10.1016/S0140-6736(74)93197-3 - DOI - PubMed
    1. Baston-Büst, D. M., Götte, M., Janni, W., Krüssel, J.-S. & Hess, A. P. Syndecan-1 knock-down in decidualized human endometrial stromal cells leads to significant changes in cytokine and angiogenic factor expression patterns. Reprod. Biol. Endocrinol.8, 133 (2010). 10.1186/1477-7827-8-133 - DOI - PMC - PubMed

LinkOut - more resources