. 2024 Aug 30;14(1):20223.
doi: 10.1038/s41598-024-69658-z.

Biocompatibility and bone regeneration with elastin-like recombinamer-based catalyst-free click gels

Affiliations

Biocompatibility and bone regeneration with elastin-like recombinamer-based catalyst-free click gels

I N Camal Ruggieri et al. Sci Rep. .

Abstract

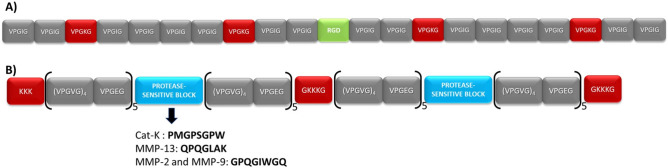
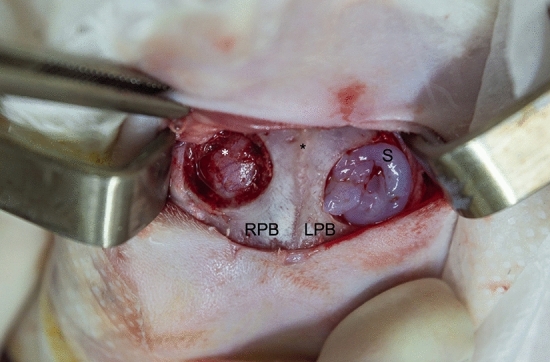
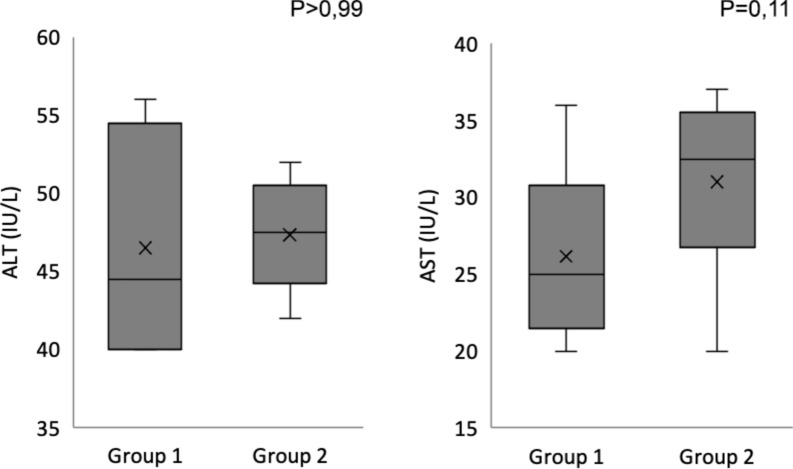
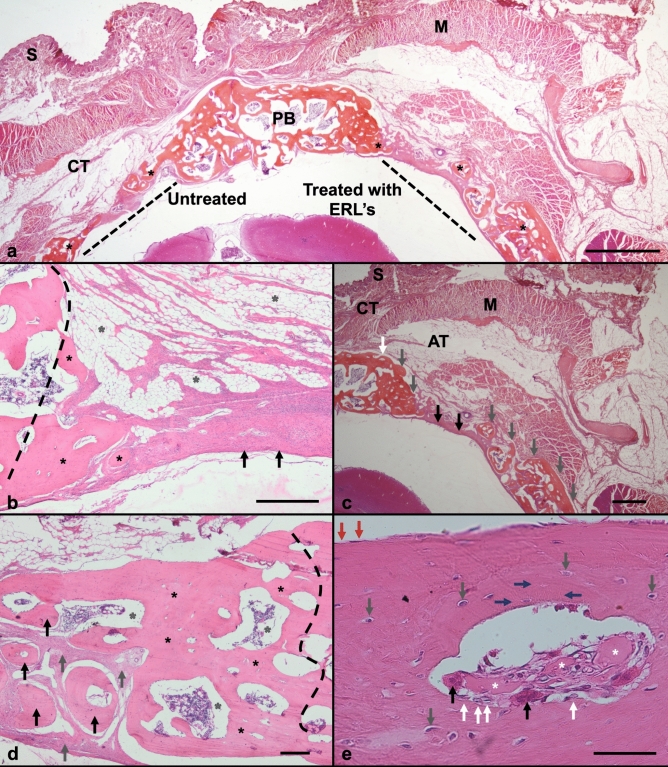
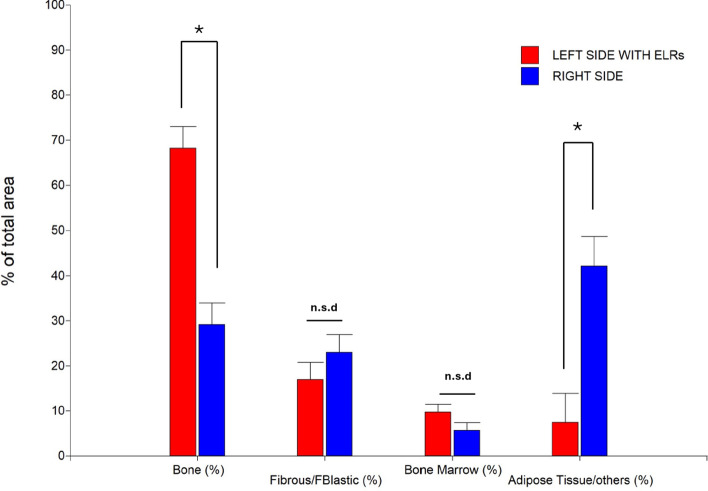
Large bone defects are a significant health problem today with various origins, including extensive trauma, tumours, or congenital musculoskeletal disorders. Tissue engineering, and in particular bone tissue engineering, aims to respond to this demand. As such, we propose a specific model based on Elastin-Like Recombinamers-based click-chemistry hydrogels given their high biocompatibility and their potent on bone regeneration effect conferred by different bioactive sequences. In this work we demonstrate, using biochemistry, histology, histomorphometry and imaging techniques, the biocompatibility of our matrix and its potent effect on bone regeneration in a model of bone parietal lesion in female New Zealand rabbits.

Keywords: Bone; Elastin; Scaffold; Tissue engineering.


Conflict of interest statement

The authors declare no competing interests.

Figures

Figure 1
Figure 1
Graphical scheme of the ELR compositions: (A) HRGD6 and (B) HE5.
Figure 2 (
Figure 2 (
a) LIVE/DEAD images of HFF-1 cells within ELR hydrogels after 1 day of incubation. (b) A single plane of a field (left) and the Z-projection of a Z-stack of the same field (right) are shown. Green-stained cells correspond to living cells, while red dots are dead cells. Scale bar = 100 µm. b. Morphology of cells within ELR hydrogels stained with Phalloidin-Alexa Fluor 488 for actin staining (in green) and DAPI for nuclei (in blue). A single plane of a field (left) and the Z-projection of a Z-stack of the same field (right) are shown. Scale bar = 100 µm.
Figure 3
Figure 3
Intraoperative gelification. Skin incision on surgical calotte approach with a superior frontal view. The sagittal suture is in the middle (black asterisk), the 10 mm control defect with no scaffold is on the left-hand side (right parietal bone; RPB), and the 10 mm defect with scaffold is on the right-hand side (left parietal bone; LPB). The scaffold (S) starts to gelify within only 30 s since it is localized on the defect. The dura mater (white asterisk) and its vascularization can be seen on the left-hand side defect.
Figure 4
Figure 4
Hemogram results at 90 days in boxplot graphics.
Figure 5
Figure 5
Serum transaminases result at 90 days in boxplot graphics.
Figure 6
Figure 6
CT studies. (a) Diameter of the untreated right bone defect in rabbit 1. (b) Diameter of the left bone defect treated with ELRs in rabbit 1. (c) Diameter of the untreated right bone defect and diameter of left bone defect treated with ELRs in rabbit 2. (d) Diameter of the untreated right bone defect in rabbit 3. (e) Diameter of the left bone defect treated with ELRs in rabbit 3. (f) Diameter of the untreated right bone defect and diameter of the left bone defect treated with ELRs in rabbit 4. (g) Diameter of the untreated right bone defect in rabbit 5. (h) Diameter of the left bone defect treated with ELRs in rabbit 5. (i) Diameter of the untreated right bone defect and diameter of the left bone defect treated with ELRs in rabbit 6.
Figure 7
Figure 7
Histological photography from decalcified samples and stained by H&E. (a) Panoramic image from bone defect area (BDA) on rabbit calvaria, it was showing (right) treated side by ELRs (BDT) and (left) untreated side (BDUT), at 90 days post-surgery. From top to bottom: skin (S), connective tissue (CT), muscle (M), parietal bone (PB), bone defect area (BDA), and brain. Bone formation (black asterisk) was observed on BD untreated and treated edges. The new bone inside BDT had similar thickness to normal bone. Also, multiple bone formations co-called ossicles were observed 6.3 X. Scale bar = 2 mm. (b) On BDUT area was trace (black dashed line) the defect edge, cover it by new bone formation (black asterisks). On its top shows fibro-adipose connective tissue (grey asterisks), under fibroblastic tissue arranged in swirling cells, over bone defect. This shows a biological mechanism to form new bone, in an intramembranous bone like differentiation process (black asterisks). 400X. Scale bar = 200 μm. (c) On BDT edge (white arrow) new bone (grey arrow) was found. Scarce fibroblastic tissue (black arrow) and new bone formations (grey arrows) covered BDT area. Also, hematopoietic bone marrow was seen inside ossicles. 6.3X. Scale bar = 2 mm. (d) At BDT, the edge traced (black dashed line) was covered by new bone (black asterisks) with hematopoietic bone marrow at their core (gray asterisks). Also, multiple rounded bone islets (black arrow), surrounded by fibroblastic tissue (grey arrow), were forming. The fibroblastic tissue will be replaced by bone islets grow in diameter until they merge to form a single bone structure. 40X. Scale bar = 200 μm. (e) Higher magnification, In BDT area new bone shows a Haver´s system-like, with ELRs remnants (white asterisks). These acts like foreign body material, with giant cells containing phagocytized material (black arrow). Osteoblast-like cells (white arrow) were seen on bone surface (endosteum). The bone appears in various layers. Osteocytes inside new bone (grey arrow) were connected by its cytoplasmic processes (blue arrow). Resting cells observed (red arrow) on bone tissue external surface (periosteum). 400x. Scale bar = 200 μm.
Figure 8
Figure 8
Histological photography from decalcified samples. (a,b,c) Stained by Masson’s trichrome. (a) From BDT by ELRs after 90 days. It showed bone edge defect (white line) connected to newly formed bone (white asterisk) surrounded by fibroblastic tissue (black asterisk). Decalcified sample.40X. Scale bar 200 μm. (b) At BDT area shows inside fibroblastic tissue (black asterisk) a newly formed trabeculae (white asterisk) with preliminary bone marrow formation (yellow asterisk). Inside, it was observed new vessels formation (black arrows) near to bone surface. 100X. Scale bar = 100 μm. (c) At high magnification, bone formed tissue shows pagetoid pattern (white asterisk) with its irregular arrangement. Mature (red) and immature (blue) bone tissue with osteoblasts on surface (black arrow), and osteocytes (white arrow) inside. 400 X magnification. Scale bar = 20 μm. (d) Decalcified samples stained by Verhoeff´s elastic stain. Bone defect treated (BDT) shows ossicles (white asterisk) formed around structures like biomaterial debris (gray asterisk). New bone was surrounded by fibroblastic tissue (black asterisk) with many angiogenesis formations containing blue outlined erythrocytes (black arrow). Bone adopted an irregular arrangement resembling pagetoid-like bone (white asterisk). 40X magnification. Scale bar = 100 μm. (e) Higher magnification (black square) from 8.d. New pagetoid-like bone (white asterisk) formed on amorphous areas compatible with remains of ELR´s (gray asterisk), surrounded by angiogenesis (black arrow). Osteoblasts (white arrow) and osteocytes (grey arrow) were observed. 400X magnification. Scale bar = 20 μm.
Figure 9
Figure 9
Microscopic images from undecalcified samples embedding in methyl methacrylate stained with Masson-Goldner’s trichrome. (a) In BDUT was observed new bone formation with several islets (white asterisk), immersed in fibroblastic tissue (green asterisk) at control bone defect edge. However, its thickness was minor compared with preexisting bone (black asterisk). Osteoid tissue areas were found (black arrow) on mineralized bone. 40 X. Scale bar = 200 μm. (b) At BDT bone formation showed on its edge and central zone, like bone islets (white asterisk) covered by osteoid tissue (white arrow); all surrounded by fibroblastic tissue (green asterisk). 40 X. Scale bar = 200 μm. (c) At BDT Bone new formation over BDT central zone surrounded by fibroblastic tissue (green asterisk) and new ossicles (white asterisk) cover by red osteoid thick layer (black arrow). 100 X. Scale bar = 100 μm.
Figure 10
Figure 10
An analysis of variance (ANOVA) was conducted for each variable of interest. Subsequently, to detect significant differences, the Tukey test was applied with a significance level of 0.05 (Montgomery, 2013). All assumptions were controlled to ensure confidence in the results (*p < 0.05; n.s.d., no significant difference).

References

    1. Athanasiou, K. A., Zhu, C.-F., Lanctot, D. R., Agrawal, C. M. & Wang, X. Fundamentals of biomechanics in tissue engineering of bone. Tissue Eng.6, 361–381. 10.1089/107632700418083 (2000). 10.1089/107632700418083 - DOI - PubMed
    1. Cointry, G., Capozza, R., Feldman, S. & Reina, P. ¿Los huesos son estructuras genéticas, metabólicas, biomecánicas, o todo a la vez?. Actual. Osteol.5, 185–195 (2009).
    1. Capozza, R. F. et al. pQCT-assessed relationships between diaphyseal design and cortical bone mass and density in the tibiae of healthy sedentary and trained men and women. J. Musculoskelet. Neuronal Interact.13, 195–205 (2013). - PubMed
    1. Mattisson, L., Bojan, A. & Enocson, A. Epidemiology, treatment and mortality of trochanteric and subtrochanteric hip fractures: Data from the Swedish fracture register. BMC Musculoskelet. Disord.19, 369. 10.1186/s12891-018-2276-3 (2018). 10.1186/s12891-018-2276-3 - DOI - PMC - PubMed
    1. Ekegren, C., Edwards, E., de Steiger, R. & Gabbe, B. Incidence, costs and predictors of non-union, delayed union and mal-union following long bone fracture. IJERPH15, 2845. 10.3390/ijerph15122845 (2018). 10.3390/ijerph15122845 - DOI - PMC - PubMed

LinkOut - more resources