. 2025 Feb;21(2):247-255.
doi: 10.1038/s41589-024-01716-z. Epub 2024 Aug 30.

Direct inhibition of tumor hypoxia response with synthetic transcriptional repressors

Affiliations

Direct inhibition of tumor hypoxia response with synthetic transcriptional repressors

Zeyu Qiao et al. Nat Chem Biol. 2025 Feb.

Abstract

Many oncogenic transcription factors (TFs) are considered to be undruggable because of their reliance on large protein-protein and protein-DNA interfaces. TFs such as hypoxia-inducible factors (HIFs) and X-box-binding protein 1 (XBP1) are induced by hypoxia and other stressors in solid tumors and bind to unfolded protein response element (UPRE) and hypoxia-induced response element (HRE) motifs to control oncogenic gene programs. Here, we report a strategy to create synthetic transcriptional repressors (STRs) that mimic the basic leucine zipper domain of XBP1 and recognize UPRE and HRE motifs. A lead molecule, STR22, binds UPRE and HRE DNA sequences with high fidelity and competes with both TFs in cells. Under hypoxia, STR22 globally suppresses HIF1α binding to HRE-containing promoters and enhancers, inhibits hypoxia-induced gene expression and blocks protumorigenic phenotypes in triple-negative breast cancer (TNBC) cells. In vivo, intratumoral and systemic STR22 treatment inhibited hypoxia-dependent gene expression, primary tumor growth and metastasis of TNBC tumors. These data validate a novel strategy to target the tumor hypoxia response through coordinated inhibition of TF-DNA binding.


Conflict of interest statement

Competing interests: Z.Q., L.C.N., C.S.S., S.A.O., M.R.R. and R.E.M. are listed as inventors on patent (PCT/US22/80387) applications related to this study. S.A.O. is a cofounder, equity holder and consultant for OptiKIRA, LLC. R.E.M. is a cofounder and consultant for Anastasis Biotec, Ltd. and cofounder, director and consultant for ReAx Biotechnologies, Inc. All other authors declare no competing interests.

Figures

Extended Data Fig. 1
Extended Data Fig. 1. Schematic synthesis of synthetic transcription repressors (STRs).
a, Convergent synthesis of STRs containing local and global structure nucleation and interhelix linker installation. Two individual helices are synthesized on-resin with bisalkylated, terminal olefin containing ‘S5’ amino acids at defined positions for on-resin ring closing metathesis (1: Grubbs I catalyst, DCE, N2 atmosphere). For STR22 synthesis, one monomer (monomer A) harbors Lys(Mmt) at a defined position on the peptide C-terminus, enabling orthogonal deprotection followed by and acylation with a Mal-Gly-OH linker (2: 1% TFA/DCM; 3: 0.1 M, 0.1 M HCTU, 0.2 M DIPEA, DMF, N2 atmosphere). The second monomer (monomer B) contains similar natural and non-natural stabilizing features as found in A, but with a C-terminal cysteine at a defined position. Cleavage and purification of monomers A and B enables direct ligation in aqueous solution (50% ACN/H2O, pH 7.0–7.2) and subsequent purification of the STR dimer. b, Representative chromatogram (left) and mass spectrum (right) of STR22. c, Chemical structure of STR22.
Extended Data Fig. 2
Extended Data Fig. 2. Representative EMSA gels.
a, IRdye700-labeled and unlabeled oligo probes used in EMSA experiments. Blue: target UPRE consensus sequence. Red: nucleotides in non-target AP1 or UPRE mutant sequences that differ from the UPRE consensus sequence. b, Representative EMSA gel of STR1, STR2, STR3 and STR4 (8–500 nM with 2-fold serial dilution) binding to 5 nM IRdye700-labeled UPRE oligo probe from n = 3 biological replicates. c-d, Representative EMSA gels and quantification curves for STR21 (8–500 nM with 2-fold serial dilution; c) and STR22 (2–50 nM with 1.5-fold serial dilution; d) binding to UPRE or AP-1 oligos. e-f, Representative EMSA gels showing competition between UPRE consensus and mutant sequences for binding to STR21 (e) and STR22 (f; 7–100 nM with 1.5-fold serial dilution). Red: IRdye700-labeled UPRE oligo probe or UPRE consensus, blue: AP-1 probe or UPRE mutant. g, qEMSA profiles of STR1, STR4, and STR21. The location of the UPRE consensus oligo in the qEMSA enrichment profile is denoted. Data in c-f are shown as mean ± s.d. from n = 3 biological triplicates.
Extended Data Fig. 3
Extended Data Fig. 3. Confocal microscopy of FITC-STRs in cells.
a, Representative fluorescent confocal microscopy images of HeLa cells treated with 5 μM FITC-STR4 and FITC-STR22 for the indicated timepoints. Scale bar in all images = 20 μm. b, Quantification of total fluorescence intensity of microscopy images of HeLa cells treated with DMSO, FITC-STR4 and FITC-STR22 at 12 hrs. Graph in (b) shows per-cell values with mean ± s.d from n = 10 cells. Statistical significance was determined using unpaired, two-sided t-test.
Extended Data Fig. 4
Extended Data Fig. 4. STR22 competes with XBP1s-DNA binding and inhibits target gene expression in cells.
a, Representative western blot analysis of Flag epitope, XBP1s and GAPDH in Flag-XBP1- or control-plasmid transfected (500 ng, 6 hrs) HeLa cells treated with DMSO vehicle or STR22 (20 μM, 2 hrs) from n = 2 independent replicates. b, 3x UPRE-regulated luciferase reporter activity in HeLa cells expressing Flag-XBP1s following treatment with DMSO or STR22 (two-fold serial dilutions between 20 to 2.5 μM, 24 hrs). c, UPRE-regulated reporter activity as in (b) following induction of endogenous XBP1s with tunicamycin (5 μg/mL; 12 hrs) and treatment with DMSO or STR22 (two-fold serial dilutions between 20 to 2.5 μM, 24 hrs). d, Representative ChIP-qPCR quantification of Flag-XBP1s occupancy at UPRE-containing target genes in Flag-XBP1s- or control-plasmid transfected (500 ng, 6 hrs) HeLa cells treated with vehicle or STR22 (20 μM, 2 hrs) from n = 2 independent replicates. e, mRNA levels of canonical XBP1-dependent target genes in Flag-XBP1s- or control plasmid-transfected (500 ng, 24 hrs) HeLa cells treated with DMSO or STR22 (20 μM, 24 hrs). f, mRNA levels of canonical XBP1-dependent target genes of tunicamycin-treated (5 mg/ml, 12 hrs) HeLa cells treated with DMSO or STR22 (20 μM, 36 hrs). Data shown are mean ± s.d. from n = 3 technical replicates (d) or n = 3 biological replicates (b, c, e and f). Statistical comparisons are Student’s two-tailed t-tests.
Extended Data Fig. 5
Extended Data Fig. 5. STR22 directly competes with HIF1α and inhibits HIF1α-regulated gene expression in cells.
a, ChIP-qPCR quantification of HIF1α binding to HRE-containing genes in the presence and absence of hypoxia (1% O2, 6 hrs) and STR22 treatment (20 μM, 24 hrs). NRS, normal rabbit serum. ChIP-qPCR data is representative of n = 4 independent replicates. b-d, RT-qPCR quantification of mRNA levels of HRE-regulated target genes with DMSO or STR22 treatment (20 μM, 24 hrs; b-c) or serial dilutions betwen 20 μM to 2.5 μM. (d), under normoxic or hypoxic conditions (1% O2, 24 hrs) in the indicated TNBC cell lines. All normalized qPCR data are relative to RPL13A. e, Expression levels, assessed via RT-qPCR, of known HRE-regulated genes across the indicated CRISPR-knockout HeLa cell lines treated with STR22 (20 μM, 48 hours) under normoxic or hypoxic (1% O2, 24 hours) conditions. Data are shown as the mean ± s.d. of n = 3 biological replicates (b-e). Statistical comparisons are Student’s two-tailed t-tests.
Extended Data Fig. 6
Extended Data Fig. 6. Western blot validation of CRISPR-KO cell lines.
a, Western blot analysis of different CRISPR knockout HeLa cell lines treated with 10 μM PHD inhibitor (Adaptaquin, left) or 5 μg/ml tunicamycin (right) for 6 hrs. b, Western blot analysis of MDA-MB-231 and SUM159 cultured under hypoxic conditions (1% O2) for 6 hrs. c, Western blot analysis of different CRISPR knockout MDA-MB-231 cell lines under either normoxic or hypoxic conditions (1% O2) or 5 μg/ml tunicamycin for 6 hrs. Data are representative of n = 2 independent repeats (a-c).
Extended Data Fig. 7
Extended Data Fig. 7. Additional data and analysis of hypoxia dependent gene expression and HIF1α ChIP-seq.
a, Analysis of a second independent biological replicate of anti-HIF1α ChIP-Seq experiment performed as in Fig. 2d-e. Venn-diagram shows enriched peaks under normoxia, hypoxia and hypoxia + STR22, as well as the highest enriched consensus motif from HIF1α under hypoxia (HRE). b, Clustering of mRNA-seq samples based on distance between each sample. c-d), Heat map representations of classical hypoxia response mRNA transcript levels (c) and canonical hypoxia response pathways (d) in HeLa cells under normoxia, hypoxia and hypoxia with STR22 treatment. (e-f) GSEA enrichment analysis of additional hypoxia-regulated gene sets. Plots were generated from mRNA-seq profiles comparing global gene expression in HeLa cells treated with DMSO under normoxic or hypoxic conditions, as well as STR22 under hypoxic conditions. BIOCATRA_HIF_pathway (e) and Response_to_Hypoxia (f) gene sets from the Molecular Signatures Database are both significantly enriched in cells experiencing hypoxia, and concomitantly decreased in those cells when treated with STR22, p values were calculated by the HOMER2 software via the findMotifsGenome.pl function in (a), and by the GSEA software using the Signal2Noise metric with 10,000 permutations by gene set in (e-f). g, GO analysis of top ten pathways induced by hypoxia and inhibited by STR22 treatment. ChIP-Seq data in are representative of n = 2 biological replicates. RNA-seq data are 3 biological replicates. Metascape analysis of genes regulated by hypoxia and inhibited by STR22 based on ChIP-seq and RNA-seq results. Pathway enrichment p-values were reported by Metascape.
Extended Data Fig. 8
Extended Data Fig. 8. Intratumoral treatment with STR22 inhibits tumor growth and hypoxia-dependent gene expression in TNBC xenografts.
a-c, Starting (a) and ending (b) volumes, and final tumor mass (c) at the end of the experiment described in Fig. 3f-g. d, Relative mRNA expression of hypoxia-dependent target genes in tumors after study endpoint, as shown in Fig. 3f. e-f, Separate intratumoral treatment study of MDA-MB-231 xenografts (n = 5 mice each, 1 × 10⁶ cells) on the mammary fat pad and treated with intratumoral administration of either vehicle or 20 μg STR22 twice per week (schematic timeline on the left and growth on the right). f, Relative mRNA expression of hypoxia-dependent target genes in tumors 24 hrs after the final dose. Data are shown as the mean ± s.d of n = 10 (a-d), or n = 5 (e-f). Statistical comparisons are Student’s two-tailed t-tests.
Extended Data Fig. 9
Extended Data Fig. 9. Toxicity and immunogenicity analysis of healthy mice treated with STR22.
a-b, Schematic timeline (a) and body weight (b) of non-tumor bearing mice (BALB/c (n = 3) and CBL57/6 (n = 3)) treated intravenously with either sterile PBS or STR22 (50 mg/kg)every other day for total of 14 days (7 injections). c-d, STR22 ELISA performed using plasma collected at day 0 (pre-treatment), 7 and 14 from PBS and STR22 treated mice on a biotin-STR22 coated 96-well streptavidin ELISA plate. Left graph shows controls without plasma treatment in both C57BL/6 (c) (n = 3, upper) and BALB/c (d) (n = 3, lower). Right graph shows negative (no biotinylated antigen, plasma only) and positive controls (streptavidin plate coated with biotinylated-anti-mouse IgG) with indicated plasma samples at 500x, 1000x, and 2000x dilutions, following manufacturers procedure. e, Representative H&E-stained organ sections (n = 3) from vehicle and STR22 treated mice. f-g, Complete Blood count test for C57BL/6 (n = 3) (f) or BALB/c (n = 3) (g) mice treated vehicle or STR22 at 0, 7, 14 days time points. Data are shown as the mean ± s.e.m of n = 3 (b-g) biological replicates.
Extended Data Fig. 10
Extended Data Fig. 10. HIF1α knockout in 4T1 cells reduces tumor growth.
a, Western blot analysis of control- or HIF1α-guide CRISPR knockouts in 4T1 cells treated with 10 μM PHD inhibitor (Adaptaquin) for 6 hrs. Data are representative of n = 2 independent repeats. b, Aggregate (left) and individual (right) tumor growth curves from control and HIF1α-guide CRISPR knockouts in 4T1 syngeneic tumors in Balb/c mice. Data in (b) are the mean ± s.e.m. from n = 9 biological replicates.
Fig. 1 |
Fig. 1 |. Design and synthesis of potent and specific STRs derived from XBP1.
a, XBP1s forms a bZIP homodimer to bind UPRE (blue) and embedded HRE (red) DNA sequences. HIF1α forms a heterodimer with ARNT to bind to HRE (red) DNA sequences. Representative bZIP (left) and bHLH (right) dimerized TF DNA-binding domain structures are from the Protein Data Bank under accession codes 2H7H and 4ZPK, respectively. b, Schematic overview of stabilization design elements used to generate XBP1-derived STRs. c, Sequences of selected STRs derived from the bZIP domain of XBP1 containing helix-stabilizing amino acids (S5, (S)-5-pentenyl alanine; black), optimized interfacial substitutions (red) and interhelix ligation sites (blue). Apparent Kd values are the mean and 95% confidence interval from n = 3 biological replicates. ND, not determined. d,e, Representative EMSA gel (d) and corresponding binding curves (e) of STR22 (1.5-fold dilutions between 50 and 2 nM) bound to fluorophore-labeled double-stranded DNA-containing target (UPRE) or control nontarget (AP1) sequences. Data in e are shown as the mean ± s.d. from n = 3 biological replicates. f, qEMSA profile of STR22 depicting the selectivity for specific DNA motifs among >30 canonical TF motifs. Enrichment within two independent biological replicates is plotted. g, Representative confocal fluorescence microscopy images (left) and 3D view from z-stack confocal images (right) of HeLa cells treated with FITC–STR4 (unstabilized) or FITC–STR22 (5 μM, 12 h). Scale bar, 20 μm for two-dimensional (2D) images (left) or 5 μm for 3D images (right). h, Quantification of total fluorescence intensity in HeLa cells treated with STRs as in g for 6, 12, 24 or 48 h. Data in h are shown as the mean ± s.d. from n ≥ 10 cells in each condition. AU, arbitrary units. i, Fluorescence gel analysis of HeLa cell extracts treated with FITC-labeled STRs at the indicated time points. MW, molecular weight.
Fig. 2 |
Fig. 2 |. STR22 inhibits HIF1α–DNA binding and hypoxia-dependent target gene expression.
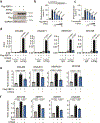
a, Western blot analysis of HIF1α protein levels in HeLa cells under normoxic or hypoxic (6 h) culture conditions with and without STR22 (20 μM). Data are representative of n = 2 independent biological replicates. b, 3xHRE-regulated firefly luciferase reporter activity in HeLa cells treated with the indicated doses of STR22 for 24 h under hypoxic conditions. NS, not significant. c, RT–qPCR of known HRE-regulated genes in HeLa cells under normoxic or hypoxic (1% O2, 24 h) conditions treated with the indicated concentration of STR22 (48 h). d, Genome-wide changes in HIF1α-bound loci measured by ChIP-seq peaks from HeLa cells under normoxia or hypoxia (1% O2, 6 h) following 24 h of DMSO or 20 μM STR22 treatment. The logo plot depicts the most enriched motif (which is the HRE) in hypoxic cells treated with DMSO; 99% of these sites are lost or decreased with STR22 treatment. e, Track view of bound HIF1α density for four representative HRE-regulated genetic loci in HeLa cells treated with the indicated oxygen and compound combinations. f, Heat map representation of the top hypoxia response mRNA transcript levels in HeLa cells under normoxia, hypoxia and hypoxia (1% O2, 24 h) with STR22 (20 μM, 48 h) treatment. g, GSEA plots generated from mRNA-seq profiles; hallmark hypoxia response genes are significantly enriched in hypoxic versus normoxic cells (top) and significantly downregulated in hypoxic cells treated with STR22 relative to vehicle (bottom). Data shown in b,c are the mean ± s.d. from n = 3 biological replicates. ChIP-seq data are representative of n = 2 biological replicates (d,e). RNA-seq data shown are n = 3 biological replicates (f,g). P values were calculated by the HOMER2 software using the findMotifsGenome.pl function in d and by the GSEA software using the signal-to-noise metric with 10,000 permutations by gene set in g.
Fig. 3 |
Fig. 3 |. STR22 inhibits aggressive TNBC phenotypes in vitro and in vivo.
a,b, Relative growth of different CRISPR-KO MDA-MB-231 cell lines (a) or MDA-MB-231 sgCtrl cells treated with STR22 with indicated concentration (b) for the indicated times under normoxic (left) and hypoxic (right) conditions. c, Relative growth of 4T1, BM1 and SUM159 under hypoxic conditions treated with STR22. d,e, Relative invasion of indicated MDA-MB-231 KO cell lines or STR22-treated (20 μM) sgCtrl cells under hypoxic conditions for 24 h (d) or dose-dependent treatment with STR22 (e). f, Treatment schematic (left) and growth curves (right) of MDA-MB-231 mammary fat pad xenograft-bearing nude mice (n = 10) treated with intratumoral administration of either vehicle or 20 μg of STR22 twice per week. g, Images of vehicle-treated (top) or STR22-treated (bottom) tumors in f. Data in ac are the mean ± s.d. from n = 3 biological replicates; data in d,e from n = 5 biological replicates. Data in f,g are n = 10 biological replicates. Statistical comparisons are Student’s two-tailed t-tests with relevant P values shown in each figure.
Fig. 4 |
Fig. 4 |. STR22 treatment inhibits hypoxia signature gene expression and TNBC tumor growth in vivo.
a, Experimental design of 4T1 syngeneic tumors in the mammary fat pad of BALB/c mice treated with a single tail-vein injection of vehicle or STR22 (50 mg kg−1). b, RT–qPCR analysis of target gene expression from tumors in a 48 h after injection. c, Heat map representation of top hypoxia response mRNA transcript levels in hypoxia hallmark gene set of vehicle-treated and STR-treated tumors. d, GSEA plots generated from mRNA-seq profiles comparing global gene expression in STR-treated versus vehicle-treated tumors. e, Top physiological categories inhibited by STR22 treatment by IPA. Relative mRNA expression in b is normalized to control RPL13A and then normalized to vehicle tumors. Data in a–e represent the mean ± s.d. from n = 5 mice. Statistical comparisons in b are Student’s two-tailed t-tests; those in d were calculated in GSEA software as described in the Methods.
Fig. 5 |
Fig. 5 |. STR22 treatment inhibits malignant TNBC tumor growth and metastasis in vivo.
a, Experimental design of 4T1 syngeneic tumor study. Mice were treated once every other day with PBS vehicle or STR22 (50 mg kg−1) by tail-vein injection. IV, intravenous. bd, Tumor growth curve (b), final tumor mass (c) and mouse body weight (d) from the experiment described in a. e, Representative hematoxylin and eosin (H&E)-stained lung sections from vehicle-treated (left) and STR22-treated (right) mice with metastatic regions identified by blinded pathological scoring are shown as false-colored red in lower images. f, Quantification of spontaneous metastatic lesions on the lung surface (left) or within lung cross-sections by H&E staining (right). g, Incidence of osseous metastases (left) in vehicle-treated or STR22-treated mice, as determined by the inspection of bones and subsequent histological staining. Representative metastasis to the femur in vehicle-treated mouse is shown on the right. Scale bars in e,g, 1 mm. Data are the mean ± s.e.m. from n = 7 biological replicates. Statistical comparisons are Student’s one-tailed t-tests.

References

    1. Gatenby RA & Gillies RJ Why do cancers have high aerobic glycolysis? Nat. Rev. Cancer 4, 891–899 (2004). - PubMed
    1. Hanahan D. & Weinberg RA Hallmarks of cancer: the next generation. Cell 144, 646–674 (2011). - PubMed
    1. Kim JW, Gao P. & Dang CV Effects of hypoxia on tumor metabolism. Cancer Metastasis Rev. 26, 291–298 (2007). - PubMed
    1. Liao D. & Johnson RS Hypoxia: a key regulator of angiogenesis in cancer. Cancer Metastasis Rev. 26, 281–290 (2007). - PubMed
    1. Lee AH, Iwakoshi NN & Glimcher LH XBP-1 regulates a subset of endoplasmic reticulum resident chaperone genes in the unfolded protein response. Mol. Cell. Biol. 23, 7448–7459 (2003). - PMC - PubMed

MeSH terms

Substances

LinkOut - more resources