. 2024 Aug 30;14(1):20239.
doi: 10.1038/s41598-024-70914-5.

Rapid identification of antibody impurities in size-based electrophoresis via CZE-MS generated spectral library

Affiliations

Rapid identification of antibody impurities in size-based electrophoresis via CZE-MS generated spectral library

Quan Liu et al. Sci Rep. .

Abstract

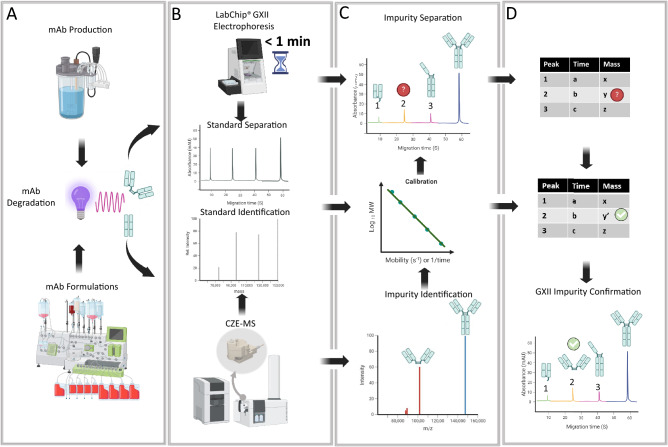
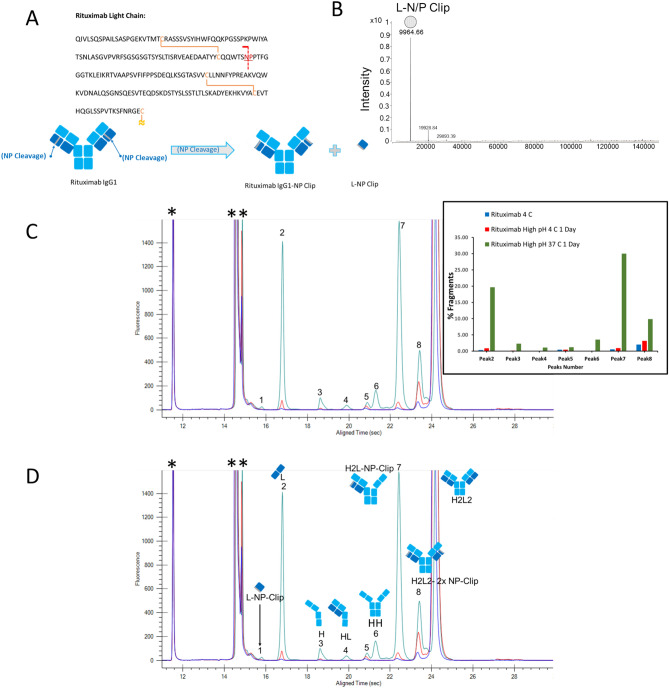
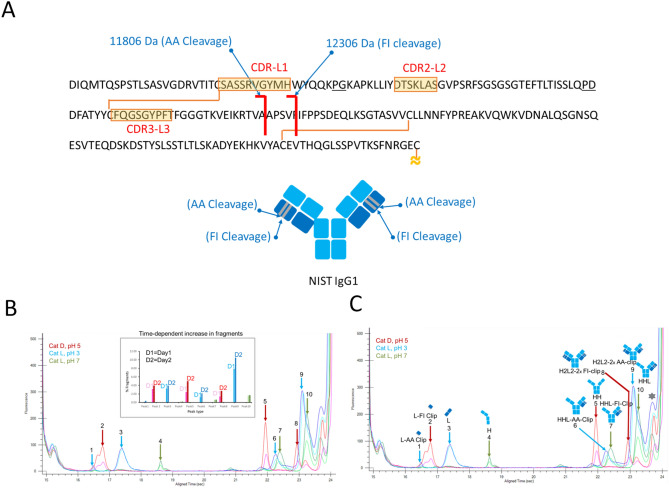
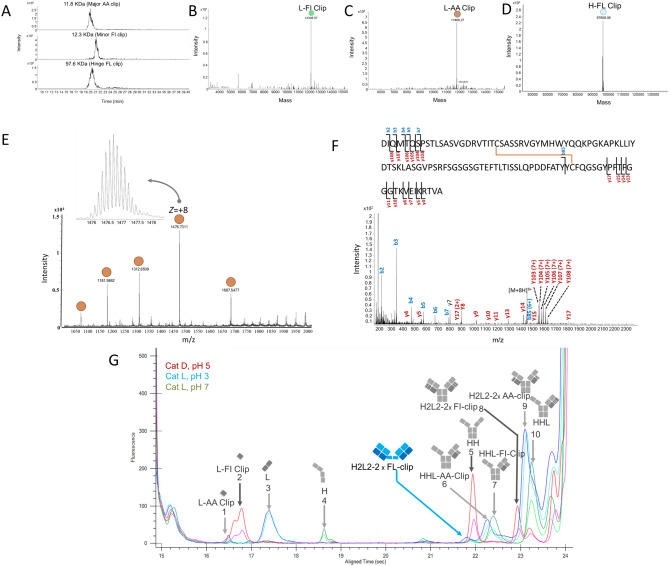
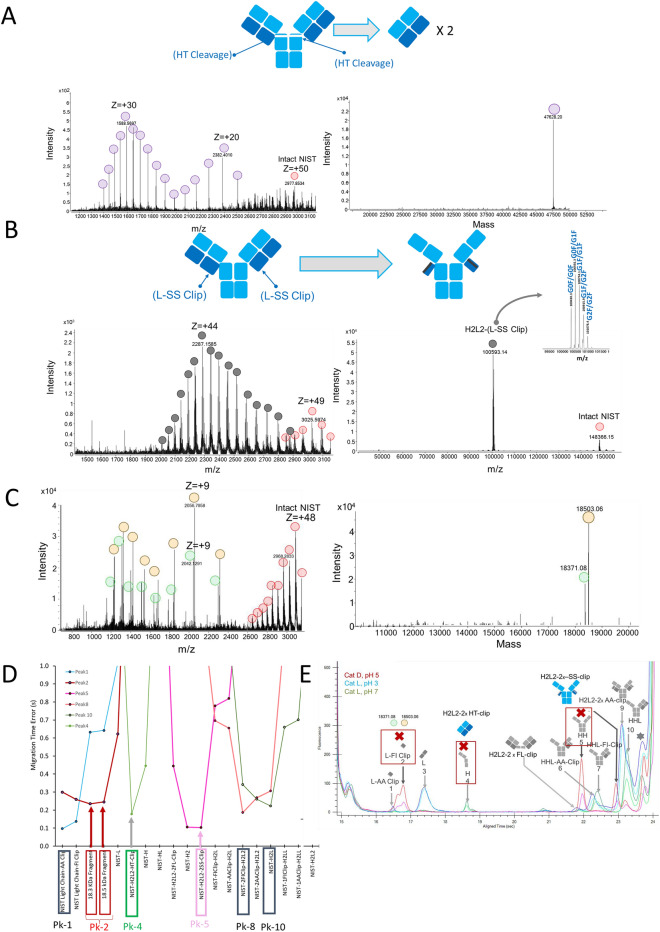
Methods for the reliable and effective detection and identification of impurities are crucial to ensure the quality and safety of biopharmaceutical products. Technical limitations constrain the accurate identification of individual impurity peaks by size-based electrophoresis separations followed by mass spectrometry. This study presents a size-based electrophoretic method for detecting and identifying impurity peaks in antibody production. A hydrogen sulfide-accelerated degradation method was employed to generate known degradation products observed in bioreactors that forms the basis for size calibration. LabChip GXII channel electrophoresis enabled the rapid (< 1 min) detection of impurity peaks based on size, while capillary zone electrophoresis-mass spectrometry (CZE-MS) facilitated their accurate identification. We combine these techniques to examine impurities resulting from cell culture harvest conditions and forced degradation to assess antibody stability. To mimic cell culture harvest conditions and the impact of forced degradation, we subjected samples to cathepsin at different pH buffers or exposed them to high pH and temperature. Our method demonstrated the feasibility and broad applicability of using a CZE-MS generated spectral library to unambiguously assign peaks in high throughput size-based electrophoresis (i.e., LabChip GXII) with identifications or likely mass of the antibody impurity. Overall, this strategy combines the utility of CZE-MS as a high-resolution separation and detection method for impurities with size-based electrophoresis methods that are typically used to detect (not identify) impurities during the discovery and development of antibody therapeutics.

Keywords: Antibody; CE-SDS; CZE-MS; Degradation; Impurity; LabChip.


Conflict of interest statement

The authors declare no competing interests.

Figures

Fig. 1
Fig. 1
A workflow for mAb impurity analysis combining electrophoretic separation and accurate assignment of masses (A) mAb impurities derived by forced degradation conditions emulating cell culture and formulation screening. (B) Analysis of impurity mass ladder derived from mAb using LabChip GXII electrophoresis and CZE-MS (C) CZE-MS spectral mass identifications of mAb impurities are mapped to the GXII peaks in the electropherogram via the calibration curve. (D) Reassignment of GXII peak identifications based on the accuracy of migration times using a lookup table of accurate CZE-MS masses. Note: graphics were created with BioRender.com.
Fig. 2
Fig. 2
(A) Analysis of degradation products of NISTmAb A) LabChip GXII electropherogram of unknown mAb fragments peak 1–5 under unstressed (native condition), red trace and H2S stressed conditions green trace of NISTmAb. Inset is the intact H2L2 with with up to 3 trisulfide adducts. (B) Deconvoluted mass spectrum resulting from H2S-induced degradation products of NISTmAb. (C) Linear regression analysis via NISTmAb fragments, plotted as log10 of the NISTmAb fragment molecular weights (MW) versus the mobility or inverse of migration time. (D) Assignment of masses to GXII peaks based on calibration in C and assignment of peak 4 corresponding to HH. Note: NISTmAb intact molecule is denoted as H2L2, * is aglycosylated H2L2 and degradation products are denoted as L, H, HL, HH, HHL. Note: graphics were created with BioRender.com.
Fig. 3
Fig. 3
Analysis of pH-induced degradation products of Rituximab (A) Rituximab light chain sequence with site-specific NP cleavage. (B) CZE-MS mass spectrum of L-N/P Clip. (C) Overlayed LabChip GXII electropherogram corresponding to pH- and temperature-induced degradation products of Rituximab (Inset shows the intensity of peaks 1–8 under native Rituximab stored at 4 °C (blue), incubated at high-pH of 10 at 4 °C for 1 day (red) and incubated at high-pH of 10 at 4 °C for 2 days (green). (D) Assignment of NP cleavage products of Rituximab to peaks in the electropherogram with identities or masses obtained from the regression analysis. Note: Peak 6~90 kDa, * ~ 1 kDa standard and ** is a system peak from the fluorescent dye.
Fig. 4
Fig. 4
Analysis of Cathepsin D- and Cathepsin L-induced degradation products of NISTmAb (A) NISTmAb light chain sequence with site-specific AA cleavage and FI cleavage. Cathepsin-D and -L cleavages of light chain. (B) Overlayed LabChip GXII electropherogram corresponding to incubation of NISTmab with Cathepsin D at pH 5 (red), Cathepsin L at pH 3 (blue) and Cathepsin L at pH 7 (green) for 1 day (D1) and 2 days (D2) (Inset shows the intensity of peaks 1–10 for cathepsin degradation products at D1 and D2) (C) Assignment of Cathepsin cleavage products of NISTmAb to peaks in the electropherogram with masses obtained from the regression analysis. Note: In addition to peaks 1–10, additional peaks are observed in the electropherogram.
Fig. 5
Fig. 5
GXII peak assignment via CZE-MS identification of cathepsin degradation products of NISTmAb (A) Extracted ion chromatograms of AA, FI and FL clips. (B) Deconvoluted mass spectrum of FI Clip (C), Deconvoluted mass spectrum of AA Clip (D) Deconvoluted mass spectrum of and FL Clip (E). Mass spectrum of Cathepsin L-induced AA Clip shown in brown circles. Inset shows the isotope distribution of Z =  + 8 ion). (F) CZE-MS/MS product ion spectrum of AA Clip resulting from collision induced dissociation of Z =  + 8. Inset shows the fragment ion map of the AA Clip. (G). Assignment of a new peak associated with FL Clip along with electropherogram peak assignments from Fig. 4C.
Fig. 6
Fig. 6
Reannotation of GXII NISTmAb cathepsin-induced degradation products by accurate assignment of MS identifications (A) CZE-MS identification of 47.6 kDa Fab' fragment due to heavy chain HT cleavage with Cathepsin L incubated at pH 7. (B) CZE-MS identification of 100.5 kDa (H2L2-SS Clip) degradation product due to light chain SS cleavage formed by Cathepsin D incubated at pH 5. Inset shows Fc glycans (C) CZE-MS mass spectrum and corresponding deconvolution spectrum of 18.3 kDa and 18.5 kDa fragment masses formed by cathepsin D incubation at pH 5. (D) Migration time error versus degradation products obtained from the spectral library. Note: migration time errors are shown for GXII peaks 1, 2, 4, 5, 8 and 10. The identity of the library species is assigned to the peak in electropherogram when migration time error is minimized. (E) Reassignment of peaks 2, 4 and 5 in GXII electropherogram with accurate identities. Peaks 1, 8 and 10 are validated to the initial assignments in Fig. 4C.

References

    1. Ha, T. K., Kim, D., Kim, C. L., Grav, L. M. & Lee, G. M. Factors affecting the quality of therapeutic proteins in recombinant Chinese hamster ovary cell culture. Biotechnol. Adv.54, 107831 (2022). 10.1016/j.biotechadv.2021.107831 - DOI - PubMed
    1. Atsumi, Y. et al. Clip formation in the complementarity determining region of bevacizumab lowers monomer stability and affinity for both FcRn and FcγR: A comprehensive characterization of the clipped variant including its higher order structure. J. Pharm. Sci.111(12), 3243–3250 (2022). 10.1016/j.xphs.2022.08.024 - DOI - PubMed
    1. Atsumi, Y., Sakurai, N., Nishimura, K., Yamazaki, K. & Wakamatsu, K. Identification and characterization of a monoclonal antibody variant species with a clipping in the complementarity determining region isolated by size exclusion chromatography under native conditions. J. Pharm. Sci.110(10), 3367–3374 (2021). 10.1016/j.xphs.2021.05.023 - DOI - PubMed
    1. Vlasak, J. & Ionescu, R. Fragmentation of monoclonal antibodies. mAbs3(3), 253–263 (2011). 10.4161/mabs.3.3.15608 - DOI - PMC - PubMed
    1. Rustandi, R. R. & Wang, Y. Use of CE-SDS gel for characterization of monoclonal antibody hinge region clipping due to copper and high pH stress. Electrophoresis32(21), 3078–3084 (2011). 10.1002/elps.201100186 - DOI - PubMed

LinkOut - more resources