. 2024 Jun;3(6):714-733.
doi: 10.1038/s44161-024-00474-4. Epub 2024 Jun 6.

Network-based prioritization and validation of regulators of vascular smooth muscle cell proliferation in disease

Affiliations

Network-based prioritization and validation of regulators of vascular smooth muscle cell proliferation in disease

Jordi Lambert et al. Nat Cardiovasc Res. 2024 Jun.

Abstract

Aberrant vascular smooth muscle cell (VSMC) homeostasis and proliferation characterize vascular diseases causing heart attack and stroke. Here we elucidate molecular determinants governing VSMC proliferation by reconstructing gene regulatory networks from single-cell transcriptomics and epigenetic profiling. We detect widespread activation of enhancers at disease-relevant loci in proliferation-predisposed VSMCs. We compared gene regulatory network rewiring between injury-responsive and nonresponsive VSMCs, which suggested shared transcription factors but differing target loci between VSMC states. Through in silico perturbation analysis, we identified and prioritized previously unrecognized regulators of proliferation, including RUNX1 and TIMP1. Moreover, we showed that the pioneer transcription factor RUNX1 increased VSMC responsiveness and that TIMP1 feeds back to promote VSMC proliferation through CD74-mediated STAT3 signaling. Both RUNX1 and the TIMP1-CD74 axis were expressed in human VSMCs, showing low levels in normal arteries and increased expression in disease, suggesting clinical relevance and potential as vascular disease targets.


Conflict of interest statement

M.S. is a shareholder of Enhanc3D Genomics Ltd. H.F.J. is a key opinion leader for Novo Nordisk A/S. The other authors declare no competing interests.

Figures
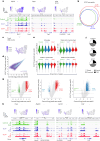
Fig. 1
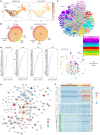
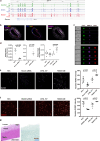
Fig. 1. Activation of VSMCs results in widespread epigenetic activation of distal elements relevant for VSMC function and disease.
a, ATAC-seq traces for markers of contractile VSMCs (Myh11), the synthetic phenotype (Spp1) and a VSMC transition state (Ly6a, encoding SCA1) in EYFP+ lineage-traced VSMCs isolated from healthy control Myh11–EYFP animals (green), and either EYFP+SCA1 (SCA1, blue) or EYFP+SCA1+ (SCA1+, red) cells isolated from injured arteries. Aligned reads for independent experiments with cells from different animals (R1 and R2) and reproducible peaks (horizontal bars) are shown. Uniform manifold approximation and projections (UMAPs, top) show associated normalized, log-transformed gene expression levels (counts/cell) in scRNA-seq profiles of VSMC-derived cells 7 days after injury (GSE162167). b, Venn diagram representing the overlap of ATAC-seq peaks in the three sample types. c, UMAP (as in a), showing the number of detected transcripts (unique molecular identifiers (UMI)) per cell (counts/cell). d, Scatterplot showing the read density in control (x-axis) and SCA1+ VSMCs after injury (y-axis) for ATAC-seq peaks at promoters (light blue) and peaks that are not at promoters (purple). e, Violin plots showing distribution of peak read densities in each sample for all peaks, or only non-promoter, promoter and CpG island peaks. f, Pie charts showing the proportion of peaks within 1 kb of TSSs, at promoter proximal regions (proximal), within genes (genic) or at intergenic elements (distal). g, Volcano plots showing the fold change of the peak intensity (differential accessibility (DA)) between indicated samples. Horizontal lines indicate significance thresholds of Padj < 0.01 (top) and Padj < 0.05 (bottom). Differentially accessible peaks used for pathway enrichment analysis are highlighted (fold change > 2 and of Padj < 0.01, or the top 4,000 ranked by fold change for SCA1+ cells (LIMMA-modified t-test, two sided). The total number of peaks with increased accessibility in SCA1+ cells is 28,000 versus the control and 14,000 versus SCA1). h, Normalized, log-transformed gene expression (counts/cell) and ATAC-seq data tracks (as in a) for genes showing higher accessibility in control samples (Tcap) or SCA1+ cells after injury (Mapk6, Lamb1, Ccl2). Source data
Fig. 2
Fig. 2. VSMC state-specific GRNs.
a, Force-directed graph representation of scRNA-seq data from VSMC-derived cells isolated 5 days after injury (GSE162167) shaded by VSMC states (left; gray, non-assigned) or proliferation-associated pseudotime (right; yellow (low) to red (high) color scale, arbitrary units). FA: ForceAtlas2 dimension. b, Euler diagrams for all nodes and transcription factors in the four GRNs color coded as in a. The total number of nodes or transcription factors for each GRN is shown in brackets. c, The union and intersection of non-RSP, LNK, PrP and CYC networks colored by associated GO terms. The symbol size reflects node degree centrality scores separately in the union and intersection network. d, Nodes with top (30) degree centrality scores in each GRN. e, Network interactions in the PrP GRN with connectivity score > 0.1. Differential expression (fold change in log2 scale) between PrP and non-RSP cells is indicated by a blue (higher in non-RSP) to red (higher in PrP) color scale, white denotes 0. Black borders indicate significant differential expression (Padj < 0.05, two-sided Wilcoxon rank-sum test). Edge widths reflect connectivity magnitude. f, Heat map showing scaled expression for the genes with the 50 highest rewiring scores for PrP versus non-RSP GRNs. Supplementary Fig. 4 shows panels df at enlarged size. Source data
Fig. 3
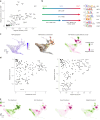
Fig. 3. GRN rewiring after injury aligns with gene expression changes in human and mouse atherosclerosis.
ad, Analysis of GRN node expression in experimental atherosclerosis using scRNA-seq profiles of lineage-traced VSMCs from Apoe-null animals (GSE155513) fed a high-fat diet. a, UMAPs showing cell clusters and annotation (left) and normalized, log-transformed expression (counts/cell) of VSMC state marker genes (right). b, UMAP (as in a) showing the UCell enrichment scores (arbitrary units) of the PrP signature genes (increased expression in PrP versus non-RSP cells, log2 fold change (FC) > 0.5, Padj < 0.05, two-sided Wilcoxon rank-sum test). c, The PrP network, as shown in Fig. 2e, but the shading of nodes represents differential expression (fold change in log2 scale) between modulated and contractile VSMCs in the atherosclerosis mouse model (blue, higher in contractile VSMCs (cluster 1); red, higher in modulated VSMCs (clusters 0 + 3); white denotes 0). Black borders indicate significant differential expression (Padj < 0.05, two-sided Wilcoxon rank-sum test). d, UMAP (as in a) showing normalized, log-transformed expression (counts/cell) for selected genes with high rewiring scores. e,f, Analysis of GRN node expression in VSMCs from a human carotid plaque scRNA-seq dataset (GSE155512). e, UMAPs annotated with cell clusters, patients and normalized, log-transformed expression (counts/cell) of contractile (MYH11) and modulated VSMC genes (TNFRSF11B). f, Heat map showing scaled expression of genes ranked in the top 10 according to rewiring score (PrP versus non-RSP GRNs), and their direct strong interactors (connectivity score > 0.1), in human carotid plaque VSMCs (right) and in the mouse injury dataset (left). Genes are clustered based on correlated expression along the mouse injury VSMC trajectory (left). Supplementary Fig. 5 shows panels c and f at enlarged size. Source data
Fig. 4
Fig. 4. Rewiring of GRNs across cell states identifies candidate regulators of VSMC activation.
a, Comparison of the out-degree centrality scores in PrP and non-RSP GRNs indicating top-scoring nodes. b, Summary of motif enrichment analysis for peaks showing higher accessibility relative to all peaks for the indicated comparisons (left). Detected motifs are shown on the right. c, Force-directed graph projections with shading showing normalized, log-transformed Klf4 expression (counts/cell) (left) and simulation vector field (middle; colors indicate the VSMC state as in Fig. 2a), or the PS values (right) as predicted by in silico knockout of Klf4. d, Sum of positive versus sum of negative PSs for systematic in silico KO (left) and OE (right) simulations. Top-ranked transcription factors are indicated. e, Force-directed graphs showing PSs from in silico simulation of knockout phenotypes for indicated transcription factors. Source data
Fig. 5
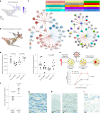
Fig. 5. RUNX1-mediated regulation of VSMC proliferation.
a,b, Force-directed graph of VSMCs isolated 5 days after injury showing normalized, log-transformed Runx1 expression (counts/cell) (a) or the result of RUNX1 overexpression simulation (b; colors indicate VSMC states as in Fig. 2a). c, Direct and indirect targets of Runx1 in the PrP GRN showing differential expression between PrP and non-RSP cells on a blue (higher in non-RSP) to red (higher in PrP) scale where white denotes no change (left, black borders indicate significantly differential expression (fold change in log2 scale), Padj < 0.05, two-sided Wilcoxon rank-sum test) or GO terms for nodes (right). Edge widths reflect connectivity magnitude, and colors show positive (red) and negative (blue) interactions. d, Mmp14 and Timp1 transcript levels detected by quantitative RT-PCR in lineage-labeled VSMCs transfected with non-targeting (NTC) or Runx1-targeting siRNA (Runx1-siRNA), or transduced with an empty vector (CTRL-EV) or RUNX1-overexpressing (RUNX1-OE) lentivirus. The symbols (circles, squares, triangles and inverted triangles) represent values from independent animals (N = 5), the lines represent means and the error bars represent s.e.m.; P value: two-tailed t-test or Mann–Whitney U. e, Schematic of clonal proliferation assay; RFP-expressing lentivirus is used to test the effect of RUNX1 cDNA relative to an empty control vector (EV) on the ability of lineage-labeled VSMCs from Myh11-EYFP animals to form colonies (left). The right panel shows the percentage of cells forming a clonal VSMC patch in RUNX1-OE and empty vector control cells (CTRL-EV). The points indicate mean values from individual animals (N = 4 animals analyzed in triplicate), the lines indicate means and the error bars represent s.e.m.; P = 1.97 × 10−12, generalized linear model. f, Fold change in the percentage of EdU+ cells after siRNA-mediated RUNX1 depletion (RUNX1-siRNA, relative to non-targeting siRNA-treated cells) and lentivirus-mediated RUNX1 overexpression in hVSMCs (RUNX1-OE, relative to cells transduced with empty vector virus). The points are the averages of quadruplicate replicates for independent hVSMC isolates (N = 6 donors), the lines indicate means and the error bars indicate s.e.m.; P value: two-tailed t-test. gi, Representative immunostaining of non-plaque aorta (g,h, N = 10 donors) or carotid endarterectomy samples (i, N = 6 donors) for RUNX1 (brown) and αSMA (blue). FC, fibrous cap; I, intima; M, media. Examples of RUNX1+ cells are indicated by closed arrowheads, and examples of RUNX1αSMA+ cells are indicated by open arrowheads. Source data
Fig. 6
Fig. 6. GRN analysis identifies TIMP1 as a functional gene target and driver of VSMC proliferation.
a, TIMP1 connections in the PrP GRN annotated as in Fig. 5c. b, TIMP1 immunostaining of an atherosclerotic lesion from Myh11–Confetti/Apoe animals showing signals for fluorescent proteins (FP) in lineage-labeled VSMCs (Confetti: cyan (C)FP, blue; red (R)FP, red; yellow (Y)FP, yellow; green (G)FP, green), TIMP1 (magenta) in a single confocal z-section. Representative of three animals. Scale bar = 50 µm (applies to both panels). c, Representative immunohistochemistry image for αSMA (blue) and TIMP1 (brown) in non-plaque human aorta (N = 7 donors); scale bar = 500 µm (overview), 100 µm (zoomed view). d, Fold change in the percentage of EdU+ hVSMCs following 16 h of EdU incorporation in cells treated with 500 ng ml−1 rhTIMP1 relative to vehicle controls. Dots indicate the average of independent hVSMC isolates (N = 6 donors), the line indicates the mean and the error bars indicate the s.e.m.; P value: two-tailed t-test. e, Representative images of lineage-labeled VSMCs isolated from Myh11–Confetti aortas and cultured for 21 days in the presence of a vehicle control, 500 ng ml−1 recombinant mouse TIMP1 or 2 ng ml−1 PDGF-BB. Scale bars = 500 µm. f,g, Quantification of the number and size of clonally expanded patches of Confetti+ VSMCs over 21 days of culture. The points indicate the mean (N = 4 animals, triplicate analysis of cells from each animal), and the error bars indicate the s.e.m.; P = 5.2 × 10−6, generalized linear model. Source data
Fig. 7
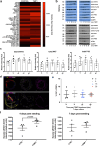
Fig. 7. TIMP1 signaling induces STAT3 phosphorylation in human and mouse VSMCs.
a, Phosphokinase array and densitometric quantification of serum-starved hVSMCs treated for 15 min with 500 ng ml−1 rhTIMP1 or vehicle control (N = 1 donor). b, Western blot of total STAT3, phospho-STAT3 (S727 or Tyr705), total AKT, phospho-AKT (pAKT), total p38a, phospho-p38a (p-p38a) and GAPDH in serum-starved hVSMCs after 0 min, 5 min, 10 min, 15 min and 30 min rhTIMP1. c, Quantification of relative western blot band intensity, normalized to GAPDH. The points show independent hVSMC isolates (N = 4), the bars indicate the means, and the error bars indicate s.e.m.; P value: one-way ANOVA. d, Number of clonally expanded patches formed by lineage-labeled VSMCs following 21 days of culture, without (white, circles) or with 500 ng rmTIMP1 (blue, squares) in samples treated with vehicle (DMSO), 10 µM TT101 (STAT3i), 100 nM MK-2206 (AKTi), 10 µM SB202474 (control inhibitor, ctrl), 10 µM SB203580 (p38i1) or 10 µM SB202190 (p38i2). The points show averages (N = 3 Myh11–Confetti animals analyzed in triplicate), the bars indicate means, the error bars indicated s.e.m.; P value: two-tailed t-test. e, Quantification over time of clonally expanded patches formed by lineage-labeled VSMCs, treated with non-targeting control (NTC) or Stat3-targeting siRNA (siSTAT3) ±500 ng rmTIMP1. The points indicate means (N = 3 Myh11–Confetti animals analyzed in triplicate), and the error bars indicated s.e.m.; P = 2.2 × 10−7, generalized linear model. f, ChIP–qPCR analysis at STAT3 targets (TWIST and JUNB) and negative control (AMICA1), in serum-starved control and rhTIMP1-treated hVSMCs (15 min, 500 ng ml−1), showing anti-STAT3 and control-IgG precipitated DNA as a percentage of the input. The bars show the means of independent hVSMC isolates (N = 3 donors), and the error bars indicate the s.e.m.; P value: two-tailed t-test. g, pSTAT3 S727 immunostaining (magenta) in cryosections from carotid plaque in an Myh11–Confetti/Apoe animal (11 weeks HFD) with Myh11–Confetti signals (CFP, blue; RFP, red; YFP, yellow; GFP, green). Representative of three animals. Scale bar = 50 µm (applies to both images in panel). h,i, pSTAT3 S727 and KI67 immunostaining (h) and quantification (i) of serum-starved control hVSMCs ±500 ng ml−1 rhTIMP1 treatment (15 min, h) or indicated time points (i). The arrowheads indicate KI67+ cells. Scale bars = 50 µm. The symbols show average values for independent hVSMC isolates (N = 3 donors, analyzed in triplicate), the lines represent means and the error bars represent s.e.m.; P value: two-way ANOVA, *P = 0.0498; NS, not significant. Source data
Fig. 8
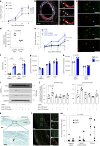
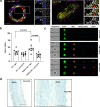
Fig. 8. TIMP1 signals to STAT3 via CD74 in a disease-relevant mechanism.
a, Number of clonal patches formed by lineage-labeled VSMCs, treated with 500 ng ml−1 recombinant TIMP1 or equimolar N-TIMP1 over 21 days of culturing. The points indicate means (N = 4 Myh11–Confetti animals analyzed in triplicate), and the error bars indicate s.e.m.; P value: generalized linear model. b, CD74 immunostaining (magenta), Myh11–Confetti signal and DAPI nuclear staining (white) in carotid arteries 10 days after ligation. The magnified view of the boxed region shows only the RFP Confetti reporter. White pointers mark CD74/RFP double-positive cells. N = 5 Myh11–Confetti animals. Scale bars = 100 µm (overview), 30 µm (zoom). c, Immunostaining for pSTAT3 S727 (red) and CD74 (green) with nuclear DAPI (blue) in mVSMCs treated with 500 ng ml−1 rmTIMP1 4 days after isolation. The arrowheads mark STAT3-high (red) and STAT3-low cells (white). Scale bars = 50 µm. d, Quantification of cellular CD74 levels in c, stratified by nuclear pSTAT3 S727 intensity. The dots show the average per animal (N = 4 animals analyzed in quadruplicate), the lines indicate means and the error bars indicate s.e.m.; P value: two-tailed t-test. e, Number of clonal patches formed by lineage-labeled VSMCs ±500 ng ml−1 rmTIMP1 and/or CD74-blocking antibody or peptide. The points indicate means (N = 4 Myh11–Confetti animals analyzed in triplicate), and the error bars indicated s.e.m.; P value: generalized linear model (CTRL as base variable). Independent generalized linear modeling (TIMP1 as base variable) showed a significant difference between TIMP1 and CD74-antibody+ TIMP1 (P = 0.049). fh, Quantification of imaging flow cytometry of lineage-labeled aortic VSMCs from 13-week-old, HDF-fed (4 weeks) Myh11–EYFP/Apoe animals treated with rmTIMP1 or vehicle control. The symbols show values for individual animals (N = 4 (ctrl), 5 (TIMP1)), the bars indicate means and the error bars indicate s.e.m.; P value: two-tailed t-test. f, Percentages of all VSMCs, or indicated subpopulations, expressing KI67 and CD74. gh, pSTAT3 S727 median fluorescence intensity. i,j, Representative western blot (i) and quantification (j) of serum-starved control and rhTIMP1-treated hVSMCs (5 min) ± pretreatment with CD74-blocking antibody (CD74-ab) or peptide (CD74-pep). The points show independent hVSMC isolates (N = 4 donors), the lines indicate means and the error bars indicate s.e.m.; P value: one-way ANOVA. k, CD74 (brown) and αSMA (blue) immunohistochemistry in non-plaque human aorta. Scale bars = 500 µm (overview), 100 µm (zoom). N = 7 donors. l, RNA in situ hybridization for ACTA2 (green), TIMP1 (blue) and CD74 (red) in a human healthy aorta and a plaque-containing carotid artery. The arrows indicate TIMP1/ACTA2+ (red) and CD74/ACTA2+ cells (blue). Scale bars = 250 µm (overview), 50 µm (zoom). m, Quantification of TIMP1 or CD74 expression in ACTA2+ cells in non-plaque aortas (Healthy media) or carotid endarterectomy regions (Media under plaque, Plaque). The symbols indicate different donors (N = 4 donors per condition), the lines indicate means and the error bars indicate s.e.m.; P value: one-way ANOVA. Source data
Extended Data Fig. 1
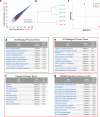
Extended Data Fig. 1. Quality assessment of ATAC-seq data and gene ontology analysis of differentially accessible genes.
a, Scatter plot for two independent biological replicates of ATAC-seq profiling for SCA1+ cells showing high correlation between replicates. Colors show point density on a blue (low)-to-red (high) scale. b-c, Hierarchical clustering (b) and principal component analysis (c) of ATAC-seq samples, confirming similarity of replicate samples for all conditions. d, Significantly enriched gene ontology (GO) biological process terms for genes associated with peaks that are more accessible in the control samples from healthy animals, compared to SCA1+ cells isolated from injured arteries. e-g, Significantly enriched GO biological process (e), disease (f) and signaling pathway terms (g) for genes associated with peaks that are more accessible in SCA1+ cells isolated from injured arteries compared to the control samples from healthy animals. Significance was assessed with binomial testing (binom) in the GREAT package (http://great.stanford.edu/public/html/). Source data
Extended Data Fig. 2
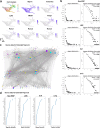
Extended Data Fig. 2. GRN analysis supplement.
a, Force-directed graph of scRNA-seq profiles of VSMCs analyzed 5 days after injury showing the cell clusters and normalized, log-transformed expression of markers characteristic of different VSMC states and selected genes. b, Degree distributions for constructed GRNs. c, Community detection in the union of all four networks, coloured by gene ontology terms as in Fig. 2c. d, Nodes with top (30) degree centrality scores for the equivalent GRNs constructed with scRNA-seq profiles of VSMCs analyzed 7 days after injury. Supplementary Fig. 6 shows panel d at enlarged size. Source data
Extended Data Fig. 3
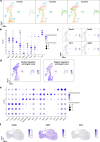
Extended Data Fig. 3. Gene expression changes of GRN nodes in human and murine atherosclerosis scRNA-seq datasets.
a-d, Analysis of scRNA-seq profiles of VSMC lineage-traced cells from a murine atherosclerosis model (GSE155513). a, UMAP showing cluster annotation for cells isolated after 8, 16 or 22 weeks. b, Dot plot showing expression across VSMC clusters for contractile genes (Myh11, Acta2), markers of ‘minor SMCs’ (Rgs5, Pan et al., 2020), genes expressed by synthetic VSMCs (Spp1, Col8a1, Tnfrsf11b), a VSMC transition state (Vcam1, Ly6a) and fibroblast-like (F3), fibrochondrocyte (Sox9) or macrophage-like (C1qc) VSMCs. Scaled expression levels are shown on a gray-to-blue scale and dot size represent the percentage of expressing cells. c-d, UMAP showing normalized, log-transformed expression of indicated genes (c) or the UCell signature enrichment scores for the 10 top trajectory-stimulating (Positive regulators) or trajectory-blocking (Negative regulators) transcription factors (ranked by perturbation score), and associated direct target genes (positive interactions, connectivity score>0.1, d). e-f, Analysis of VSMC profiles from human carotid plaque scRNA-seq dataset (GSE155512). e, Dot plot showing gene expression across VSMC subclusters for contractile VSMC markers (MYH11, ACTA2, TAGLN, CNN1), genes associated with phenotypically modulated VSMCs (COL8A1, TNFRSF11B, MMP2, MGP, VCAM1) and genes associated with different VSMC clusters (CCL2, RPS6, RPS12). Scaled expression levels are shown on a gray to blue scale and dot size represent the percentage of expressing cells. f, Normalized, log-transformed expression of selected genes is shown on a gray-blue scale on a UMAP.
Extended Data Fig. 4
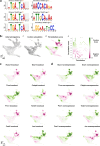
Extended Data Fig. 4. In silico network simulation results.
a, The RUNX, CEBP and NFκB motifs were detected adjacent to the AP-1 motif in peaks showing increased accessibility in SCA1+ cells after injury compared to control VSMCs from no-surgery animals. b, Schematic explaining how perturbation scores were generated. Left panels show vector fields for inferred cell state trajectory (i) and results of in silico perturbation of transcription factor levels (ii) on a force directed graph representation. Right panels show the computed cell perturbation score on a force directed graph representation (iii) or as a function of pseudotime (iv). Negative (pink) and positive scores (green) were summarized separately for cells in the Non-RSP, LNK, PrP and CYC states. (c, d) Force-directed graph of VSMCs isolated 5 days after injury, showing perturbation scores from in silico knockout (KO, c) or overexpression (OE, d) simulation for the indicated transcription factors with the color-coding described in b.
Extended Data Fig. 5
Extended Data Fig. 5. Analysis of RUNX1 as a candidate VSMC regulator.
a, ATAC-seq data tracks for the Runx1 locus, annotated as described in Fig. 1a. b, RUNX1 immunostaining in cryosections from the injured left carotid artery of a Myh11-Confetti animal, Scale bar= 50 µm. Representative of 2 animals. Signals for RUNX1 (magenta), nuclear DAPI (white) and confetti lineage-labeling are shown as indicated. c, Imagestream analysis of lineage-labeled EYFP+ (green) VSMCs from Myh11-EYFP animals stained for SCA1 (red) and MMP14 (magenta). Left columns show brightfield images. Representative of 3 animals. d, Runx1 and Cebpd transcript levels detected by quantitative RT-PCR in mVSMCs transfected with non-targeting (NTC) or Runx1-targeting siRNA (Runx1-siRNA), or transduced with an empty vector (CTRL-EV) or RUNX1-overexpressing (OE) lentivirus. Dots show values for cells from independent animals (N = 5), lines mean, error bars SEM, p-value: two-tailed MWU (Runx1) or two-tailed t-test (Cebpd). e-f, Immunofluorescence staining of RUNX1 in mVSMCs (e) and hVSMCs (f) transfected with non-targeting (NTC) or Runx1-targeting siRNA (Runx1-siRNA), or transduced with an empty vector (CTRL-EV) or RUNX1-overexpressing (OE) lentivirus. Scale=100 µM. Graph shows quantification of nuclear RUNX1 signals. Dots show values for cells from individual animals (E, N = 4, p-value: two-sided MWU) or hVSMC isolates from different donors (F, N = 3, p-value: two-sided t-test), lines mean, error bars SEM, p-value: two-tailed t-test. g, Representative images (N = 5) of non-plaque aorta with intimal thickening showing sequential sections after H&E (left) or immunostaining for αSMA (blue) and RUNX1 (brown). Scale bars = 100 µm. Lumen, intima, media and adventitia are indicated. Source data
Extended Data Fig. 6
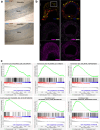
Extended Data Fig. 6. Impact of TIMP1 on VSMCs.
a, Example immunohistochemistry images for α-smooth muscle actin (αSMA, blue) and TIMP1 (brown) in non-plaque human aorta. Scale bar=500 µm. N = 7 donors. b, Representative images of TIMP1 immunostaining in cryosections of an atherosclerotic plaque from Myh11-Confetti/Apoe animals fed a HFD (right, N = 3) or an injured Myh11-Confetti carotid artery (left, N = 3 animals). Signals for TIMP1 (magenta), nuclear DAPI (white) and confetti lineage-labeling (CFP: blue, RFP: red, YFP: yellow, GFP: green) are shown as indicated. White box indicate region shown in Fig. 6b. Scale bar = 50 μm (left), 20 μm (right). c, Enrichment plots from gene set enrichment analysis (GSEA) for E2F targets (padj = 0.005), G2M checkpoint genes (padj= 0.04), adipogenesis (padj = 0.023) bile acid metabolism (padj = 0.00376), fatty acid metabolism padj = 0.00337) and oxidative phosphorylation (padj = 0.022) in bulk RNA-seq data from hVSMCs treated with 500 ng/mL recombinant human TIMP1 for 6 hours versus control cells (N = 6 independent human VSMC isolates/donors).
Extended Data Fig. 7
Extended Data Fig. 7. TIMP1 induces phosphorylation of STAT3 in VSMCs.
a, Heatmap showing relative spot intensity of phosphokinase array analysis of hVSMCs following 15 minutes 500 ng/mL rhTIMP1 or vehicle control treatment on a black (low) to red (high) scale [AU]. N = 1. b, Western blots of hVSMCs from 4 different donors showing total, pS727 and pTyr705 STAT3, total and phospho AKT, total and phospho-p38 (p-p38), and GAPDH in serum-starved cells after 0, 5 10, 15 or 30 minutes rhTIMP1 treatment. c, Quantification of relative band intensity in (b) for total STAT3, total AKT and total p38 protein levels, normalized to GAPDH. Points show independent hVSMC isolates (N = 4 donors), bars mean, error bars SEM. d, pSTAT3 S727 immunostaining (magenta) in cryosections from injured carotid artery of Myh11-Confetti (top, N = 3 animals) or atherosclerotic plaque from Myh11-Confetti/Apoe animals fed a HFD (lower panel, N = 3). Signals for nuclear DAPI (white) and confetti lineage-label are also shown. White box indicate region shown in Fig. 6g. Scale bar= 50 μm. e, %KI67+ hVSMCs in samples treated with 500 ng/mL rhTIMP1 following serum-starvation for indicated timepoint. Symbols show average values for independent hVSMC isolates (N = 3, analyzed in triplicate), lines the mean, error bars SEM. f, Nuclear pSTAT3 (S727) intensity in FACS-isolated EYFP+ mVSMCs without (CTRL, dots) or with 500 ng/mL rmTIMP1 (squares) either 4 (left) or 7 days post seeding (right). Symbols show average values from independent (N = 4 Myh11-EYFP animals analyzed in quadruplicate), lines mean, error bars SEM, p-value: two-tailed t-test. Source data
Extended Data Fig. 8
Extended Data Fig. 8. CD74 expression and function in VSMCs.
a, Example images of immunostaining for CD74 (magenta) in cryosections of Myh11-Confetti lineage-labeled carotid arteries, analyzed 28 days (left) or 10 days post carotid ligation (right). Arrows mark CD74+ lineage labeled VSMCs. Scale bars: 100 µm (overview), 30 µm (zoomed). N = 5 animals. b, Bar graph showing the percentage of EdU+ lineage-labeled VSMCs in samples infected with lentivirus carrying an empty vector (EV) or overexpressing RUNX1 (OE) in the presence of a control (IgG) or a CD74 blocking antibody (CD74). VSMC-lineage labeled medial cells were isolated from mouse aorta. Points show values for different animals (N = 8), bars the mean, error bars SEM, p-value: one-way ANOVA. c, Example imagestream analysis of lineage-labeled EYFP+ (green) VSMCs from Myh11-EYFP/Apoe animals stained for KI67 (orange), pSTAT3 S727 (magenta) and CD74 (red). Left columns show brightfield images. d, Example images of CD74 (brown) and αSMA (blue) immunostaining in non-plaque human aorta. Scale bar=500 µm. N = 7 tissue samples from different donors. Source data

References

    1. Örd T, et al. Single-cell epigenomics and functional fine-mapping of atherosclerosis GWAS loci. Circ. Res. 2021;129:240–258. doi: 10.1161/CIRCRESAHA.121.318971. - DOI - PMC - PubMed
    1. Turner AW, et al. Single-nucleus chromatin accessibility profiling highlights regulatory mechanisms of coronary artery disease risk. Nat. Genet. 2022;54:804–816. doi: 10.1038/s41588-022-01069-0. - DOI - PMC - PubMed
    1. Liu B, et al. Genetic regulatory mechanisms of smooth muscle cells map to coronary artery disease risk loci. Am. J. Hum. Genet. 2018;103:377–388. doi: 10.1016/j.ajhg.2018.08.001. - DOI - PMC - PubMed
    1. Chappell J, et al. Extensive proliferation of a subset of differentiated, yet plastic, medial vascular smooth muscle cells contributes to neointimal formation in mouse injury and atherosclerosis models. Circ. Res. 2016;119:1313–1323. doi: 10.1161/CIRCRESAHA.116.309799. - DOI - PMC - PubMed
    1. Feil S, et al. Transdifferentiation of vascular smooth muscle cells to macrophage-like cells during atherogenesis. Circ. Res. 2014;115:662–667. doi: 10.1161/CIRCRESAHA.115.304634. - DOI - PubMed

Publication types

MeSH terms

Substances