. 2024 Jun;3(6):754-769.
doi: 10.1038/s44161-024-00488-y. Epub 2024 Jun 17.

Distinct biological signature and modifiable risk factors underlie the comorbidity between major depressive disorder and cardiovascular disease

Affiliations

Distinct biological signature and modifiable risk factors underlie the comorbidity between major depressive disorder and cardiovascular disease

Jacob Bergstedt et al. Nat Cardiovasc Res. 2024 Jun.

Abstract

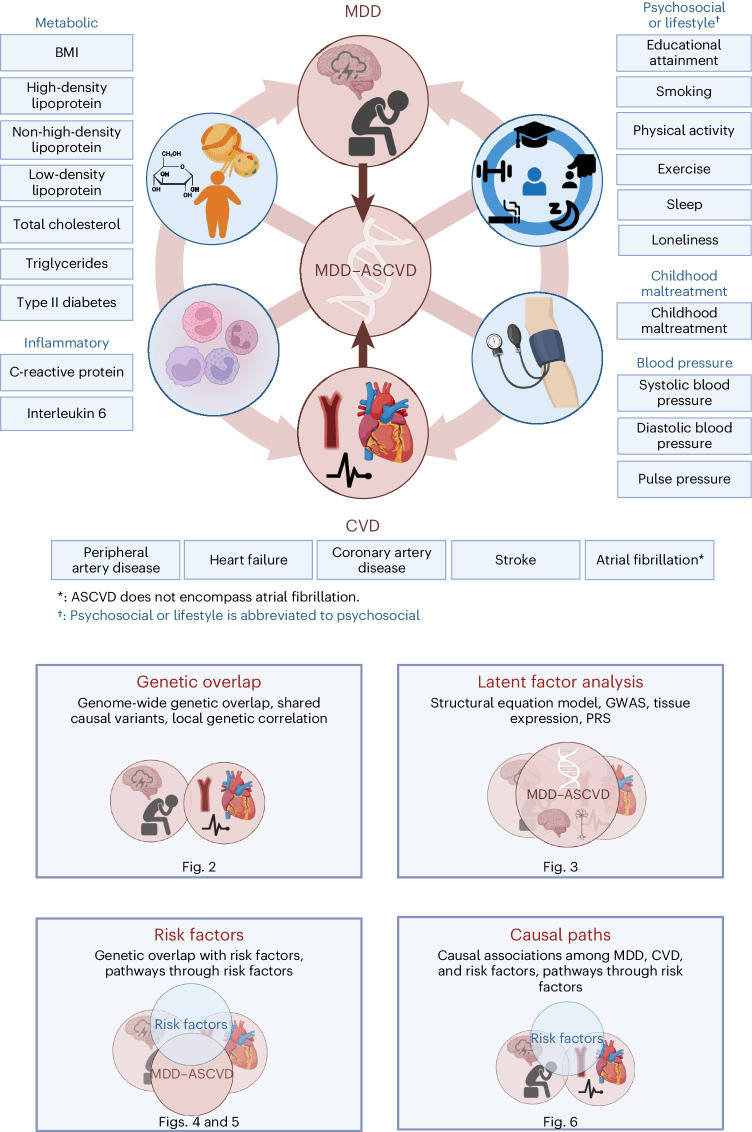
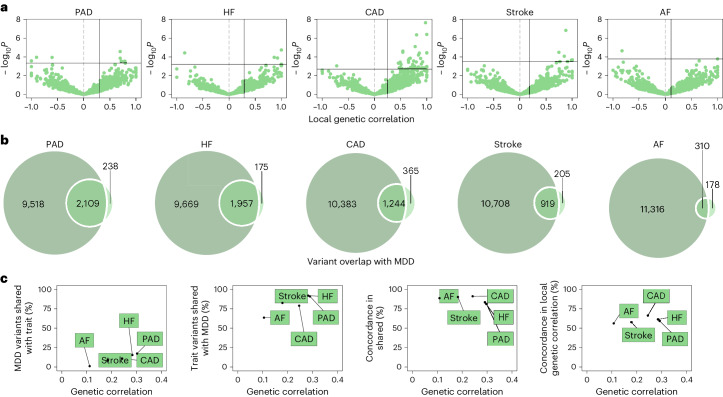
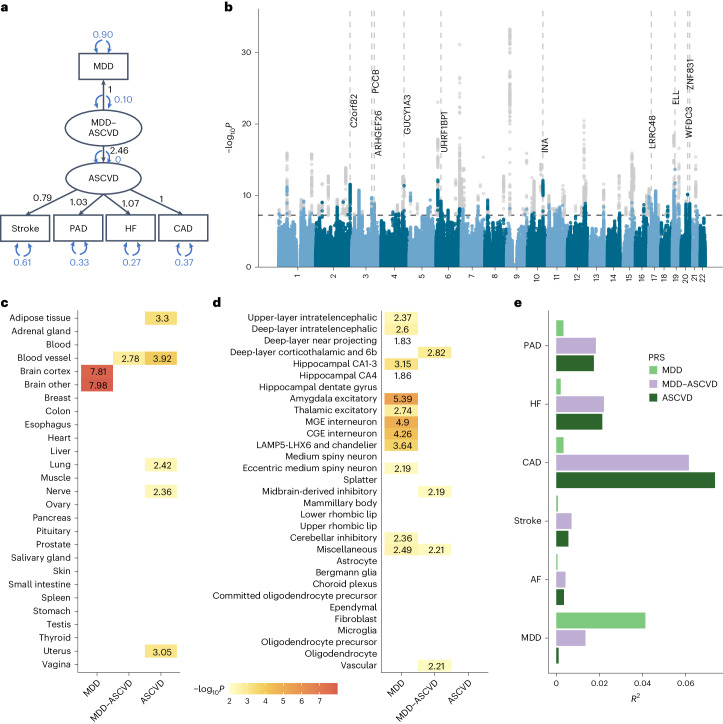
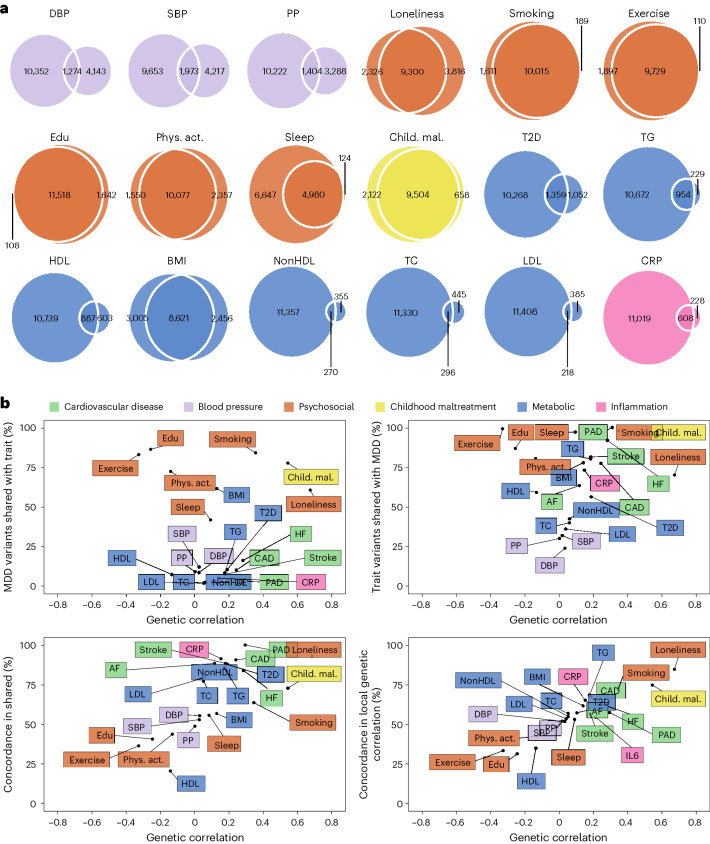
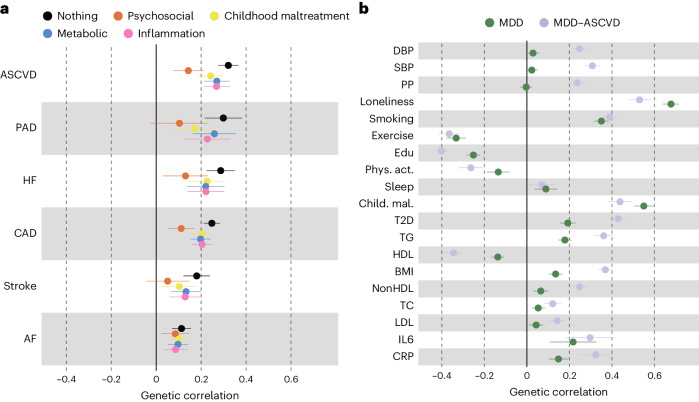
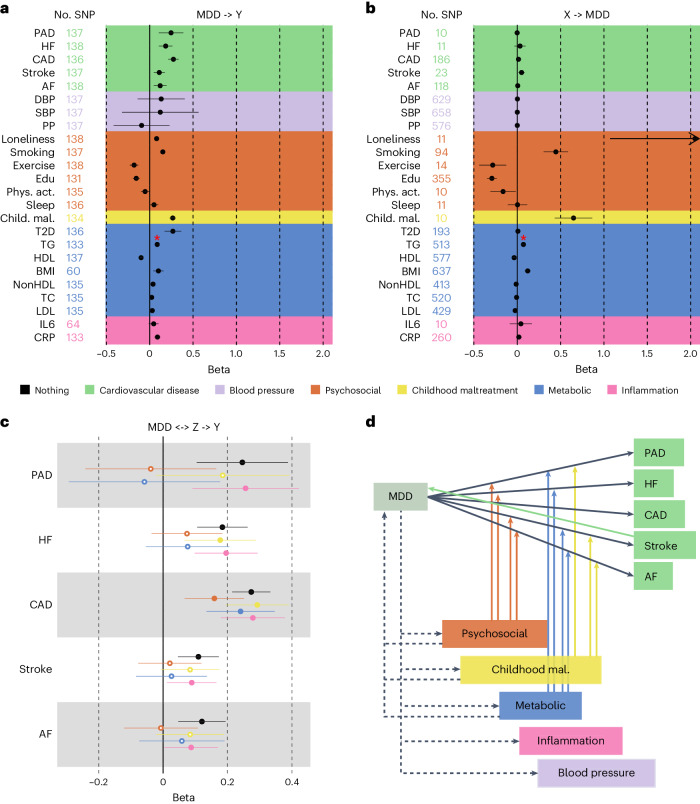
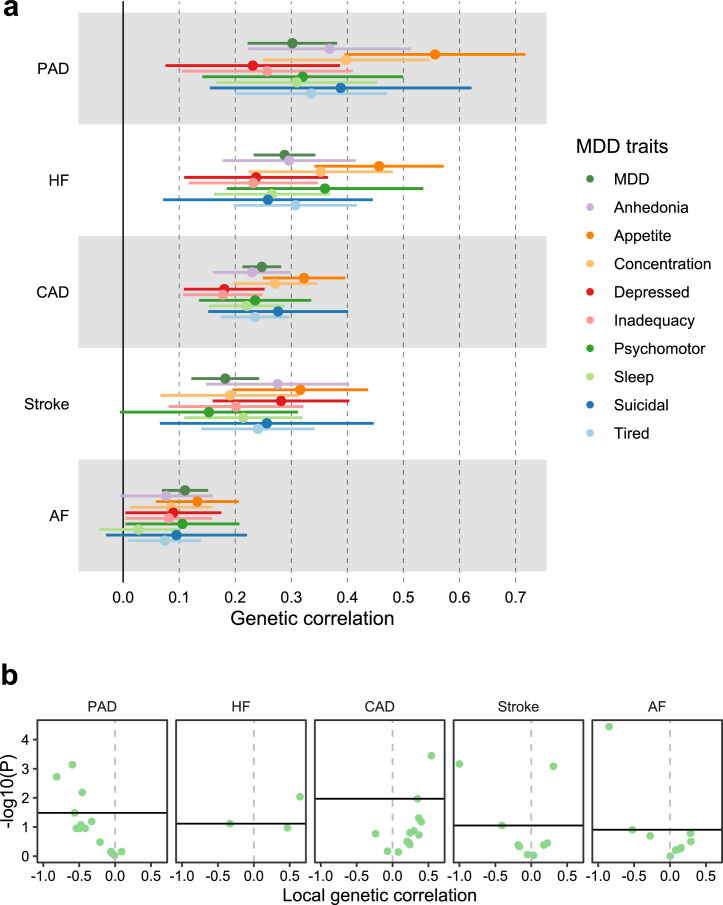
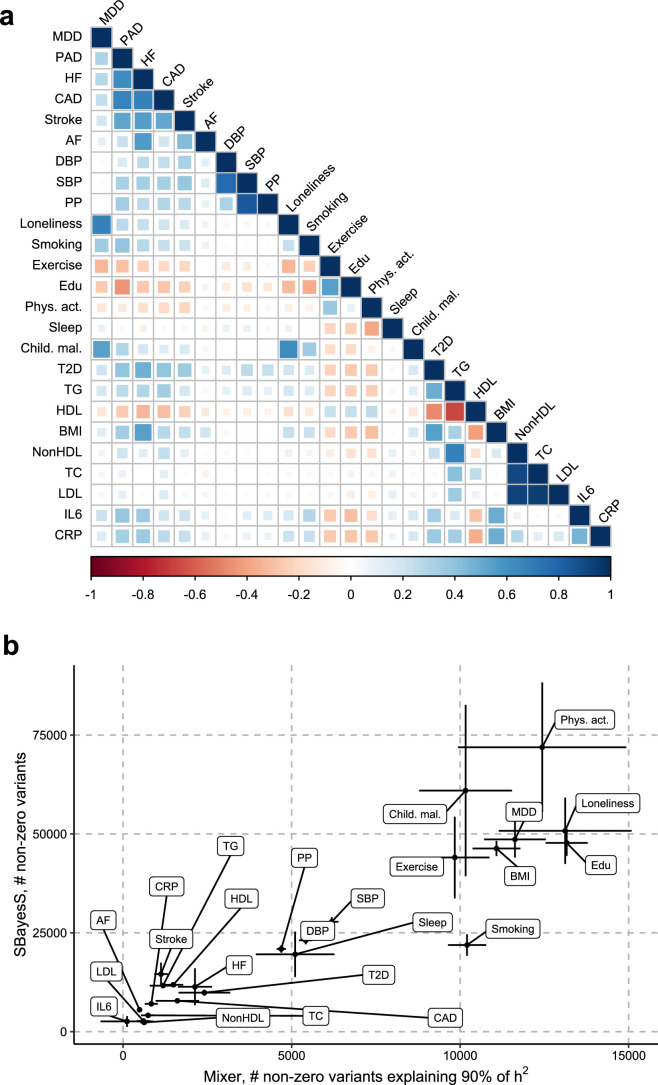
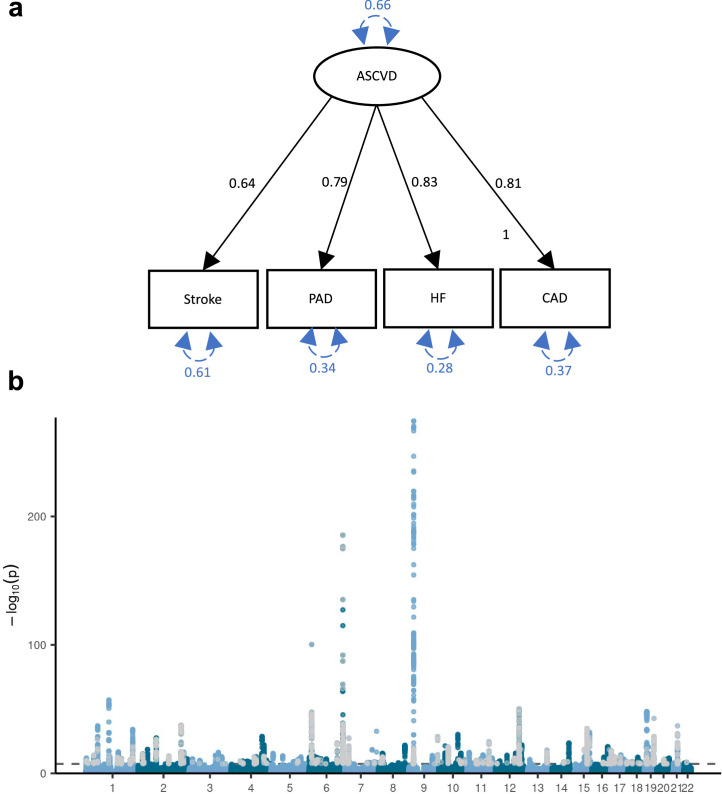
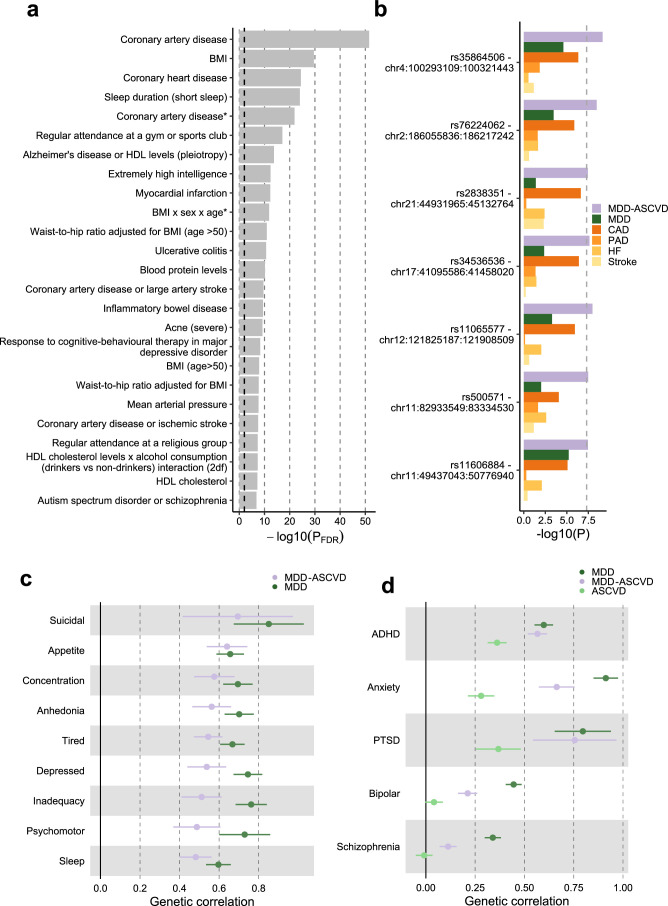
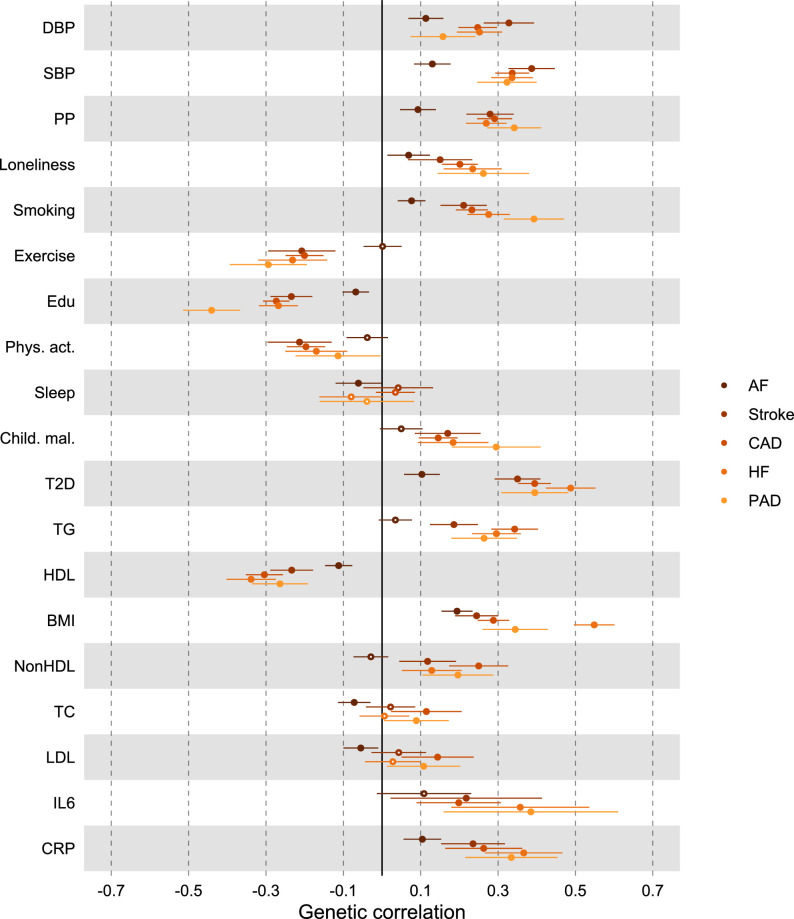
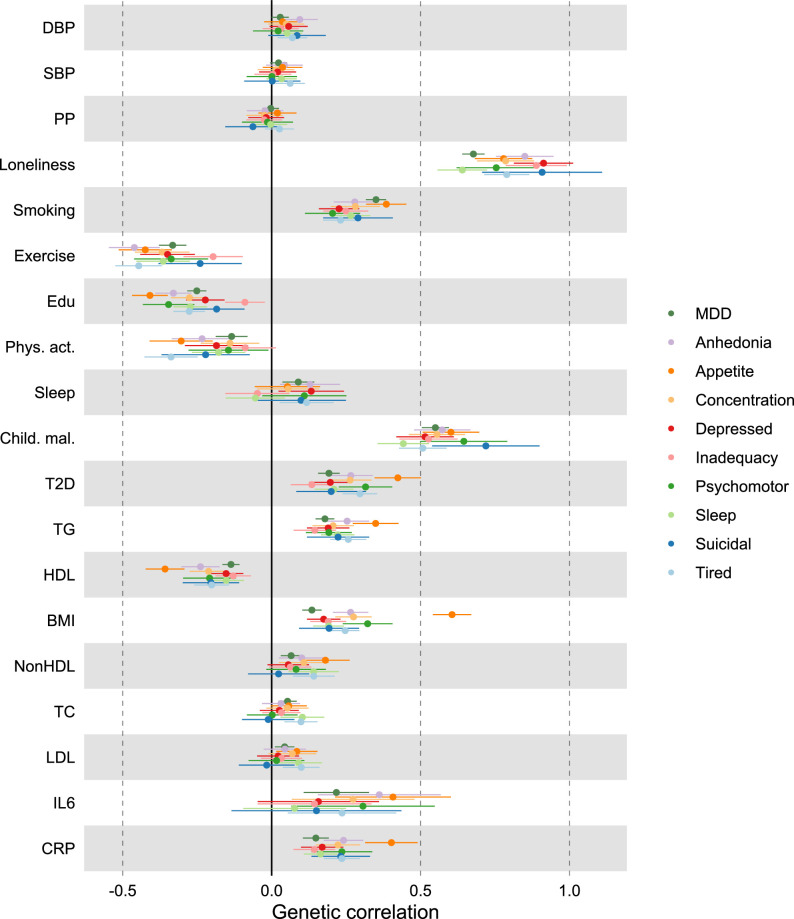
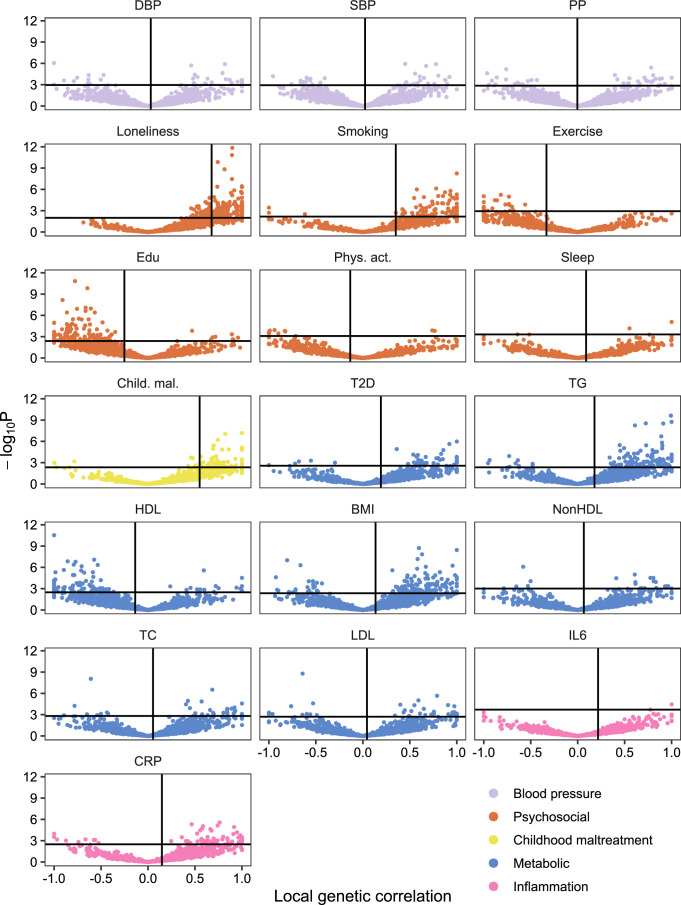
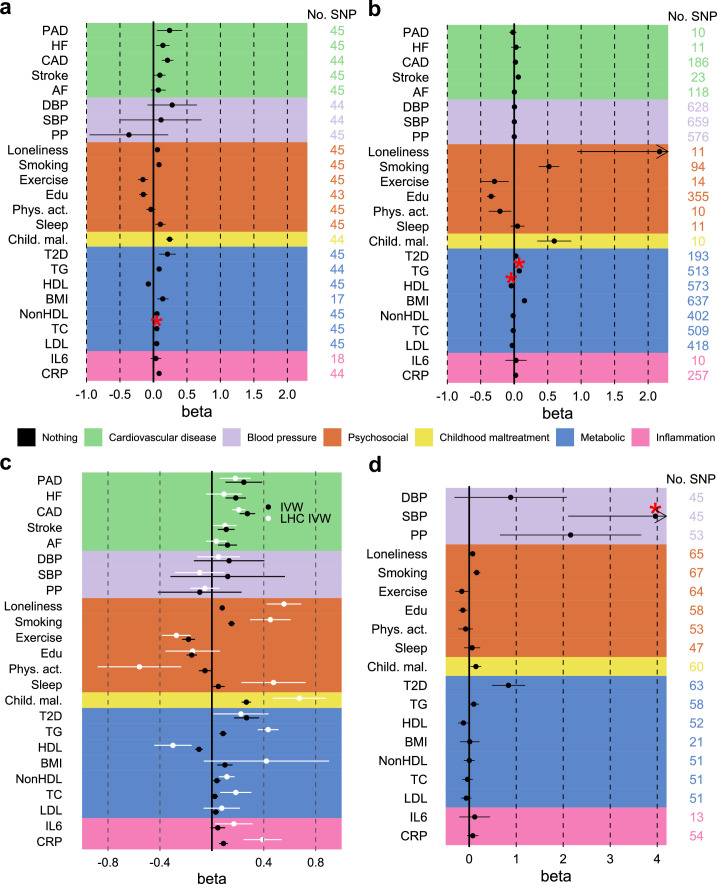
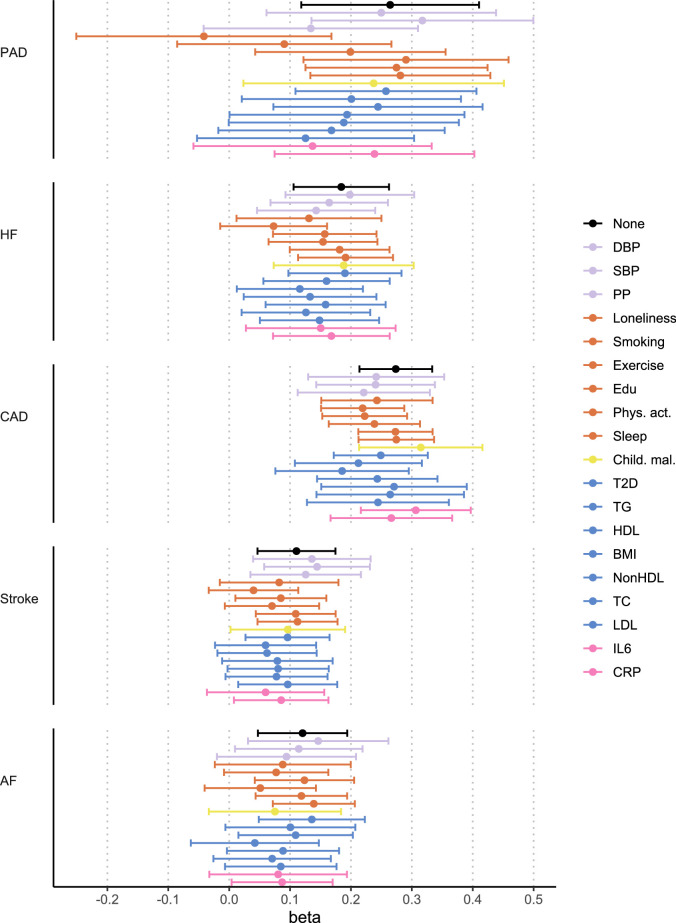
Major depressive disorder (MDD) and cardiovascular disease (CVD) are often comorbid, resulting in excess morbidity and mortality. Here we show that CVDs share most of their genetic risk factors with MDD. Multivariate genome-wide association analysis of shared genetic liability between MDD and atherosclerotic CVD revealed seven loci and distinct patterns of tissue and brain cell-type enrichments, suggesting the involvement of the thalamus. Part of the genetic overlap was explained by shared inflammatory, metabolic and psychosocial or lifestyle risk factors. Our data indicated causal effects of genetic liability to MDD on CVD risk, but not from most CVDs to MDD, and showed that the causal effects were partly explained by metabolic and psychosocial or lifestyle factors. The distinct signature of MDD-atherosclerotic CVD comorbidity suggests an immunometabolic subtype of MDD that is more strongly associated with CVD than overall MDD. In summary, we identified biological mechanisms underlying MDD-CVD comorbidity and modifiable risk factors for prevention of CVD in individuals with MDD.


Conflict of interest statement

C.M.L. sits on the SAB of Myriad Neuroscience and has received speaker/consultancy fees from SYNLAB and UCB. A.D.B. has received speaker’s honoraria from Lundbeck. O.A.A. is a consultant to Cortechs.ai and Precision Health, and has received speaker’s honoraria from Lundbeck, Janssen, Otsuka and Sunovion. P.F.S. has received consulting fees from and is a shareholder of Neumora Therapeutics. The other authors declare no competing interests.

Figures

Fig. 1
Fig. 1. Study design.
The comorbidity between MDD and CVD was investigated using genetic and causal inference methods, including assessing overlap with and mediation through shared risk factors (blood pressure, psychosocial or lifestyle, childhood maltreatment, metabolic and inflammation; Supplementary Table 1). The risk factor group psychosocial or lifestyle is abbreviated to psychosocial. Created with BioRender.com (license agreements VG26BG3VTL, MK26BG46H3).
Fig. 2
Fig. 2. Genetic overlap between MDD and CVD beyond genome-wide genetic correlation.
a, Volcano plots based on LAVA results showing genomic loci (green dots) with the local genetic correlation between MDD and each of the CVDs (x axis) and the corresponding P value (y axis). Loci exceeding the horizontal line are significant at PFDR < 0.05 (Benjamini–Hochberg-adjusted P value). Multiple testing was performed separately for each trait over all considered loci. Empirical P values were obtained via a permutation procedure with partial integration, evaluating the two-sided hypothesis of no association using the estimated parameters as test statistics. b, Venn diagrams based on MiXeR results showing the number of causal variants (number of nonzero variants required to explain 90% of trait heritability) that are unique to MDD (left circle), unique to CVD (nonoverlapping part of right circle) or shared between MDD and CVD (overlapping part of circles). c, Genetic correlation estimated by LDSC (x axis) against the percentage of MDD causal variants that are shared with the CVD trait as estimated by MiXeR (first plot), the percentage of CVD trait causal variants that are shared with MDD (second plot) and the percentage of shared variants that have concordant effect directions (third plot). The fourth plot shows the percentage of local genetic correlations from LAVA that have concordant effect directions on the y axis. In ac, the sample sizes and information for underlying summary statistics GWASs are reported in Supplementary Table 1. AF, atrial fibrillation; CAD, coronary artery disease; HF, heart failure; PAD, peripheral artery disease. Source data
Fig. 3
Fig. 3. Shared genetic liability latent factor for MDD–ASCVD.
a, The latent factor model as specified in genomic SEM with the ‘observed’ variables in rectangles and the latent variables in circles. Factor loadings (standardized with respect to the genetic variance of the traits) are given in black and variances in blue. b, Latent MDD–ASCVD factor GWAS results. The x axis shows the genomic position and the y axis shows statistical significance as −log10P. Genome-wide significant SNPs (P< 5 × 10−8) that were filtered out because of significant heterogeneity QSNP are displayed in gray. The top ten eQTL genes are displayed with dashed vertical lines indicating their position. P values were computed using a two-sided Z-test. c, Enrichment results in GTEx tissues for the latent MDD–ASCVD factor, with latent ASCVD (without MDD) and MDD only as comparison. d, Enrichment results for the latent MDD–ASCVD factor, latent ASCVD and MDD only in brain cell types. e, The proportion of variance explained in MDD and CVD phenotypes in the UKB (defined using ICD codes listed in Supplementary Table 14) by each of three PRSs for the latent MDD–ASCVD factor, latent ASCVD or MDD only. c,d, Enrichment is measured using significance testing in a one-sided Z-test displayed as −log10(P). Only tissues with a significant association (PFDR < 0.05; Benjamini–Hochberg adjustment for multiple testing) are shown. Multiple testing was performed over tested tissues/cell-types. In ae, sample sizes and information for underlying GWAS summary statistics are reported in Supplementary Table 1. MDD–ASCVD, common factor for MDD and ASCVD; ASCVD, common factor for the atherosclerotic cardiovascular diseases. CA, cornu ammonis; CGE, caudal ganglionic eminence; MGE, medial ganglionic eminence. Source data
Fig. 4
Fig. 4. Local and causal-variant level genetic correlations between MDD and risk factors.
a, Venn diagrams based on MiXeR results showing the number of causal variants (number of nonzero variants required to explain 90% of trait heritability) that are unique to MDD (left circle), the risk factor (nonoverlapping part of right circle) or shared between MDD and the risk factor (overlapping part of circles). b, Genome-wide genetic correlation estimated by LDSC (rg, x axis) against the percentage of MDD causal variants that are shared with the risk factor as estimated by MiXeR (top left), the percentage of risk factor causal variants that are shared with MDD (top right) and the percentage of shared variants that have concordant effect directions (bottom left). The bottom right plot shows the percentage of local genetic correlations from LAVA that have concordant effect directions on the y axis. Cardiovascular traits are also shown for comparison. For a and b, standard errors for MiXeR, LAVA and LDSC results are reported in Supplementary Tables 2–6. Sample sizes for GWAS summary statistics are reported in Supplementary Table 1. Note that IL6 was excluded from MiXeR results because it failed performance checks (Methods). Child. mal., childhood maltreatment; CRP, C-reactive protein; DBP, diastolic blood pressure; edu, educational attainment; HDL, high-density lipoprotein; LDL, low-density lipoprotein; nonHDL, non-high-density lipoprotein; phys. act., physical activity; PP, pulse pressure; psychosocial, psychosocial or lifestyle; SBP, systolic blood pressure; T2D, type II diabetes; TC, total cholesterol; TG, triglycerides. Source data
Fig. 5
Fig. 5. Genetic correlation between MDD and CVD explained by risk factors.
a, The genetic correlation between MDD and CVD before and after adjustment for groups of risk factors (color coded). b, A comparison of genetic correlation between MDD (dark green) and the latent MDD–ASCVD factor (lilac) and individual risk factors. In a and b the points and error bars represent mean genetic correlation and 95% CIs. The sample sizes for GWAS summary statistics are reported in Supplementary Table 1. Source data
Fig. 6
Fig. 6. Support for causal effects between MDD, CVD and shared risk factors.
a, The effect of genetic instruments for MDD (exposure) on CVD and risk factors (outcomes). b, The effect of genetic instruments for CVDs and risk factors on MDD. The arrow indicates that the CI for the effect of loneliness on MDD has been cut to improve readability. c, The effects of genetic instruments for MDD on CVD while adjusting for groups of risk factors in multivariable MR. d, A schematic overview of levels of evidence for causal effects, with solid lines indicating convincing evidence (consistent across sensitivity analyses) for such effects and dashed lines indicating evidence for some of the relationships tested within the trait categories. The arrows from the risk factors to the association between MDD and the CVDs indicate that the combined risk factors attenuated the association so that it was no longer statistically significant. In ac, the IVW estimate is shown. The results from the sensitivity analyses are reported in Supplementary Table 18. In ad, the points and error bars represent mean effect size (regression coefficient) and 95% CIs. The sample sizes for GWAS summary statistics are reported in Supplementary Table 1. The term beta refers to the log odds ratio. The asterisk (*) indicates that the observed statistically significant association suffered from pleiotropy; possible causal effect should not be interpreted. Source data
Extended Data Fig. 1
Extended Data Fig. 1. Genetic correlation of MDD and MDD symptoms with CVDs.
a, Results are based on LD Score Regression analysis. Points and error bars represent mean genetic correlation and 95% CIs. b, Local genetic correlation between MDD and CVDs in 16 loci in the HLA region. Only loci with marginally statistically significant local heritability for both traits are shown. Points above the vertical line are significant based on multiple testing adjustment for considered loci performed for each CVD trait separately. Multiple testing was adjusted for using the Benjamini-Hochberg procedure. Empirical P-values were obtained via a permutation procedure with partial integration, evaluating the two-sided hypothesis of no association using the estimated parameters as test statistics a-b Sample sizes for underlying GWAS summary statistics are reported in Supplementary Table 1. AF=Atrial Fibrillation; CAD=Coronary Artery Disease; HF=Heart Failure; MDD=Major depressive disorder; PAD=Peripheral Artery Disease. Source data
Extended Data Fig. 2
Extended Data Fig. 2. Polygenicity and genetic correlation for MDD, CVD, and risk factors.
a, Heatmap of the genetic correlations between MDD, the CVDs, and the risk factors, with the color indicating the effect direction (negative: red, positive: blue) and the size and shade of the square illustrating the size of the correlation. Results are based on LD Score Regression analysis. b, Polygenicity estimates from SBayesS (y-axis) and MiXeR (x-axis) for MDD, the CVDs, and the risk factors. Note that for PAD polygenicity estimates did not converge for SBayeS, possibly because of the few number of cases. Points and error bars represent the mean number of estimated non-zero variants and 95% CIs. a, b Sample sizes for underlying GWAS summary statistics are reported in Supplementary Table 1. AF=Atrial Fibrillation; CAD=Coronary Artery Disease; Child. Mal.=Childhood Maltreatment; CRP=C-Reactive Protein; DBP=Diastolic Blood Pressure; Edu=Educational attainment; HDL=High-Density Lipoprotein; HF=Heart Failure; IL6=Interleukin-6; LDL=Low-Density Lipoprotein; MDD=Major Depressive Disorder; NonHDL=Non-High-Density Lipoprotein; PAD=Peripheral Artery Disease; Phys. Act.=Physical activity; PP=Pulse Pressure; Psychosocial=Psychosocial/lifestyle; SBP=Systolic Blood Pressure; T2D=Type II Diabetes; TC=Total Cholesterol; TG=Triglycerides. Source data
Extended Data Fig. 3
Extended Data Fig. 3. Genetic liability to ASCVD latent factor.
a, Latent atherosclerotic CVD (ASCVD) model, defined by stroke, peripheral artery disease (PAD), heart failure (HF), and coronary artery disease (CAD). All ‘observed’ traits are based on GWAS summary statistics. Results are from confirmatory factor analysis in Genomic SEM, and standardized factor loadings are given for each path. Circular dashed arrows give the trait variance. b, Manhattan plot of the GWAS on ASCVD, with each dot representing a SNP with its position on the x-axis and its P-value on the y-axis. Genome-wide significant SNPs with a significant heterogeneity Q (with a strong effect on one or some of the indicators that was not well explained through the common latent factor) are displayed in grey. The dashed line indicates the genome-wide significance threshold (P < 5e-8). P-values were computed using a two-sided Z-test. a-b Sample sizes for underlying GWAS summary statistics are reported in Supplementary Table 1. AF=Atrial Fibrillation; CAD=Coronary Artery Disease; HF=Heart Failure; MDD=Major depressive disorder; PAD=Peripheral Artery Disease. Source data
Extended Data Fig. 4
Extended Data Fig. 4. The genetic signature of MDD-ASCVD.
a, Enrichment for the MDD-ASCVD GWAS SNPs in genome-wide significant SNPs for traits in the GWAS catalog computed using FUMA. The traits are as reported in the original study. Note that sleep duration here is a dichotomization of self-reported sleep. The dashed grey line indicates the significance threshold after FDR-adjustment. Adjustment for multiple testing was conducted over all traits in the GWAS catalog using the Benjamini-Hochberg procedure. P-values were computed using a one-sided hypergeometric test. b, The five SNPs that were significantly associated with MDD-ASCVD, but not with any of the constituent traits, with their P-value in the GWAS of the constituent traits. The dashed line indicates the genome-wide significance threshold (P < 5e-8). P-values from constituent traits are taken from the original GWAS, see Supplementary Table 1. P-values for MDD-ASCVD were computed using a two-sided Z-test c, Genetic correlation of MDD symptoms with MDD, and MDD-ASCVD. d Genetic correlation of MDD, MDD-ASCVD, ASCVD, with five mental disorders. c-d Points and error bars represent mean genetic correlation and 95% CIs. Results are computed using LD Score Regression analysis. a-d Sample sizes for underlying GWAS summary statistics are reported in Supplementary Table 1. ADHD = Attention Deficit and Hyperactivity Disorder; PTSD = Posttraumatic Stress Disorder. Source data
Extended Data Fig. 5
Extended Data Fig. 5. Genetic correlation between CVDs and risk factors.
Results are based on LD Score Regression analysis. Points and error bars represent mean genetic correlation and 95% CIs. Sample sizes for underlying GWAS summary statistics are reported in Supplementary Table 1. Open dots indicate a non-significant genetic correlation. AF=Atrial Fibrillation; CAD=Coronary Artery Disease; Child. Mal.=Childhood Maltreatment; CRP = C-Reactive Protein; DBP=Diastolic Blood Pressure; Edu=Educational attainment; HDL=High-Density Lipoprotein; HF=Heart Failure; IL6=Interleukin-6; LDL=Low-Density Lipoprotein; MDD=Major Depressive Disorder; NonHDL=Non-High-Density Lipoprotein; PAD=Peripheral Artery Disease; Phys. Act.=Physical activity; PP=Pulse Pressure; Psychosocial=Psychosocial/lifestyle; SBP=Systolic Blood Pressure; T2D=Type II Diabetes; TC=Total Cholesterol; TG=Triglycerides. Source data
Extended Data Fig. 6
Extended Data Fig. 6. Genetic correlation between MDD traits and risk factors.
Results are based on LD Score Regression analysis. Points and error bars represent mean genetic correlation and 95% CIs. Sample sizes for underlying GWAS summary statistics are reported in Supplementary Table 1. Open dots indicate a non-significant genetic correlation. AF=Atrial Fibrillation; CAD=Coronary Artery Disease; Child. Mal.=Childhood Maltreatment; CRP = C-Reactive Protein; DBP=Diastolic Blood Pressure; Edu=Educational attainment; HDL=High-Density Lipoprotein; HF=Heart Failure; IL6=Interleukin-6; LDL=Low-Density Lipoprotein; MDD=Major Depressive Disorder; NonHDL=Non-High-Density Lipoprotein; PAD=Peripheral Artery Disease; Phys. Act.=Physical activity; PP=Pulse Pressure; Psychosocial=Psychosocial/lifestyle; SBP=Systolic Blood Pressure; T2D=Type II Diabetes; TC=Total Cholesterol; TG=Triglycerides. Source data
Extended Data Fig. 7
Extended Data Fig. 7. Local genetic correlations between MDD and risk factors.
Volcano plots based on LAVA results. Local genetic correlation between MDD and each of the risk factors (x-axis) and the corresponding -log10 transformed P-value (y-axis). Empirical P-values were obtained via a permutation procedure with partial integration, evaluating the two-sided hypothesis of no association using the estimated parameters as test statistics. Correlations were estimated in the loci that showed marginally significant local heritability in 2,495 considered genomic regions. Loci exceeding the horizontal line are significant at PFDR<.05. Multiple testing was adjusted individually for each trait over considered loci using the Benjamini-Hochberg procedure. Sample sizes for underlying GWAS summary statistics are reported in Supplementary Table 1. Child. Mal.=Childhood Maltreatment; CRP = C-Reactive Protein; DBP=Diastolic Blood Pressure; Edu=Educational attainment; HDL=High-Density Lipoprotein; IL6=Interleukin-6; LDL=Low-Density Lipoprotein; MDD=Major Depressive Disorder; NonHDL=Non-High-Density Lipoprotein; Phys. Act.=Physical activity; PP=Pulse Pressure; Psychosocial=Psychosocial/lifestyle; SBP=Systolic Blood Pressure; T2D=Type II Diabetes; TC=Total Cholesterol; TG=Triglycerides. Source data
Extended Data Fig. 8
Extended Data Fig. 8. Genetic correlation between MDD and CVD adjusting for individual risk factors.
Results from Genomic SEM. Points and error bars represent mean genetic correlation and 95% confidence intervals. Reference estimates of the association without any adjustment are printed in black. Sample sizes for underlying GWAS summary statistics are reported in Supplementary Table 1. AF=Atrial Fibrillation; CAD=Coronary Artery Disease; Child. Mal.=Childhood Maltreatment; CRP=C-Reactive Protein; DBP=Diastolic Blood Pressure; Edu=Educational attainment; HDL=High-Density Lipoprotein; HF=Heart Failure; IL6=Interleukin-6; LDL=Low-Density Lipoprotein; MDD=Major Depressive Disorder; NonHDL=Non-High-Density Lipoprotein; PAD=Peripheral Artery Disease; Phys. Act.=Physical activity; PP=Pulse Pressure; Psychosocial=Psychosocial/lifestyle; SBP=Systolic Blood Pressure; T2D=Type II Diabetes; TC=Total Cholesterol; TG=Triglycerides. Source data
Extended Data Fig. 9
Extended Data Fig. 9. Sensitivity analyses providing additional support for causal effects between MDD, CVD, and shared risk factors.
a, Effect of genetic instruments for MDD (exposure) on CVD and risk factors (outcomes) after excluding the UKB sample from the MDD GWAS (which was responsible for most of the sample overlap in the exposure and outcome GWAS summary statistics). b, Effect of genetic instruments for CVD and risk factors on MDD after excluding the UKB sample from MDD GWAS. c, Results from LHC MR, that corrects for heritable confounders and sample overlap, with the IVW MR estimate given as reference, for the effect of MDD on CVD and risk factors. d Effect of genetic instruments for MDD-ASCVD on outcomes and risk factors. a-d Significantly pleiotropic estimates are indicated with a red asterisk. IVW estimate shown. Results from sensitivity analyses are reported in Supplementary Table 20. Points and error bars represent mean effect size (regression coefficient) and 95% CIs. Sample sizes for GWAS summary statistics are reported in Supplementary Table 1. The term beta refers to the log odds ratio. AF=Atrial Fibrillation; CAD=Coronary Artery Disease; Child. Mal.=Childhood Maltreatment; CRP = C-Reactive Protein; DBP=Diastolic Blood Pressure; Edu=Educational attainment; HDL=High-Density Lipoprotein; HF=Heart Failure; IL6=Interleukin-6; LDL=Low-Density Lipoprotein; MDD=Major Depressive Disorder; NonHDL=Non-High-Density Lipoprotein; PAD=Peripheral Artery Disease; Phys. Act.=Physical activity; PP=Pulse Pressure; Psychosocial=Psychosocial/lifestyle; SBP=Systolic Blood Pressure; T2D=Type II Diabetes; TC=Total Cholesterol; TG=Triglycerides. Source data
Extended Data Fig. 10
Extended Data Fig. 10. Support for causal effect of MDD on CVDs when adjusting for individual risk factors.
Results from multivariable MR. Points and error bars represent mean effect size (regression coefficient) and 95% CIs. IVW estimate shown. Reference estimates of the association without any adjustment are printed in black. Sample sizes for GWAS summary statistics are reported in Supplementary Table 1. The term beta refers to the log odds ratio. AF=Atrial Fibrillation; CAD=Coronary Artery Disease; Child. Mal.=Childhood Maltreatment; CRP=C-Reactive Protein; DBP=Diastolic Blood Pressure; Edu=Educational attainment; HDL=High-Density Lipoprotein; HF=Heart Failure; IL6=Interleukin-6; LDL=Low-Density Lipoprotein; MDD=Major Depressive Disorder; NonHDL=Non-High-Density Lipoprotein; PAD=Peripheral Artery Disease; Phys. Act.=Physical activity; PP=Pulse Pressure; Psychosocial=Psychosocial/lifestyle; SBP=Systolic Blood Pressure; T2D=Type II Diabetes; TC=Total Cholesterol; TG=Triglycerides. Source data

Update of

References

    1. Han, X. et al. Disease trajectories and mortality among individuals diagnosed with depression: a community-based cohort study in UK Biobank. Mol. Psychiatry26, 6736–6746 (2021). 10.1038/s41380-021-01170-6 - DOI - PMC - PubMed
    1. Nemeroff, C. B. & Goldschmidt-Clermont, P. J. Heartache and heartbreak—the link between depression and cardiovascular disease. Nat. Rev. Cardiol.9, 526–539 (2012). 10.1038/nrcardio.2012.91 - DOI - PubMed
    1. Kendler, K. S., Gardner, C. O., Fiske, A. & Gatz, M. Major depression and coronary artery disease in the Swedish twin registry. Arch. Gen. Psychiatry66, 857–863 (2009). 10.1001/archgenpsychiatry.2009.94 - DOI - PMC - PubMed
    1. Xian, H. et al. Genetic vulnerability and phenotypic expression of depression and risk for ischemic heart disease in the Vietnam era twin study of aging. Psychosom. Med.72, 370–375 (2010). 10.1097/PSY.0b013e3181d28125 - DOI - PMC - PubMed
    1. Hindley, G. et al. Charting the landscape of genetic overlap between mental disorders and related traits beyond genetic correlation. Am. J. Psychiatry179, 833–843 (2022). 10.1176/appi.ajp.21101051 - DOI - PMC - PubMed

Publication types