. 2024 Nov;131(8):1340-1349.
doi: 10.1038/s41416-024-02837-x. Epub 2024 Aug 30.

Molecular classification of ovarian high-grade serous/endometrioid carcinomas through multi-omics analysis: JGOG3025-TR2 study

Affiliations

Molecular classification of ovarian high-grade serous/endometrioid carcinomas through multi-omics analysis: JGOG3025-TR2 study

Shiro Takamatsu et al. Br J Cancer. 2024 Nov.

Abstract

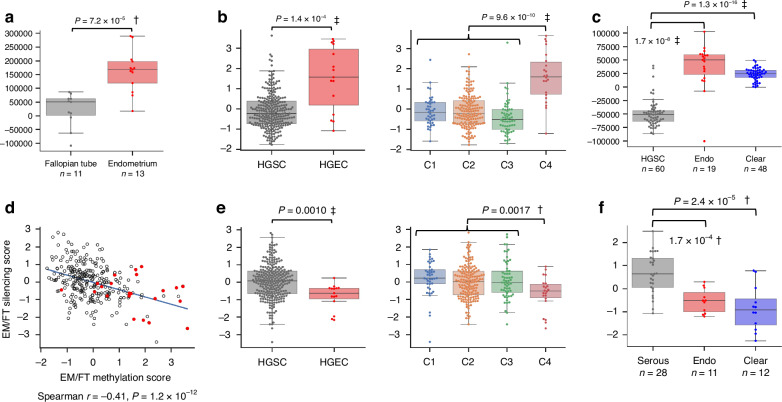
Background: Considerable interobserver variability exists in diagnosis of ovarian high-grade endometrioid carcinoma (HGEC) and high-grade serous carcinoma (HGSC) due to histopathological similarities. While homologous recombination deficiency (HRD) correlates with drug sensitivity in HGSC, the molecular features of HGEC are unclear.

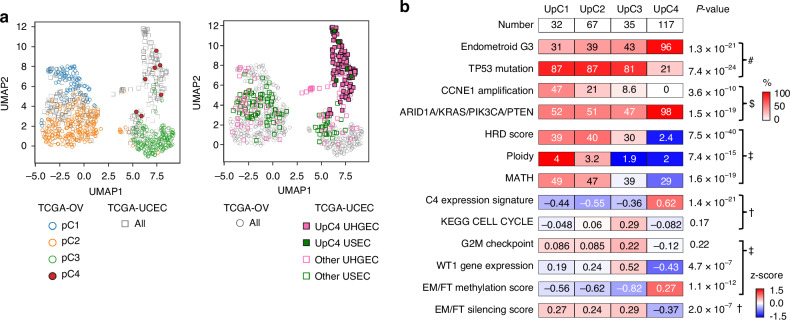
Methods: Fresh-frozen samples from 15 ovarian HGECs and 274 ovarian HGSCs in the JGOG-TR2 cohort were submitted to targeted DNA sequencing, RNA sequencing, DNA methylation array, and SNP array. We additionally analyzed 555 ovarian HGSCs from TCGA-OV and 287 endometrial high-grade carcinomas from TCGA-UCEC.

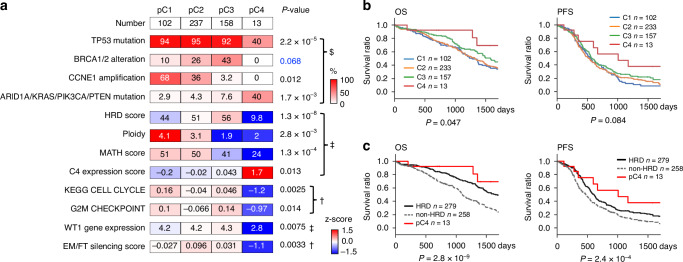
Results: Unsupervised clustering using copy number signatures identified four distinct tumor groups (C1, C2, C3 and C4). C1 (n = 41) showed CCNE1 amplification and poor survival. C2 (n = 160) and C3 (n = 59) showed high BRCA1/2 alteration frequency with low and moderate ploidy, respectively. C4 (n = 22) was characterized by favorable outcome, higher HGEC proportion, no BRCA1/2 alteration or CCNE1 amplification, and low levels of HRD score, ploidy, intra-tumoral heterogeneity, cell proliferation rate, and WT1 gene expression. Notably, C4 exhibited a normal endometrium-like DNA methylation profile, thus, defined as "HGEC-type" tumors, which were also identified in TCGA-OV and TCGA-UCEC.

Conclusions: Ovarian "HGEC-type" tumors present a non-HRD status, favorable prognosis, and endometrial differentiation, possibly constituting a subset of clinically diagnosed HGSCs.


Conflict of interest statement

NM received a research grant from AstraZeneca. NM received lecture fees from AstraZeneca, Takeda Pharmaceutical, Eisai, MSD and Chugai Pharmaceutical, and is an outside director of Takara Bio. TB received lecture fees from AstraZeneca. KY received lecture fees and a research grant from AstraZeneca. There are no other competing interests related to this paper.

Figures

Fig. 1
Fig. 1. Four tumor subtypes based on CNV signatures in the JGOG3025-TR2 cohort.
a Molecular profiles. Unsupervised clustering based on 48-channel CNV signatures revealed the four tumor subtypes (Supplementary Fig. 2). The C1 showed a high CCNE1 amplification rate, a low frequency of BRCA1/2 alterations, a complete absence of HGEC, moderate HRD score, and high ploidy. Both C2 and C3 showed high BRCA alteration rates and high HRD scores, while C3 exhibited very low ploidy. C4 showed a low TP53 mutation rate, a complete absence of BRCA alterations and CCNE1 amplifications, and an extremely low HRD score. b Comparison of overall survival (OS) (left) and progression-free survival (PFS) (right) among the four subtypes. c Comparison of OS (left) and PFS (right) between HRD, C4, and non-HRD without C4. While all the C4 cases were classified into non-HRD, they tended to have as favorable outcomes as HRD cases.
Fig. 2
Fig. 2. Genome-wide DNA methylation analysis associated with cell differentiation of endometrium and fallopian tubes.
a Comparison of EM/FT methylation score between fallopian tube samples and endometrium samples In GSE155760, EM/FT methylation score was significantly higher in endometrium samples than fallopian tube samples. b Comparison of EM/FT methylation score in the JGOG-TR2. EM/FT methylation score was significantly higher in tumors diagnosed as HGEC by CPR than those as HGSC (left) and in the C4 tumors than the other tumors (right). c Comparison of EM/FT methylation score between different histological types of ovarian cancer. In GSE226823, EM/FT methylation score was higher in endometrioid carcinoma (Endo) or in clear cell carcinoma (Clear) than HGSC. d Correlation of EM/FT methylation score and EM/FT silencing score in the JGOG-TR2 cohort. the EM/FT methylation score and the EM/FT silencing score were negatively correlated. e Comparison of EM/FT silencing score in the JGOG-TR2. EM/FT silencing score was significantly lower in tumors diagnosis as HGEC than those as HGSC (left) and in the C4 tumors than the other tumors (right). f Comparison of EM/FT silencing score between different histological types of ovarian cancer. In GSE44104, the EM/FT silencing score was significantly higher in Endo or Clear than in Serous. Statistical p-values were calculated using T-test (†) or Man–Whitney test (‡).
Fig. 3
Fig. 3. Analysis in TCGA-OV datasets.
a Differences in genomic profiles between the predicted tumor subtypes. Observed differences in molecular profiles between the assigned groups were similar to those in the JGOG-TR2 cohort (Fig. 1a, Supplementary Fig. 7a). Binary values were compared using Fisher-exact test ($) and continuous values using T-test (†) or Mann–Whitney test (‡) between pC4 and other subtypes. b Differences of OS (left) and PFS (right) outcomes between the predicted four subtypes. c Differences in OS (left) and PFS (right) outcomes between HRD, pC4, and non-HRD without pC4.
Fig. 4
Fig. 4. Analysis in TCGA-UCEC.
a Sample distribution from TCGA-OV and TCGA-UCEC cases using UMAP plots in relation to predicted subtype and histology. (left) pC1, pC2, pC3 and pC4 tumors in TCGA-OV were denoted by blue rings, orange rings, green rings, and red solid dots, respectively. TCGA-UCEC tumors were represented by gray square frames. (right) High-grade endometroid (UHGEC) and serous carcinoma (USEC) in TCGA-UCEC were colored in pink and green, and UpC4 and the other tumors were depicted as solid squares and square frames, respectively. TCGA-OV tumors were represented by gray rings. b Differences in genomic profiles between predicted tumor subtypes. Observed differences in molecular profiles between the assigned groups were similar to those in the JGOG-TR2 cohort (Fig. 1a, Supplementary Fig. 7a). Binary values were compared using Chi-square (#) or Fisher-exact test ($) and continuous values using T-test (†) or Mann–Whitney test (‡) between UpC4 and other subtypes.

References

    1. Zhang Y, Luo G, Li M, Guo P, Xiao Y, Ji H, et al. Global patterns and trends in ovarian cancer incidence: age, period and birth cohort analysis. BMC Cancer. 2019;19:984. - PMC - PubMed
    1. Nakai H, Higashi T, Kakuwa T, Matsumura N. Trends in gynecologic cancer in Japan: incidence from 1980 to 2019 and mortality from 1981 to 2021. Int J Clin Oncol. 2024;29:363–71. - PubMed
    1. Koshiyama M, Matsumura N, Konishi I. Recent concepts of ovarian carcinogenesis: type I and type II. Biomed Res Int. 2014;2014:934261. - PMC - PubMed
    1. Yamaguchi K, Mandai M, Oura T, Matsumura N, Hamanishi J, Baba T, et al. Identification of an ovarian clear cell carcinoma gene signature that reflects inherent disease biology and the carcinogenic processes. Oncogene. 2010;29:1741–52. - PubMed
    1. Yamaguchi K, Huang Z, Matsumura N, Mandai M, Okamoto T, Baba T, et al. Epigenetic determinants of ovarian clear cell carcinoma biology. Int J Cancer. 2014;135:585–97. - PMC - PubMed

MeSH terms