. 2024 Nov;131(8):1350-1362.
doi: 10.1038/s41416-024-02831-3. Epub 2024 Aug 30.

Circulating miRNA panels as a novel non-invasive diagnostic, prognostic, and potential predictive biomarkers in non-small cell lung cancer (NSCLC)

Affiliations

Circulating miRNA panels as a novel non-invasive diagnostic, prognostic, and potential predictive biomarkers in non-small cell lung cancer (NSCLC)

Maryam Abdipourbozorgbaghi et al. Br J Cancer. 2024 Nov.

Abstract

Background: Non-small cell lung cancer (NSCLC) is characterised by its aggressiveness and poor prognosis. Early detection and accurate prediction of therapeutic responses remain critical for improving patient outcomes. In the present study, we investigated the potential of circulating microRNA (miRNA) as non-invasive biomarkers in patients with NSCLC.

Methods: We quantified miRNA expression in plasma from 122 participants (78 NSCLC; 44 healthy controls). Bioinformatic tools were employed to identify miRNA panels for accurate NSCLC diagnosis. Validation was performed using an independent publicly available dataset of more than 4000 NSCLC patients. Next, we correlated miRNA expression with clinicopathological information to identify independent prognostic miRNAs and those predictive of anti-PD-1 treatment response.

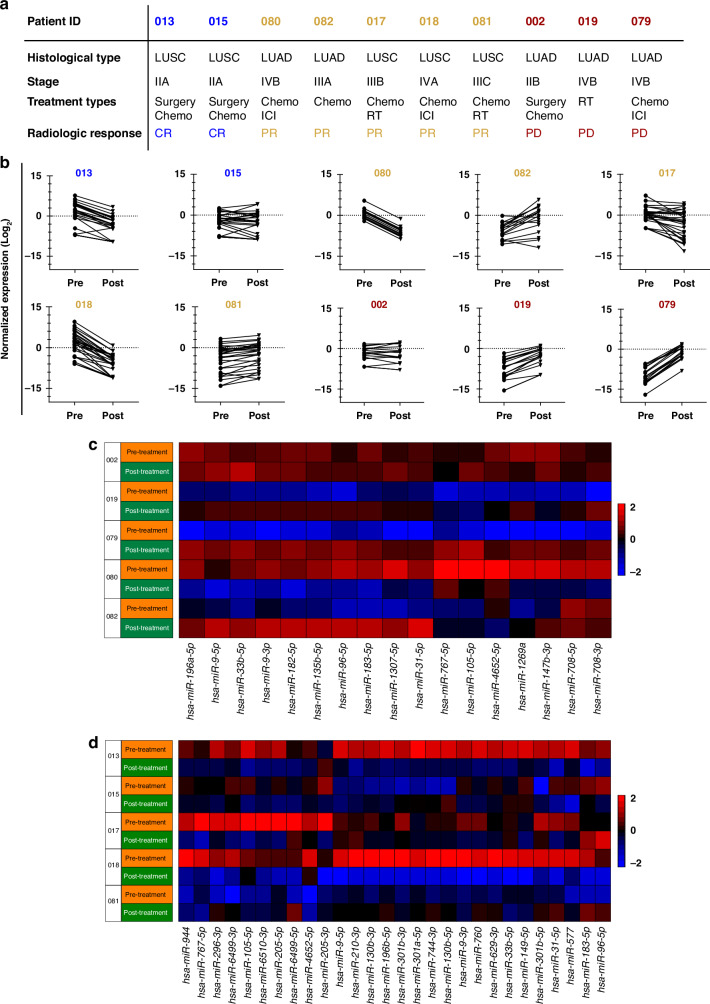
Results: We identified miRNA panels for lung adenocarcinoma (LUAD) and squamous cell carcinoma (LUSC) diagnosis. The LUAD panel consists of seven circulating miRNAs (miR-9-3p, miR-96-5p, miR-147b-3p, miR-196a-5p, miR-708-3p, miR-708-5p, miR-4652-5p), while the LUSC panel comprises nine miRNAs (miR-130b-3p, miR-269-3p, miR-301a-5p, miR-301b-5p, miR-744-3p, miR-760, miR-767-5p, miR-4652-5p, miR-6499-3p). Additionally, miR-135b-5p, miR-196a-5p, miR-31-5p (LUAD), and miR-205 (LUSC) serve as independent prognostic markers for survival. Furthermore, two miRNA clusters, namely miR-183/96/182 and miR-767/105, exhibit predictive potential in anti-PD-1-treated LUAD patients.

Conclusions: Circulating miRNA signatures demonstrate diagnostic and prognostic value for NSCLC and may guide treatment decisions in clinical practice.


Conflict of interest statement

The authors declare no competing interests.

Figures

Fig. 1
Fig. 1. Overview of study design and miRNA selection in LUAD and LUSC NSCLC subtypes from TCGA data.
a Flow chart for the NSCLC circulating miRNA study. b Heatmap and boxplot showing the differentially expressed (DE) miRNAs in malignant lung cancer and matched normal tissue. Rows represent miRNA IDs; columns represent TCGA sample IDs. A log2FC > 2 (4-fold induction or reduction) with a p-value of <0.05 was used as a threshold and considered significant. Data is presented as means ± SD. In LUAD, 42 miRNAs are differentially expressed (27 upregulated, 15 downregulated in cancer tissue). c In LUSC, 61 miRNAs are differentially expressed (40 upregulated, 21 downregulated in cancer tissue).
Fig. 2
Fig. 2. Comparative analysis of plasma-derived miRNAs in LUAD patients and healthy individuals.
a Heatmap and boxplot indicate DE miRNA expression (n = 17). b Correlation plot of DE miRNA expression levels. Similar variables are placed adjacently using correlation-based ordering. Darker colours and larger circles indicate stronger correlations. Blue indicates a positive correlation, while red represents a negative correlation. c Heatmap and boxplot of DE miRNA expression (n = 17) in the validation cohort. Data is displayed as means ± SD; statistical evaluation using Student’s t-test and significant are miRNAs with p < 0.05. d Heatmap of DE miRNA expression in early disease stage (n = 18). e Heatmap of DE miRNA expression in the late disease stage (n = 19). f Venn diagram depicting overlapped DE miRNA (n = 16) between early-stage vs. healthy (n = 18) and late-stage vs. healthy (n = 19), as well as stage-specific miRNAs in the early-stage (n = 2) and late-stage (n = 3). g Receiver operating characteristic (ROC) analysis reveals the best combination panel of DE miRNAs with the highest sensitivity (SE) and specificity (SP), as well as the best area under the curve (AUC) for the LUAD cohort. h Violin plot shows the probability density for the two compared sample groups (LUAD vs. healthy). i Pie chart shows the percentages of false predictions (false positives, FPs; false negatives, FNs) and true predictions (true positives, TPs; true negatives, TNs). j Table displays the best miRNA combination panel according to the highest AUC, SE%, SP%, and optimal cut-off in both LUAD and Validation validation cohorts, as determined by the CombiRoc analysis.
Fig. 3
Fig. 3. Comparative analysis of plasma-derived miRNAs in LUSC patients and healthy individuals.
a Heatmap and boxplot indicate DE miRNA expression (n = 28). b Correlation plot of DE miRNA expression levels. Similar variables are placed adjacently using correlation-based variable ordering. Darker colours and larger circles indicate stronger correlations. Blue indicates a positive correlation, while red represents a negative correlation. c Heatmap and boxplot show DE miRNA expression (n = 28) in the validation cohort. Data is displayed as means ± SD; statistical evaluation using Student’s t-test and significant are miRNAs with p < 0.05. d Heatmap of DE miRNA expression in early disease stage (n = 13). e Heatmap of DE miRNA expression in late disease stage (n = 19). f Venn diagram depicting overlapped DE miRNA (n = 6) between early-stage vs. healthy (n = 13) and late-stage vs. healthy (n = 19), as well as stage-specific miRNAs in the early-stage (n = 7) and late-stage (n = 13). g ROC analysis reveals the best combination panel of DE miRNAs with the highest sensitivity (SE) and specificity (SP), as well as the best area under the curve (AUC) for the LUSC cohort. h Violin plot shows the probability density of the two compared sample groups (LUSC vs. healthy). i Pie chart shows the percentages of false predictions (false positives, FPs; false negatives, FNs) and true predictions (true positives, TPs; true negatives, TNs). j Table displays the best miRNA combination panel according to the highest AUC, SE, SP, and optimal cut-off in both LUSC and validation cohorts as determined by the CombiRoc analysis.
Fig. 4
Fig. 4. A panel of differentially expressed miRNAs serves as Non-Invasive prognostic biomarkers in NSCLC.
a Kaplan–Meier plots of overall survival (OS) for the LUAD cohort showing significant prognostic miRNAs based on DE miRNA expression (n = 3, Log-rank test p < 0.05). The cut-off for high or low miRNA expression was assessed by the X-tile programme. b Multivariate Cox regressional hazard analysis for prognostic miRNAs (n = 3) in LUAD cohort with clinical variables such as stage, sex, and age (NS: non-significant, HRatio: hazard ratio). c Kaplan–Meier plots of OS for the LUSC cohort representing significant prognostic miRNAs according to DE miRNA expression (n = 7, Log-rank test p < 0.05). The cut-off for high or low miRNA expression was assessed by the X-tile programme. d Multivariate Cox regressional hazard analysis for prognostic miRNAs (n = 2) in the LUSC cohort with clinical variables such as stage, sex, and age (NS non-significant, HRatio hazard ratio).
Fig. 5
Fig. 5. Elucidating miRNA profiles as predictive biomarkers in NSCLC upon anti-PD-1 immunotherapy.
a PD-L1 tissue staining (positive >1%, negative <1%). b Tissue PD-L1 expression-based Kaplan–Meier-estimated progression-free survival (PFS) in NSCLC patients (n = 12). c Kaplan–Meier-estimated PFS in NSCLC patients treated with ICI mono (n = 5), and ICI + Chemotherapy (n = 7). d Kaplan–Meier-estimated PFS based on DE miRNAs (n = 10) in NSCLC patients treated with ICI. e The alluvial plot illustrates the patient cohorts undergoing ICI therapy. These groups are split into two categories: PD-L1 negative or positive. Within this framework, ‘H’ represents a high expression of miRNA, quantified as exceeding the median expression levels showed as a red colour, while ‘L’ represents a low expression of miRNA, situated below the median threshold, showed as a blue colour.
Fig. 6
Fig. 6. Assessing treatment response through comparative miRNA profiling before and after NSCLC therapy.
a Clinical profiles of patients treated with various therapies (n = 10) (CR: Complete Response, blue; PR partial response, yellow; and PD progressive disease, red) in the second blood withdrawal. b Changes in DE miRNA expression alteration between pre-treatment and post-treatment samples. c Heatmap of 17 differentially expressed miRNAs in five LUAD patients. d Heatmap of 28 differentially expressed miRNAs in five LUSC patients.

References

    1. Sung H, Ferlay J, Siegel RL, Laversanne M, Soerjomataram I, Jemal A, et al. Global Cancer Statistics 2020: GLOBOCAN estimates of incidence and mortality worldwide for 36 cancers in 185 countries. CA Cancer J Clin. 2021;71:209–49. - DOI - PubMed
    1. Molina JR, Yang P, Cassivi SD, Schild SE, Adjei AA. Non-small cell lung cancer: epidemiology, risk factors, treatment, and survivorship. Mayo Clin Proc. 2008;83:584–94. - DOI - PMC - PubMed
    1. Travis WD, Brambilla E, Nicholson AG, Yatabe Y, Austin JHM, Beasley MB, et al. The 2015 World Health Organization Classification of Lung Tumors: impact of genetic, clinical and radiologic advances since the 2004 classification. J Thorac Oncol. 2015;10:1243–60. - DOI - PubMed
    1. Malvezzi M, Santucci C, Boffetta P, Collatuzzo G, Levi F, La Vecchia C, et al. European cancer mortality predictions for the year 2023 with focus on lung cancer. Ann Oncol. 2023;34:410–9. - DOI - PubMed
    1. Ansari J, Shackelford RE, El-Osta H. Epigenetics in non-small cell lung cancer: from basics to therapeutics. Transl Lung Cancer Res. 2016;5:155–71. - DOI - PMC - PubMed

MeSH terms