. 2024 Aug 30;22(1):522.
doi: 10.1186/s12951-024-02762-4.

Titanium nanoparticles released from orthopedic implants induce muscle fibrosis via activation of SNAI2

Affiliations

Titanium nanoparticles released from orthopedic implants induce muscle fibrosis via activation of SNAI2

Gengming Zhang et al. J Nanobiotechnology. .

Abstract

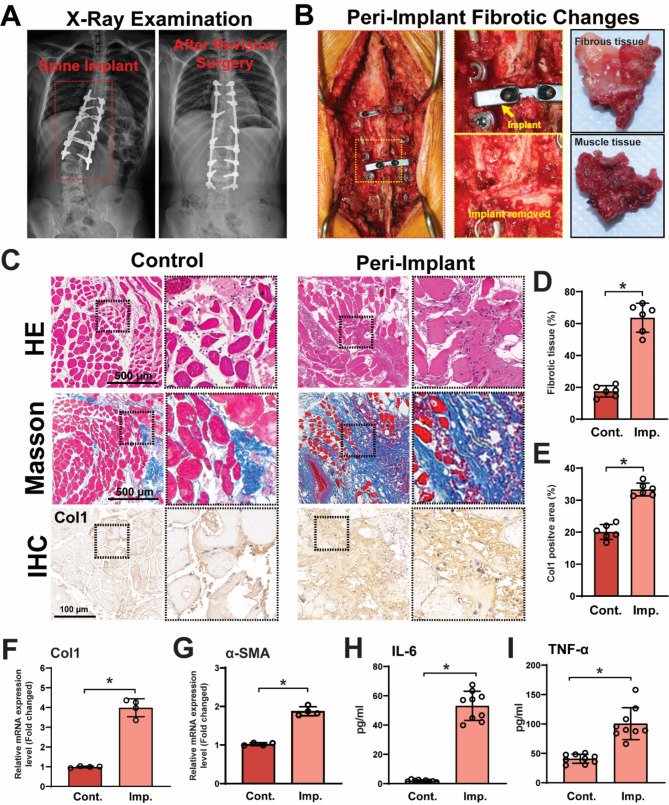
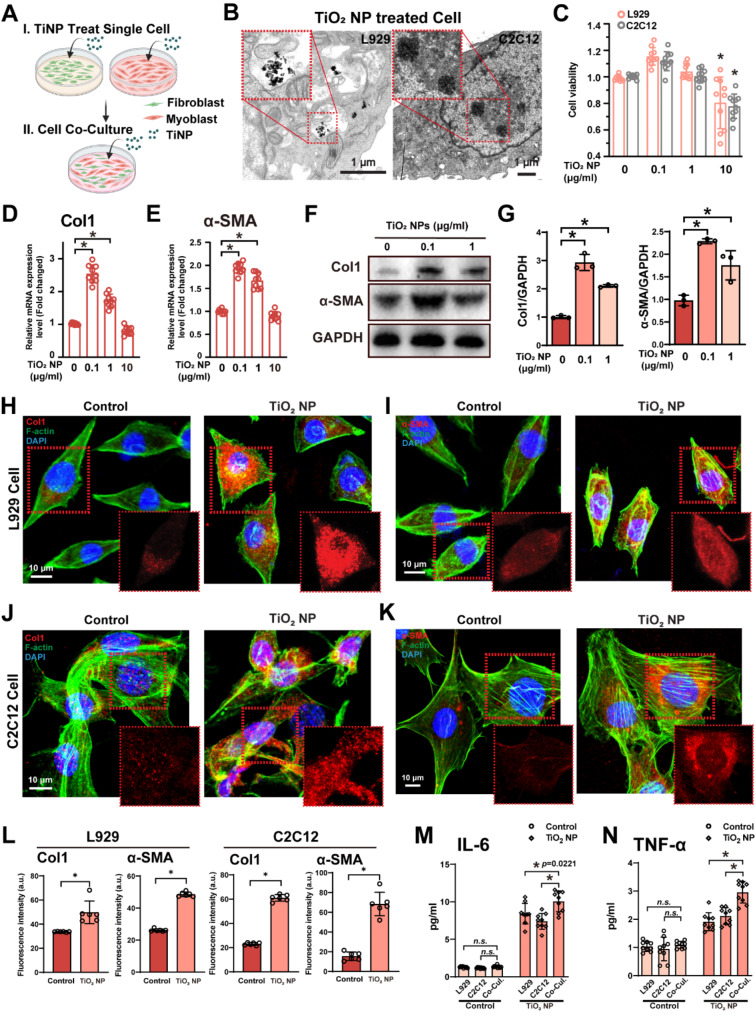
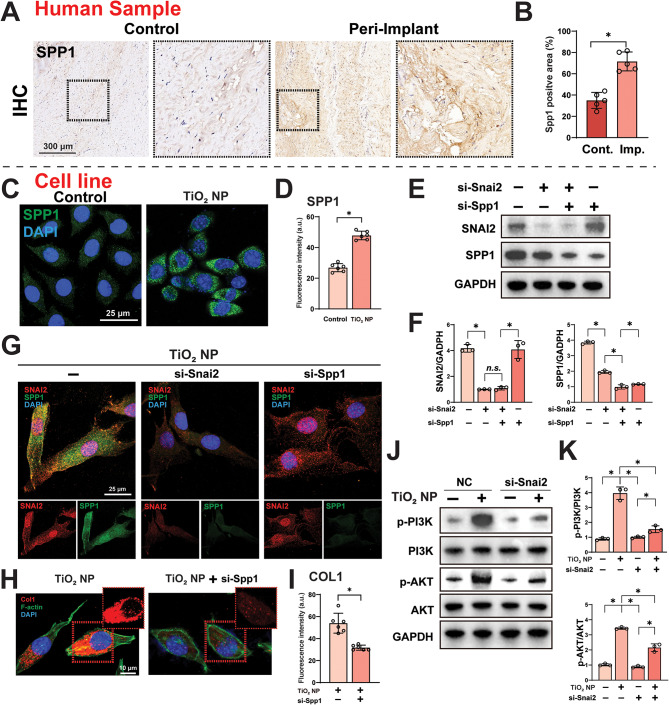
Titanium alloys represent the prevailing material employed in orthopedic implants, which are present in millions of patients worldwide. The prolonged presence of these implants in the human body has raised concerns about possible health effects. This study presents a comprehensive analysis of titanium implants and surrounding tissue samples obtained from patients who underwent revision surgery for therapeutic reasons. The surface of the implants exhibited nano-scale corrosion defects, and nanoparticles were deposited in adjacent samples. In addition, muscle in close proximity to the implant showed clear evidence of fibrotic proliferation, with titanium content in the muscle tissue increasing the closer it was to the implant. Transcriptomics analysis revealed SNAI2 upregulation and activation of PI3K/AKT signaling. In vivo rodent and zebrafish models validated that titanium implant or nanoparticles exposure provoked collagen deposition and disorganized muscle structure. Snai2 knockdown significantly reduced implant-associated fibrosis in both rodent and zebrafish models. Cellular experiments demonstrated that titanium dioxide nanoparticles (TiO2 NPs) induced fibrotic gene expression at sub-cytotoxic doses, whereas Snai2 knockdown significantly reduced TiO2 NPs-induced fibrotic gene expression. The in vivo and in vitro experiments collectively demonstrated that Snai2 plays a pivotal role in mediating titanium-induced fibrosis. Overall, these findings indicate a significant release of titanium nanoparticles from the implants into the surrounding tissues, resulting in muscular fibrosis, partially through Snai2-dependent signaling.

Keywords: Muscle fibrosis; Orthopedic implants; SNAI2; Titanium; Titanium dioxide nanoparticles.


Conflict of interest statement

The authors declare no competing interests.

Figures

Fig. 1
Fig. 1
Exposure of metal implant resulted in tissue fibrosis and muscle injury. (A) Titanium screws and Co-Cr-Mo rods were implanted in a patient for fixation during surgery for the correction of scoliosis. The patient underwent a second revision surgery 1 year after the first surgery. Preoperative and postoperative radiographs were obtained. (B) At the second surgery, scar tissue-like hyperplastic lesions were seen in the muscle surrounding the implant. (C) HE, Masson staining and IHC analysis of tissue around the implant and control. (D) Ratio of collagen-stained (blue) to total stained area in Masson staining (n = 6). (E) Semi-quantitative analysis of Col1 signal density in IHC analyses (n = 6). (F, G) The mRNA expression of Col1 and αSMA in tissue around implant and control were analyzed by qPCR. The control group was set to 1.0, * means P < 0.05 between two indicated groups (n = 4). (H, I) Blood levels of IL-6 and TNF-α in postoperative patients with low back pain and control were examined by ELISA assay (n = 9). * means P < 0.05 between two indicated groups. All data are displayed as mean ± SD
Fig. 2
Fig. 2
Sustained release of titanium nanoparticles from implants causing titanium exposure. (A) Visualization of implants removed from patients. (B) SEM-EDS analysis of Titanium alloy implant removed from patients. (C, D) SEM analysis of screw and rod removed from patients. (E-G) Ti 2p, O 1s and Survey XPS spectra of Titanium implant removed from patients. (H) Scanning electron micrographs of muscle tissue samples around metal implants. Yellow arrows indicate the black nanoscale metal particles, which vary in size from tens to hundreds of nanometers. (I, J) Ti content in the tissues at different distances from the implant (0, 15, 30 cm) and control (n = 4). (K) Ti content in the blood of patient at various times after surgery (1, 2 and 4 years) and control (n = 6). (L) Triple Factor Correlation Analysis of blood IL-6 Levels, blood Ti Levels, and Pain Scores in patients with postoperative pain (n = 12)
Fig. 3
Fig. 3
Titanium exposure results in muscle fibrosis in zebrafish and rats. (A) TiO2 NPs treated zebrafish were observed using TEM after 7 days treatment. The muscle tissue was extracted and analyzed. Yellow arrows indicated the TiO2 NPs entering muscle tissue. (B) Ti content in the water and zebrafish muscle treated with TiO2 NPs and control (n = 6). (C) Zebrafish embryos survival proportions treated with 1-100 mg/L TiO2 NPs for 24 h. (D, E) HE, Masson staining of zebrafish treated with TiO2 NPs for 7days. Scale bar = 1 mm. (F) Schematic illustrates the rat experimental design. (G) One-month post-implantation view of a titanium alloy implanted in the dorsal subcutaneous muscle of rat. Right side tissue was used as self-control. (H) IHC analysis of Col1 and αSMA for muscle tissue after titanium alloy implantation and control. (I, J) HE, Masson staining of rat dorsal subcutaneous muscle implanted with Ti alloy for 30 days. (K) Immunofluorescence staining of muscle tissues around Ti implant for collagen I (purple), α-SMA (yellow), SNAI2 (red) and SPP1 (green), counterstained with DAPI (blue) for cell nuclei. (L) Quantification for signal density in muscle tissue around implant and control for Col1 (H) (n = 5). (M) Ratio of collagen-stained (blue) to total stained area in Masson staining (J) (n = 6). (N) Quantification for signal density in muscle tissue around implant and control for Col1 and α-SMA (n = 5). * means P < 0.05 between two indicated groups. All data are displayed as mean ± SD
Fig. 4
Fig. 4
TiO2 NPs exposure activated the fibroblasts and myoblasts. (A) Schematic illustrates the cell experimental design. (B) TEM of cells treated with TiO2 NPs. Red boxes showed nanoparticle aggregates in cell plasma and nucleus. (C) Cell viability of L929 and C2C12 cells treated with 0.1–10 µg/ml TiO2 NPs for 24 h. *P < 0.05 versus 0 group. (D, E) The mRNA expression of Col1 and αSMA in L929 cells treated with 0.1–10 µg/ml TiO2 NPs and control were analyzed by qPCR. The control group was set to 1.0, * means P < 0.05 between two indicated groups (n = 9). (F) The expression of Col1 and αSMA in cells treated with 0.1–1 µg/ml TiO2 NPs and control were analyzed by Western blotting. GAPDH was used as internal reference. (G) Relative expression levels were compared between the TiO2 NPs-treated cells and the control cells. (H-K) Immunofluorescence staining of cells treated with 0.1 µg/ml TiO2 NPs and control for Col1 (red), α-SMA (red) and F-actin (green), counterstained with DAPI (blue) for cell nuclei. (L) Quantification for signal density in cells treated with 0.1 µg/ml TiO2 NPs and control for Col1 and α-SMA (n = 6). (M, N) IL-6 and TNF-α levels in culture medium of cells treated with 0.1 µg/ml TiO2 NPs and blank control were examined by ELISA assay (n = 9). * means P < 0.05 between two indicated groups. All data are displayed as mean ± SD
Fig. 5
Fig. 5
TiO2 NPs up-regulates SNAI2 to activate the expression of fibrosis-associated genes. (A) KEGG pathway enrichment analysis of differentially expressed genes between muscle tissue surrounding the implant and control. RNA-seq data was obtained from four muscle tissues around implant and four controls, the muscle tissues were harvested during surgery. (B) Heatmap of 12 fibrosis-related genes enriched from DEGs and KEGG pathway enrichment analysis. (C) IHC analysis of SNAI2 for muscle tissue around implant and control. (D) Semi-quantitative analysis of SNAI2 signal density in IHC analyses (C) (n = 5). (E) Heatmap of nine fibrosis-related genes identified in RNA-seq, mRNA expression data was obtained in muscle samples from rat implanted with Ti alloy and sham surgery control (n = 16). (F) Immunofluorescence staining of rat muscle tissues around Ti implant, for collagen I (purple), α-SMA (yellow), SNAI2 (red) and SPP1 (green), counterstained with DAPI (blue) for cell nuclei. (G) Immunofluorescence staining of cells treated with 0.1 µg/ml TiO2 NPs and control for SNAI2 (green), counterstained with DAPI (blue) for cell nuclei. (H) Quantification for signal density in immunofluorescence staining of cells (G) for SNAI2 (n = 6). (I) The L929 cells were treated with combination of 0.1 µg/ml TiO2 NPs treatment and Snai2 siRNA transfection, expression of COL1 and SNAI2 were analyzed by Western blotting. GAPDH was used as internal reference. (J) Relative expression levels, normalized to the internal reference protein, were compared between the different treated cells. (K) The L929 cells were transfected with Snai2 siRNA 6 h before 0.1 µg/ml TiO2 NPs treatment. Immunofluorescence staining for Col1 and α-SMA (green), counterstained with DAPI (blue) for cell nuclei was performed. (L) Quantification for signal density in immunofluorescence staining (K) for Col1 and α-SMA was calculated and compared. * means P < 0.05 between two indicated groups. All data are displayed as mean ± SD
Fig. 6
Fig. 6
The profibrogenic effect of SNAI2 was mediated by SPP1 and PI3K pathway. (A) IHC analysis of SPP1 for muscle tissue sample around implant and control sample from first surgery patient. (B) Semi-quantitative analysis of SPP1 signal density in IHC analyses (A) (n = 5). (C) Immunofluorescence staining of cells treated with 0.1 µg/ml TiO2 NPs and blank control for SPP1 (green), counterstained with DAPI (blue) for cell nuclei. (D) Quantification for signal density in immunofluorescence staining of cells (C) for SPP1 (n = 6). (E) The L929 cells were treated with combination of Spp1 and Snai2 siRNA transfection under 0.1 µg/ml TiO2 NPs treatment, expression of SNAI2 and SPP1 were analyzed by Western blotting. GAPDH was used as internal reference. (F) Relative expression levels, normalized to the internal reference protein, were compared between the different treated groups. (G) The L929 cells were treated with Spp1 or Snai2 siRNA transfection under 0.1 µg/ml TiO2 NPs treatment, intracellular expression of SNAI2 (red) and SPP1 (green) were detected by immunofluorescence staining, nuclei were stained with DAPI (blue). (H) Immunofluorescence staining of cells treated with Spp1 siRNA transfection under 0.1 µg/ml TiO2 NPs treatment for Col1 (red) and F-actin (green), counterstained with DAPI (blue) for cell nuclei. (I) Quantification for signal density of Col1 in staining (H) (n = 6). (J) The L929 cells were treated with combination of 0.1 µg/ml TiO2 NPs treatment and Snai2 siRNA transfection, expression of PI3K, p-PI3K, AKT and p-AKT were analyzed by Western blotting. GAPDH was used as internal reference. (K) Relative expression levels, normalized to the internal reference protein, were compared between the different treated cells (J) (n = 3). * means P < 0.05 between two indicated groups. All data are displayed as mean ± SD
Fig. 7
Fig. 7
Knockdown of Snai2 inhibits titanium implant-induced fibrosis in vivo. (A) Schematic illustrates the zebrafish experimental design. (B, C) The mRNA expression of spp1 and col1a1a in wildtype and snai2−/− zebrafish larvae treated with TiO2 NPs were determined by qPCR. Wildtype was set to 1.0 as control group (n = 6). (D, E) HE, Masson staining of snai2−/− zebrafish larvae treated with TiO2 NPs for 7days. Scale bar = 1 mm. (F) Schematic illustrates the rat experimental design. (G) Immunofluorescence detection of Snai2 (red) expression in rat dorsal subcutaneous muscle after siRNA gel treatment, nuclei were stained with DAPI (blue). (H, I) HE, Masson staining of rat dorsal subcutaneous muscle implanted with Ti alloy implant treated with siRNA gel for 30 days. (J) Immunofluorescence staining of rat muscle tissues around Ti implant for collagen I (purple), α-SMA (yellow), SNAI2 (red) and SPP1 (green), counterstained with DAPI (blue) for cell nuclei. (K) Quantification for signal density in immunofluorescence staining of rat muscle cross-section (G) for Snai2 (n = 6). (L) Ratio of collagen-stained (blue) to total stained area in Masson staining (I) (n = 6). (M) Quantification for signal density in muscle cross-section (J) for Col1 and α-SMA (n = 5). * means P < 0.05 between two indicated groups. All data are displayed as mean ± SD

References

    1. Sidambe AT. Biocompatibility of Advanced Manufactured Titanium Implants-A Review. Mater (Basel). 2014;7:8168–88. 10.3390/ma7128168 - DOI - PMC - PubMed
    1. Kaur M, Singh K. Review on titanium and titanium based alloys as biomaterials for orthopaedic applications. Mater Sci Eng C Mater Biol Appl. 2019;102:844–62. 10.1016/j.msec.2019.04.064 - DOI - PubMed
    1. Fan L, Chen S, Yang M, Liu Y, Liu J. Metallic materials for bone repair. Adv Healthc Mater. 2024;13:e2302132. 10.1002/adhm.202302132 - DOI - PubMed
    1. Gulati K, Chopra D, Kocak-Oztug NA, Verron E. Fit and forget: the future of dental implant therapy via nanotechnology. Adv Drug Deliv Rev. 2023;199:114900. 10.1016/j.addr.2023.114900 - DOI - PubMed
    1. Rullán PJ, Deren ME, Zhou G, Emara AK, Klika AK, Schiltz NK, Barsoum WK, Koroukian S, Piuzzi NS. The Arthroplasty Surgeon Growth Indicator: A Tool for Monitoring Supply and demand trends in the Orthopaedic Surgeon Workforce from 2020 to 2050. J Bone Joint Surg Am. 2023;105:1038–45. 10.2106/JBJS.22.00874 - DOI - PubMed

LinkOut - more resources