. 2024 Sep;30(9):e70012.
doi: 10.1111/cns.70012.

DNA damage induced PARP-1 overactivation confers paclitaxel-induced neuropathic pain by regulating mitochondrial oxidative metabolism

Affiliations

DNA damage induced PARP-1 overactivation confers paclitaxel-induced neuropathic pain by regulating mitochondrial oxidative metabolism

Meng-Meng Ge et al. CNS Neurosci Ther. 2024 Sep.

Abstract

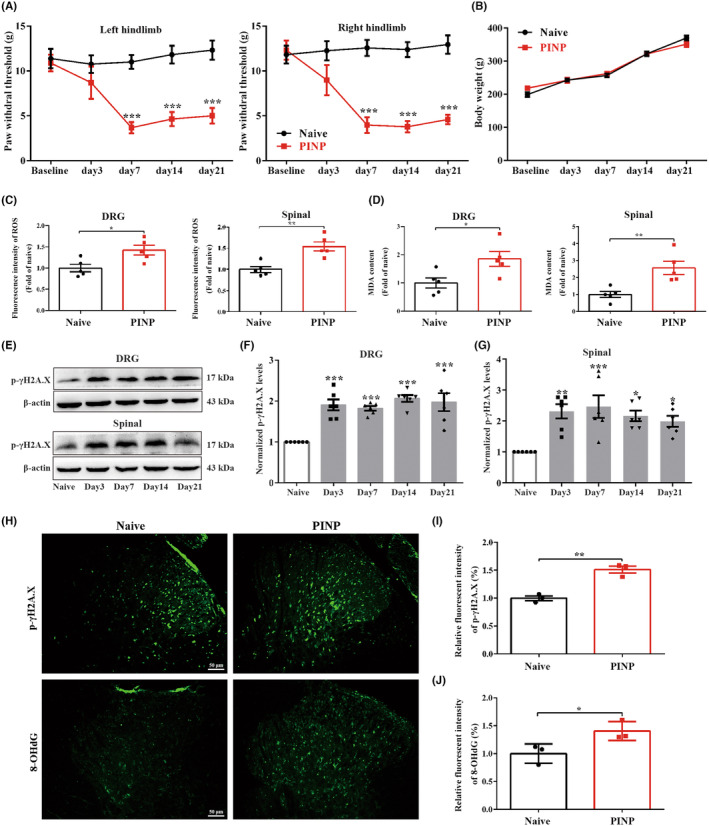
Aims: Poly (ADP-ribose) polymerase (PARP) has been extensively investigated in human cancers. Recent studies verified that current available PARP inhibitors (Olaparib or Veliparib) provided clinical palliation of clinical patients suffering from paclitaxel-induced neuropathic pain (PINP). However, the underlying mechanism of PARP overactivation in the development of PINP remains to be investigated.

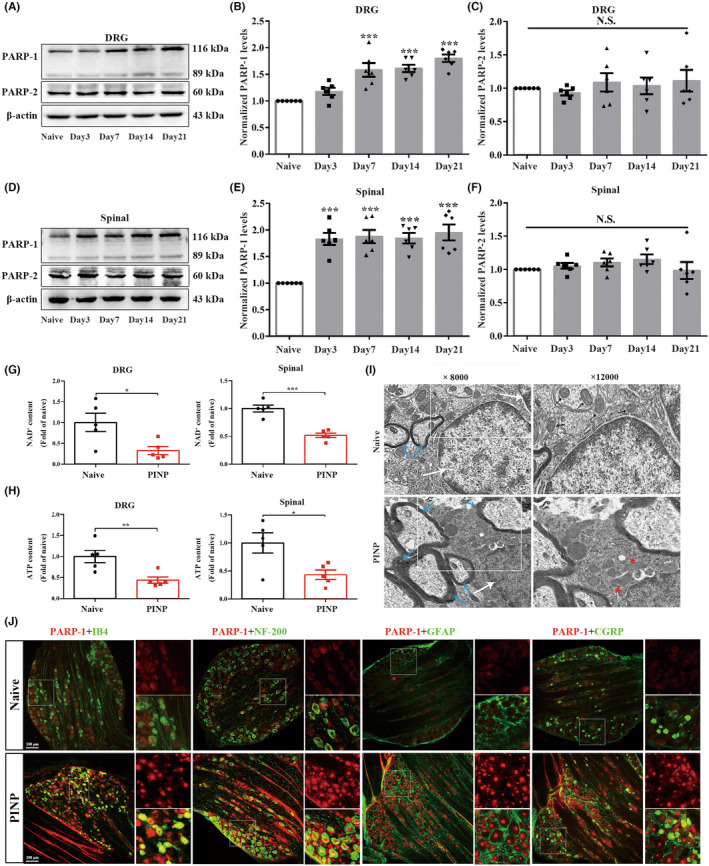
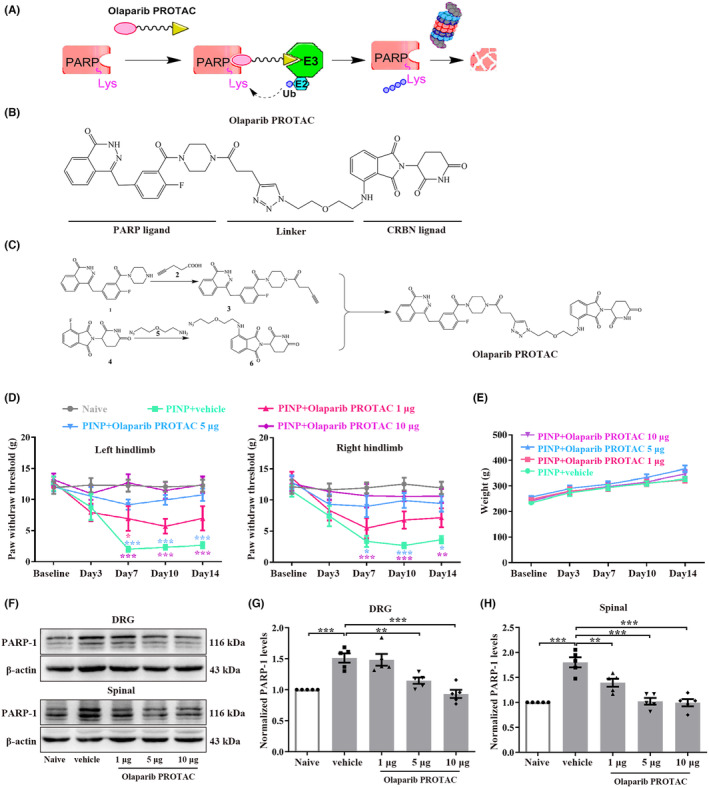
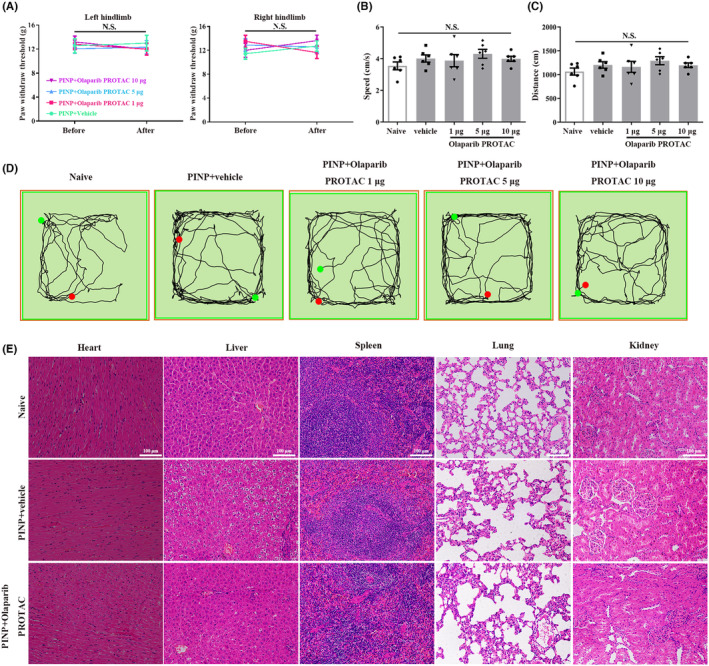
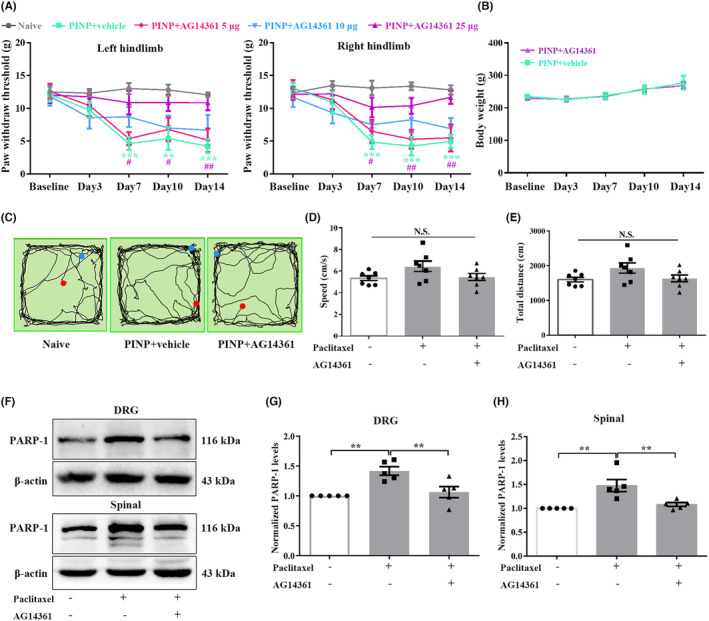
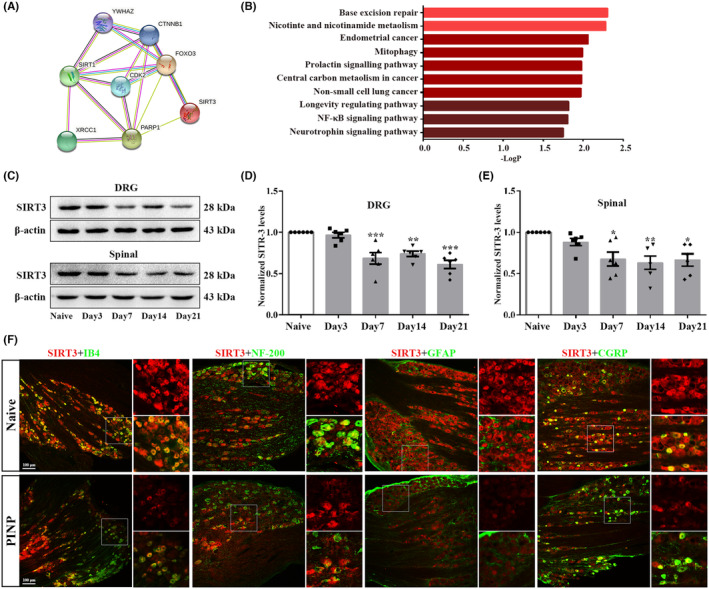
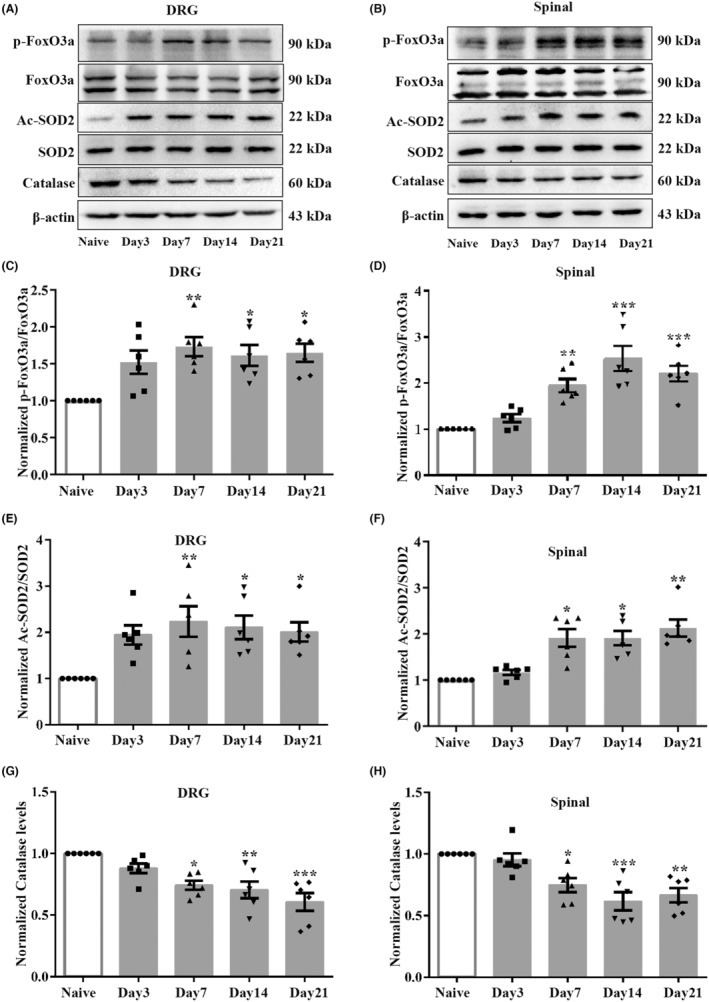
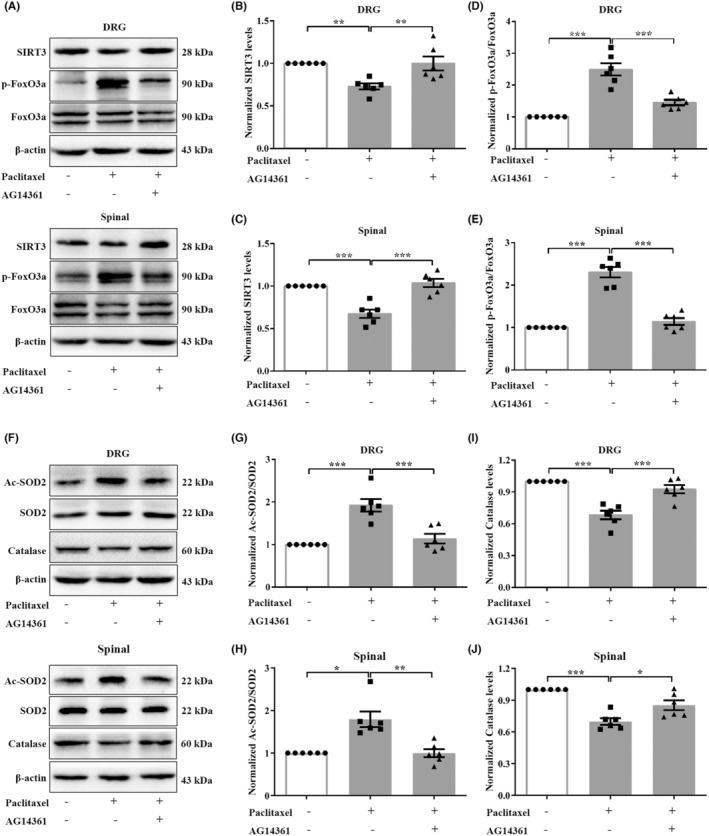
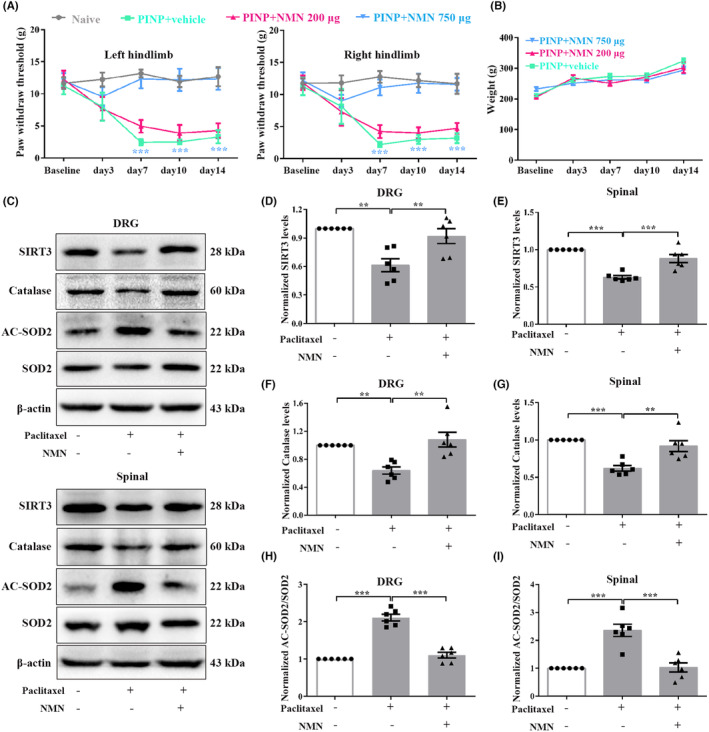
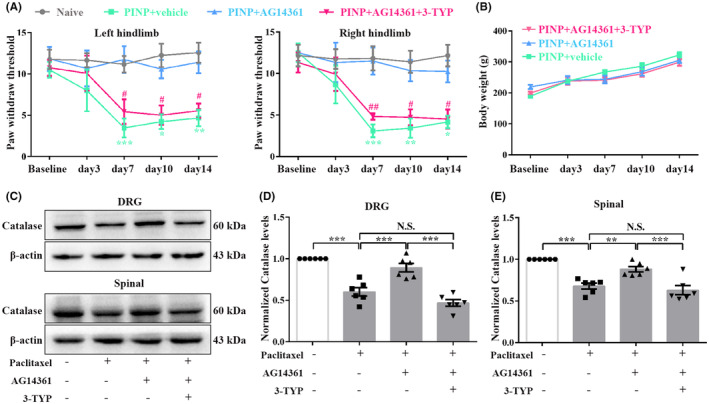
Methods and results: We reported induction of DNA oxidative damage, PARP-1 overactivation, and subsequent nicotinamide adenine dinucleotide (NAD+) depletion as crucial events in the pathogenesis of PINP. Therefore, we developed an Olaparib PROTAC to achieve the efficient degradation of PARP. Continuous intrathecal injection of Olaparib PROTAC protected against PINP by inhibiting the activity of PARP-1 in rats. PARP-1, but not PARP-2, was shown to be a crucial enzyme in the development of PINP. Specific inhibition of PARP-1 enhanced mitochondrial redox metabolism partly by upregulating the expression and deacetylase activity of sirtuin-3 (SIRT3) in the dorsal root ganglions and spinal cord in the PINP rats. Moreover, an increase in the NAD+ level was found to be a crucial mechanism by which PARP-1 inhibition enhanced SIRT3 activity.

Conclusion: The findings provide a novel insight into the mechanism of DNA oxidative damage in the development of PINP and implicate PARP-1 as a possible therapeutic target for clinical PINP treatment.

Keywords: Olaparib PROTAC; PARP‐1; Sirt‐3; oxidative metabolism; paclitaxel‐induced neuropathic pain.


Conflict of interest statement

The authors have declared that no conflict of interest exists.

Figures

FIGURE 1
FIGURE 1
Intraperitoneal administration of paclitaxel results in mechanical allodynia as well as DNA oxidative damage in rats. (A) Paclitaxel injection induced a remarkable reduction in PWTs on the bilateral hindlimbs. Two‐way ANOVA followed by Bonferroni post hoc test, ***p < 0.001 versus Naïve group, n = 8 per group. (B) The body weight showed no remarkable differences in the Naïve and PINP groups. Two‐way ANOVA followed by Bonferroni post hoc test, p > 0.05, n = 8 per group. (C, D) Paclitaxel injection resulted in the upregulation of ROS and MDA levels in the DRGs and spinal cord. Normalized to Naïve group. Unpaired Student's t‐test, *p < 0.05, **p < 0.01 versus Naïve group, n = 5 per group. (E–G) The levels of p‐γH2A.X (Ser 139) were increased in the DRGs and spinal cord in the PINP group. One‐way ANOVA followed by Bonferroni post hoc test, *p < 0.05, **p < 0.01, ***p < 0.001 versus Naïve group, n = 6 per group. (H–J) Relative immunofluorescence staining intensities of p‐γH2A.X (Ser 139) and 8‐OHdG in the spinal cord dorsal horn in each group. Normalized to Naïve group. Unpaired Student's t‐test, *p < 0.05, **p < 0.01 versus Naïve group, n = 3 per group. Scale bar: 50 μm.
FIGURE 2
FIGURE 2
Intraperitoneal administration of paclitaxel induced PARP‐1 upregulations in DRGs and spinal cord of rats. (A–F) Paclitaxel injection‐induced a remarkable increased levels of PARP‐1 in the DRGs and spinal cord. One‐way ANOVA followed by Bonferroni post hoc test, ***p < 0.001 versus Naïve group, n = 6 per group. While, we did not detect remarkable changes of protein levels of PARP‐2 in the DRGs and spinal cord in each group. One‐way ANOVA followed by Bonferroni post hoc test, p > 0.05, n = 6 per group. (G, H) NAD+ and ATP levels in the DRGs and spinal cord were decreased in the PINP rats. Normalized to Naïve group. Unpaired Student's t‐test, *p < 0.05, **p < 0.01, ***p < 0.001 versus Naïve group, n = 5 per group. (I) TEM images of mitochondrial ultrastructure (white arrow: Cell nucleus; blue arrow: Myelin sheath; black arrow: Normal mitochondria; red pentacle: Damaged mitochondria). The magnifications were 8000 or 12,000 times. (J) Representative double‐immunofluorescence staining of PARP‐1 and IB4, NF‐200, CGRP or GFAP in the DRGs in each group. Scale bar: 100 μm, n = 3 per group.
FIGURE 3
FIGURE 3
Continuous intrathecal injection of Olaparib PROTAC alleviated paclitaxel injection‐induced mechanical allodynia by inhibition of PARP‐1 in rats. (A) Working model of Olaparib PROTAC. (B) The designed Olaparib PROTAC composed of a PARP ligand, a linker and a CRBN ligand. (C) The details of Olaparib PROTAC synthesis. (D) Repeated intrathecal injection of Olaparib PROTAC (1, 5, or 10 μg/10 μL) reversed the decreased PWTs in a dose‐dependent manner. Two‐way ANOVA followed by Bonferroni post hoc test, *p < 0.05, **p < 0.01, ***p < 0.001 versus PINP+vehicle group, n = 7–8 per group. (E) No significant differences of the body weight were observed in PINP+Olaparib PROTAC groups compared to PINP+vehicle group. Two‐way ANOVA followed by Bonferroni post hoc test, p > 0.05, n = 7 per group. (F–H) Continuous intrathecal injection of Olaparib PROTAC inhibited the upregulations of PARP‐1 protein in the PINP rats in a dose‐dependent manner. One‐way ANOVA followed by Bonferroni post hoc test, **p < 0.01, ***p < 0.001 versus corresponding groups, n = 5 per group.
FIGURE 4
FIGURE 4
The effects of Olaparib PROTAC administration on motor function and organ structure for toxicity evaluation. (A) The PWTs before and after intrathecal catheter implantation revealed no remarkable differences on both hindlimbs in each group. Two‐way ANOVA followed by Bonferroni post hoc test, p > 0.05, n = 7–8 per group. (B–D) No remarkable differences in the total distance and average velocity were observed among all groups. One‐way ANOVA followed by Bonferroni post hoc test, p > 0.05, n = 6 per group. (E) Representative photomicrographs of H&E staining of heart, liver, spleen, lungs and kidneys. Scale bar: 100 μm, n = 3 per group.
FIGURE 5
FIGURE 5
Continuous intrathecal injection of a specific PARP‐1 inhibitor alleviated PINP in rats. (A) The decreased PWTs in the PINP group were partially reversed by injection of AG14361 (25 μg/10 μL). Two‐way ANOVA followed by Bonferroni post hoc test, **p < 0.01, ***p < 0.001 PINP+Vehicle group versus Naïve group, #p < 0.05, ##p < 0.01 PINP+AG14361 25 μg group versus PINP+vehicle group, n = 6–7 per group. (B) No significant differences of the body weight were observed in PINP+AG14361 groups compared to PINP+vehicle group. Two‐way ANOVA followed by Bonferroni post hoc test, p > 0.05, n = 7 per group. (C–E) There were no remarkable differences in the total distance and average velocity among three groups. One‐way ANOVA followed by Bonferroni post hoc test, p > 0.05, n = 7 per group. (F–H) Continuous intrathecal administration of AG14361 (25 μg/10 μL) inhibited the upregulations of PARP‐1 proteins in the DRGs and spinal cord in the PINP rats. one‐way ANOVA followed by Bonferroni post hoc test, **p < 0.01 versus corresponding groups, n = 5 per group.
FIGURE 6
FIGURE 6
Identification of SIRT3 as a target through which PARP‐1 overactivation regulated the imbalance in mitochondrial oxidative metabolism in the PINP rats. (A, B) PPI analysis and KEGG pathways demonstrated an interaction network between PARP‐1 and SIRT3 along with the related signaling pathways. Species origin: Homo sapiens. Yellow line: Textmining. Blue line: From curated databases. purple line: Experimentally determined. black line: Co‐expression. (C–E) The levels of SIRT3 in the DRGs and spinal cord were decreased from day 7 to day 21 following paclitaxel injection. One‐way ANOVA followed by Bonferroni post hoc test, *p < 0.05, **p < 0.01, ***p < 0.001 versus Naïve group, n = 6 per group. (F) Representative double‐immunofluorescence staining of SIRT3 and IB4, NF‐200, CGRP or GFAP in the DRGs in each group. Scale bar: 100 μm, n = 3 per group.
FIGURE 7
FIGURE 7
Effect of paclitaxel injection on deacetylase activity of SIRT3 in the DRGs and spinal cord in rats. (A–D) The ratios of p‐FoxO3a/FoxO3a were significantly upregulated in the DRGs and spinal cord after paclitaxel injection. One‐way ANOVA followed by Bonferroni post hoc test, *p < 0.05, **p < 0.01, ***p < 0.001 versus Naïve group, n = 6 per group. (E, F) The ratios of Ac‐SOD2/SOD2 were upregulated in the DRGs and spinal cord after paclitaxel injection. One‐way ANOVA followed by Bonferroni post hoc test was used for DRGs Ac‐SOD2/SOD2, Kruskal‐Wallis test followed by Dunn's multiple comparisons test was used for spinal Ac‐SOD2/SOD2, *p < 0.05, **p < 0.01 versus Naïve group, n = 6 per group. (G, H) The level of catalase in the DRGs and spinal cord was downregulated from day 7 to day 21 following paclitaxel injection. One‐way ANOVA followed by Bonferroni post hoc test, *p < 0.05, **p < 0.01, ***p < 0.001 versus Naïve group, n = 6 per group.
FIGURE 8
FIGURE 8
Specific PARP‐1 inhibition enhanced oxidative metabolism by upregulating the expression and deacetylase activity of SIRT3 in the PINP rats. (A–C) Specific PARP‐1 inhibitor AG14361 administration reversed the decreased expressions of SIRT3 in the DRGs and spinal cord in the PINP group. One‐way ANOVA followed by Bonferroni post hoc test, **p < 0.01, ***p < 0.001 versus corresponding groups, n = 6 per group. (D–H) Intrathecal administration of AG14361 significantly inhibited the increased ratios of p‐FoxO3a/FoxO3a and Ac‐SOD2/SOD2 in the DRGs and spinal cord in the PINP rats. One‐way ANOVA followed by Bonferroni post hoc test for p‐FoxO3a/FoxO3a and DRGs Ac‐SOD2/SOD2, Kruskal‐Wallis test followed by Dunn's multiple comparisons tests was used for spinal Ac‐SOD2/SOD2, *p < 0.05, **p < 0.01, ***p < 0.001 versus corresponding groups, n = 6 per group. (I–J) Upon AG14361 treatment, the decreased protein levels of catalase in the DRGs and spinal cord were significantly reversed in the PINP rats. One‐way ANOVA followed by Bonferroni post hoc test, *p < 0.05, ***p < 0.001 versus corresponding groups, n = 6 per group.
FIGURE 9
FIGURE 9
Replenishment of NAD+ precursor NMN reversed paclitaxel‐induced pain hypersensitivity. (A) Continuous intrathecal administration of NAD+ precursor NMN alleviated paclitaxel injection‐induced mechanical allodynia in a dose‐dependent manner. Two‐way ANOVA followed by Bonferroni post hoc test, ***p < 0.001 PINP+NMN 750 μg group versus PINP+vehicle group, n = 6 per group. (B) No significant differences of the body weight were observed in PINP+NMN groups compared to PINP+vehicle group. Two‐way ANOVA followed by Bonferroni post hoc test, p > 0.05, n = 6 per group. (C–I) PINP‐induced downregulations of SIRT3 and catalase protein levels and increased ratios of Ac‐SOD2/SOD2 in the DRGs and spinal cord of rats were significantly reversed by NMN (750 μg/15 μl) administration. One‐way ANOVA followed by Bonferroni post hoc test, **p < 0.01, ***p < 0.001 versus corresponding groups, n = 6 per group.
FIGURE 10
FIGURE 10
SIRT3 activity is critical for the analgesic effect of specific PARP‐1 inhibition in the PINP rats. (A, B) Continuous intrathecal injection of AG14361 significantly reversed the decreased PWTs in the PINP rats. However, pre‐injection of SIRT3 inhibitor 3‐TYP (150 μg/15 μL) 30 min before AG14361 (25 μg/10 μL) partly suppressed the analgesic effect of AG14361 in the PINP rats. Two‐way ANOVA followed by Bonferroni post hoc test, *p < 0.05, **p < 0.01, ***p < 0.001 PINP+AG14361 group versus PINP+vehicle group, #p < 0.05, ##p < 0.01 PINP+AG14361+3‐TYP group versus PINP+AG14361 group, n = 6 per group. (C) No significant differences of the body weight were observed in PINP+AG14361+3‐TYP group compared to PINP+vehicle group. Two‐way ANOVA followed by Bonferroni post hoc test, p > 0.05, n = 5–6 per group. (D–F) The increased levels of catalase in the DRGs and spinal cord caused by AG14361 (25 μg/10 μL) treatment were partly reversed by 3‐TYP (150 μg/15 μL) injection in the PINP rats. One‐way ANOVA followed by Bonferroni post hoc test, **p < 0.01, ***p < 0.001 versus corresponding groups, n = 6 per group.

References

    1. Zhou Y‐q, Liu D‐q, Chen S‐p, et al. Nrf2 activation ameliorates mechanical allodynia in paclitaxel‐induced neuropathic pain. Acta Pharmacol Sin. 2020;41(8):1041‐1048. - PMC - PubMed
    1. Galley HF, McCormick B, Wilson KL, Lowes DA, Colvin L, Torsney C. Melatonin limits paclitaxel‐induced mitochondrial dysfunction in vitro and protects against paclitaxel‐induced neuropathic pain in the rat. J Pineal Res. 2017;63(4):e12444. - PMC - PubMed
    1. Nie B, Liu C, Bai X, et al. AKAP150 involved in paclitaxelh‐induced neuropathic pain via inhibiting CN/NFAT2 pathway and downregulating IL‐4. Brain Behav Immun. 2018;68:158‐168. - PubMed
    1. Li L, Li J, Zuo Y, Dang D, Frost JA, Yang Q. Activation of KCNQ channels prevents paclitaxel‐induced peripheral neuropathy and associated neuropathic pain. J Pain. 2019;20(5):528‐539. - PMC - PubMed
    1. Guo TZ, Wei T, Huang TT, Kingery WS, Clark JD. Oxidative stress contributes to fracture/cast‐induced inflammation and pain in a rat model of complex regional pain syndrome. J Pain. 2018;19(10):1147‐1156. - PMC - PubMed

Publication types

MeSH terms

LinkOut - more resources