. 2025 Jan 12;27(1):106-122.
doi: 10.1093/neuonc/noae176.

Activation of Wnt/β-catenin signaling is critical for the tumorigenesis of choroid plexus

Affiliations

Activation of Wnt/β-catenin signaling is critical for the tumorigenesis of choroid plexus

Kim Hoa Ho et al. Neuro Oncol. .

Abstract

Background: The choroid plexus (ChP) is the secretory epithelial structure located in the brain ventricles. Choroid plexus tumors (CPTs) are rare neoplasms predominantly occurring in young patients with intensified malignancy in children. CPT treatment is hindered by insufficient knowledge of tumor pathology and the limited availability of valid models.

Methods: Genomic and transcriptomic data from CPT patients were analyzed to identify the putative pathological pathway. Cellular and molecular techniques were employed to validate bioinformatic results in CPT patient samples. Pharmacologic inhibition of Wnt/β-catenin signaling was assessed in CPT cells. Cell-based assays of ChP cell lines were performed following CRISPR-Cas9-derived knockout and overexpression of Wnt/β-catenin pathway genes. A 3D CPT model was generated through CRISPR-Cas9-derived knockout of APC.

Results: We discovered that Wnt/β-catenin signaling is activated in human CPTs, likely as a consequence of large-scale chromosomal instability events of the CPT genomes. We demonstrated that CPT-derived cells depend on autocrine Wnt/β-catenin signaling for survival. Constitutive Wnt/β-catenin pathway activation, either through knockout of the negative regulator APC or overexpression of the ligand WNT3A, induced tumorigenic properties in ChP 2D in vitro models. Increased activation of the Wnt/β-catenin pathway in ChP organoids, through treatment with a potent GSK3β inhibitor, reduced the differentiation of mature ChP epithelial cells. Remarkably, the depletion of APC was sufficient to induce the oncogenic transformation of ChP organoids.

Conclusions: Our research identifies Wnt/β-catenin signaling as a critical driver of CPT tumorigenesis and provides the first 3D in vitro model for future pathological and therapeutic studies of CPT.

Keywords: APC; Wnt signaling; brain tumor; choroid plexus organoid; rare childhood cancer.


Figures

Figure 1.
Figure 1.
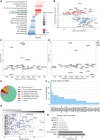
Transcriptomic and genomic changes related to Wnt/β-catenin signaling in human choroid plexus tumors (CPTs). (A) Top IPA (ingenuity pathway analysis) pathways of gene expression microarray data enriched in choroid plexus papilloma (CPP, n = 7) versus healthy choroid plexus (ChP, n = 8). The P-value of the enriched term is reflected by the color shade of the bar. (B) MA plot of Wnt2GOs list genes filtered from the microarray data. Genes upregulated in CPP (P < .05 and log2[fold change] ≥ 1, n = 90 genes) are highlighted in red; genes downregulated in CPP (P < .05 and log2[fold change] ≤ −1; n = 131 genes) are highlighted in blue. Selected genes are labeled. (C) Somatic SVs with their sizes and distances from SV to Wnt/β-catenin genes upstream of breakpoints. (D) Somatic SVs with their sizes and distances from SV to Wnt/β-catenin genes downstream of breakpoints. DEL, deletion, DUP, duplication, INV, inversion, TRA, translocation. (E) Composition of somatic SNV and Indel variants of CPTs. (F) Frequencies of Wnt/β-catenin signaling genes with somatic SNV and Indel variants in CPT samples. (G) CADD-Phred score indicating deleteriousness of somatic SNV/Indel variants on Wnt/β-catenin signaling genes. (H) Proportions of genes that carry somatic SNVs/Indels in at least 50% of samples in common oncogenic pathways.
Figure 2.
Figure 2.
Human choroid plexus tumors show the activation of the Wnt/β-catenin signaling pathway. (A) Representative photomicrographs illustrating β-catenin (CTNNB1) positive cells in post-operative choroid plexus papilloma (CPP), choroid plexus carcinoma (CPC) and healthy choroid plexus (ChP). (B) Quantification of β-catenin positive cells in 3 different cellular compartments. n = 3 biological replicates (5–8 random fields for each sample). (C) Pseudo-quantification of β-catenin intensity in 3 different cellular compartments. n = 3 biological replicates (5–8 random fields for each sample). Intensity scores are averaged scores given by 2 independent evaluators compared to the β-catenin level of a chosen image of ChP (Score; −2: much weaker, -1: weaker, 0: similar, 1: stronger, 2: much stronger). (D) Representative immunofluorescence images of ChP, CPP, and CPC stained against β-catenin (CTNNB1), TTR, and Hoechst. (E) Relative mRNA expression levels of several Wnt/β-catenin signaling genes in CPP, CPC, and ChP. n = 3 biological samples. F-G, Representative Western blot image (F) and quantification (G) of AXIN2 and CTNNB1 in ChP, CPP, and CPC human samples, n = 3 biological replicates. H, Representative Western blot images of DVL2, active CTNNB1 (non-phosphorylated at Ser37/Thr41), and total CTNNB1 in human samples. (I) Quantification of the ratio of active CTNNB1 over total CTNNB1. J-K, Quantification of the relative expression level of DVL2 (J) and the ratio of phosphorylated DVL2 over total DVL2 (K) in ChP, CPP, and CPC human samples. n = 3 for ChP and CPP and n = 1 for CPC (I-K). Scale bar: main: 50 μm, inset; 10 μm (A), 5 μm (D). One-way ANOVA test, Tukey multiple comparisons (B, E, G). Unpaired t-test (I-K, only ChP and CPP were analyzed). Bars represent Mean ± SEM; *P ≤ .05, **P ≤ .001, ****P ≤ .0001.
Figure 3.
Figure 3.
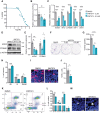
Human choroid plexus tumor cells are dependent on Wnt/β-catenin signaling. (A) Cell survival curve of HIBCPP cells after treatment with WNT974; n = 3. (B) Luciferase assay quantification of Wnt/β-catenin signaling activation in WNT974-treated HIBCPP cells. n = 7. (C) Relative mRNA expression levels of several Wnt/β-catenin signaling genes in Ctrl and WNT974-treated HIBCPP cells. n = 3. D-E, Western blot analysis of AXIN2 and CTNNB1 in WNT974-treated HIBCPP cells, n = 3. F-G, Clonogenic assay of HIBCPP cells treated with WNT974 at 3 μM and 6.5 μM. n = 3. (H) Cell cycle progression of WNT974-treated HIBCPP cells quantified by flow cytometry. n = 5–6. I-J, Representative confocal images (I) and quantification (J) showing EdU-positive cells in WNT974- and DMSO-treated HIBCPP cells. n = 5. Scale bar: 20 μm. K-L, Representative flow cytometry plots of Annexin V (AV)-Propidium Iodide (PI) staining in WNT974- and DMSO-treated HIBCPP cells. n = 3. (M) Representative confocal images showing cleaved-Caspase 3 (CASP3) positive cells in WNT974- and DMSO-treated HIBCPP cells. Scale bar: 20 μm (I, M). One-Way ANOVA test, Tukey multiple comparisons (B, C, E, G); Unpaired t-test (H, J, L). Bars represent Mean ± SEM; *P ≤ .05, **P ≤ .01, ***P ≤ .001, ****P ≤ .0001.
Figure 4.
Figure 4.
Wnt/β-catenin signaling activation induces transformation in 2D in vitro models. (A) Luciferase assay quantification of Wnt/β-catenin signaling in Apc knockout (Apc_KO) and control (Ctrl) cell lines. n = 5. B, C, Representative Western blot image (C) and quantification (D) of APC, AXIN2, and CTNNB1 proteins in Apc_KO cells. n = 4. D, Representative confocal images of Apc_KO and Ctrl cells stained against β-catenin. Asterisks indicate nuclear β-catenin. E-F, Representative images (E) and quantification (F) of colony formation in soft-agar assay of Apc_KO and Ctrl cells. n = 5. G-H, Representative image (G) and quantification (H) of the invasion of Apc_KO and Ctrl spheroids when implanted on mouse organotypic brain slices. n = 15–21 spheroids per clone. I, Luciferase assay quantification of Wnt/β-catenin pathway activation in WNT3A overexpressing (WNT3A_OE) and control (Ctrl) cell lines. n = 5. J, K, Representative Western blot image (J) and quantification (K) of Wnt/β-catenin pathway genes in WNT3A_OE and Ctrl cells. n = 5. L, Representative confocal images of WNT3A_OE and Ctrl cells stained against β-catenin. Asterisks indicate nuclear β-catenin. M-N, Representative images (M) and quantification (N) of colony formation in soft-agar assay of WNT3A_OE and Ctrl cells. n = 6–7. O-P, Representative image (O), and quantification (P) of the invasion of WNT3A_OE and Ctrl spheroids when implanted on mouse organotypic brain slices. n = 12–21 spheroids per clone. Scale bar: 10 μm (D, L), 100 μm (G, O). One-Way ANOVA test, Tukey multiple comparisons. Bars represent Mean ± SEM; *P ≤ .05, **P ≤ .01, ***P ≤ .001, ****P ≤ .0001.
Figure 5.
Figure 5.
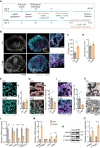
Systemic activation of Wnt/β-catenin pathway in hiPSC-derived choroid plexus organoids. (A) Schematic illustration of ChP organoid generation procedure and CHIR99021 (CHIR) treatment. (B) Immunofluorescence images of Ctrl and CHIR-treated ChP organoids stained against OTX2. C, Quantification of OTX2 + areas in Ctrl and CHIR-treated ChP organoids. n = 5. D, Quantification of cell density in OTX2 + areas of Ctrl and CHIR-treated ChP organoids. n = 5. E-F, Representative immunofluorescence images (E) and percentage (F) of KI67 + cells in OTX2 + areas of Ctrl and CHIR-treated ChP organoids; n = 5. G-H, Representative immunofluorescence images (G) and quantification of the signal intensity (H) of TTR in OTX2 + areas of Ctrl and CHIR-treated ChP organoids. n = 5. I-J, Representative immunofluorescence images (I) and quantification of the signal intensity (J) of AQP1 in OTX2 + areas of Ctrl and CHIR-treated ChP organoids. n = 5. (K) Representative images of Ctrl and CHIR-treated ChP organoids stained against KIR7.1. (L) Relative mRNA expression levels of several ChP marker genes in dissociated Ctrl and CHIR-treated ChP organoids. n = 3. (M) Relative mRNA expression levels of genes of Wnt/β-catenin pathway in dissociated Ctrl and CHIR-treated ChP organoids. n = 3. N-O, Representative Western blot image (N) and quantification (O) of relative protein expression levels of AXIN2 and CTNNB1 in Ctrl and CHIR-treated ChP organoids. n = 3. Scale bar: 200 μm (B-main), 25 μm (B-inset, E, G, I, K). Bars represent Mean ± SEM. Unpaired t-test (C, D, F, H, J); Two-Way ANOVA test, Tukey multiple comparisons (L, M, O); *P ≤ .05, **P ≤ .01, ***P ≤ .001, ****P ≤ .0001.
Figure 6.
Figure 6.
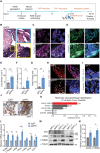
Loss of APC induces neoplasm in hiPSC-derived choroid plexus organoids. (A) Experimental procedure of the in vitro culture system to differentiate hiPSC into choroid plexus organoids and tumors. ECM, extracellular matrix (Geltrex). (B) Hematoxylin and eosin stained sections of choroid plexus (ChP) organoid with chimeric APC_KO. Top square indicates healthy ChP epithelium. Bottom square shows a neoplastic region adjacent to healthy ChP. (C) Representative confocal images of control and APC_KO organoids transduced with sgEV (Empy Vector Crispr-Cas9-mCherry) or sgAPC (Crispr-Cas9-sgAPC-mCherry) and stained against KI67. (D) Representative confocal images of organoids stained against OTX2 and KI67. (E) Quantification of cell density in OTX2 + areas of sgEV and sgAPC ChP organoids. n = 9. (F) Quantification of KI67 + cell density in OTX2 + areas of sgEV and sgAPC organoids. n = 9. (G) Quantification of percentage of KI67 + cells in OTX2 + areas of sgEV and APC_KO organoids. n = 9. (H) Representative confocal images of sgEV and sgAPC organoids stained against TTR and KI67. (I) Representative confocal images of sgEV and sgAPC organoids stained against cilia (PCNT: basal bodies, GluTub: glutamylated tubulin—axonemes). J, Representative images of sgEV and sgAPC organoids stained against KIR7.1. (K) Methylation profiling analysis classification of APC_KO organoids. MNP: Molecular neuropathology; PLEX, PED B: plexus tumor, subclass pediatric B; PTPR, A: papillary tumor of the pineal region group A; PLEX, PED A: plexus tumor, subclass pediatric A; PTPR, B: papillary tumor of the pineal region group B; CONTR, CEBM: control tissue, cerebellar hemisphere. (L) Relative mRNA expression levels of several genes in the Wnt/β-catenin pathway in sorted Ctrl and APC_KO cells. n = 3. M-N, Representative Western blot image (M) and relative quantification (N) of protein expressions of APC, AXIN2, and CTNNB1 in sorted sgEV and sgAPC cells. n = 3. Scale bar: 200 μm (B-main), 50 μm (B-inset, C, D, H), 10 μm (I), 20 μm (J). Bars represent Mean ± SEM. Unpaired t-test (E, F, G, L, N); *P ≤ .05, **P ≤ .01, ***P ≤ .001, ****P ≤ .0001.

References

    1. Lafay-Cousin L, Keene D, Carret AS, et al. Choroid plexus tumors in children less than 36 months: The Canadian Pediatric Brain Tumor Consortium (CPBTC) experience. Childs Nerv Syst. 2011;27(2):259–264. - PubMed
    1. Louis DN, Ohgaki H, Wiestler OD, et al. The 2007 WHO classification of tumours of the central nervous system. Acta Neuropathol. 2007;114(2):97–109. - PMC - PubMed
    1. McCall T, Binning M, Blumenthal DT, Jensen RL.. Variations of disseminated choroid plexus papilloma: 2 case reports and a review of the literature. Surg Neurol. 2006;66(1):62–7; discussion 67. - PubMed
    1. Cannon DM, Mohindra P, Gondi V, Kruser TJ, Kozak KR.. Choroid plexus tumor epidemiology and outcomes: Implications for surgical and radiotherapeutic management. J Neurooncol. 2015;121(1):151–157. - PubMed
    1. Hosmann A, Hinker F, Dorfer C, et al. Management of choroid plexus tumors-an institutional experience. Acta Neurochir (Wien). 2019;161(4):745–754. - PMC - PubMed

MeSH terms