. 2024 Sep:107:105315.
doi: 10.1016/j.ebiom.2024.105315. Epub 2024 Aug 30.

Collagen IV deficiency causes hypertrophic remodeling and endothelium-dependent hyperpolarization in small vessel disease with intracerebral hemorrhage

Affiliations

Collagen IV deficiency causes hypertrophic remodeling and endothelium-dependent hyperpolarization in small vessel disease with intracerebral hemorrhage

Sarah McNeilly et al. EBioMedicine. 2024 Sep.

Abstract

Background: Genetic variants in COL4A1 and COL4A2 (encoding collagen IV alpha chain 1/2) occur in genetic and sporadic forms of cerebral small vessel disease (CSVD), a leading cause of stroke, dementia and intracerebral haemorrhage (ICH). However, the molecular mechanisms of CSVD with ICH and COL4A1/COL4A2 variants remain obscure.

Methods: Vascular function and molecular investigations in mice with a Col4a1 missense mutation and heterozygous Col4a2 knock-out mice were combined with analysis of human brain endothelial cells harboring COL4A1/COL4A2 mutations, and brain tissue of patients with sporadic CSVD with ICH.

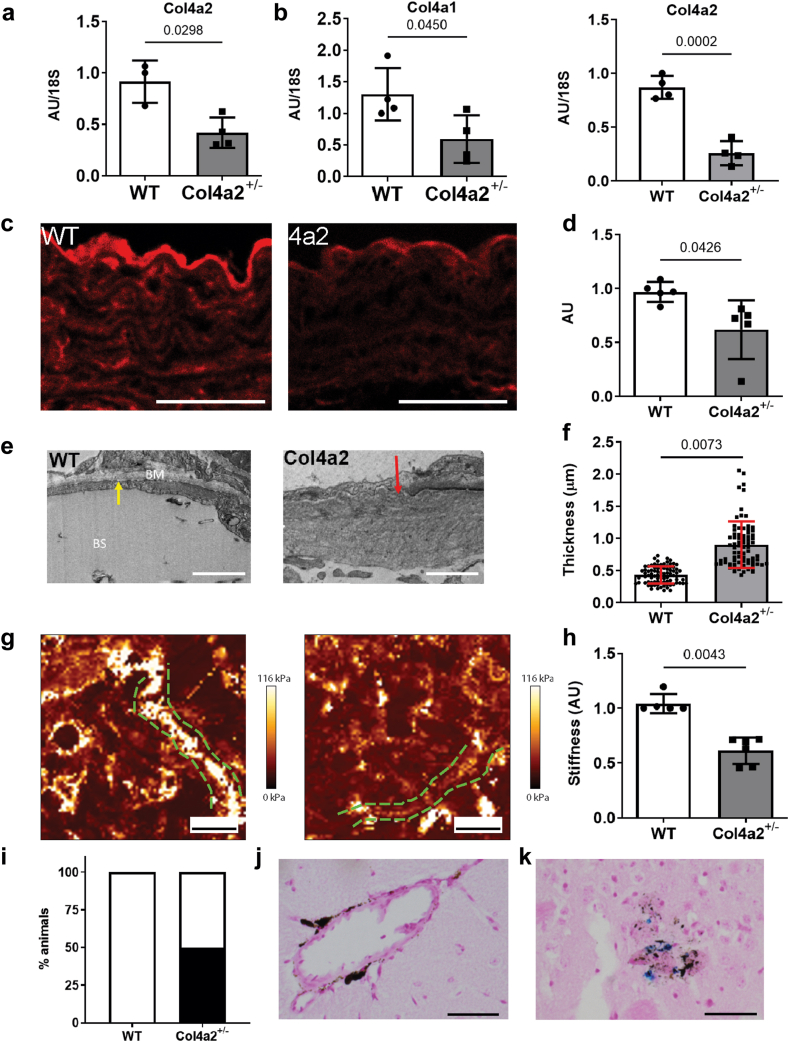
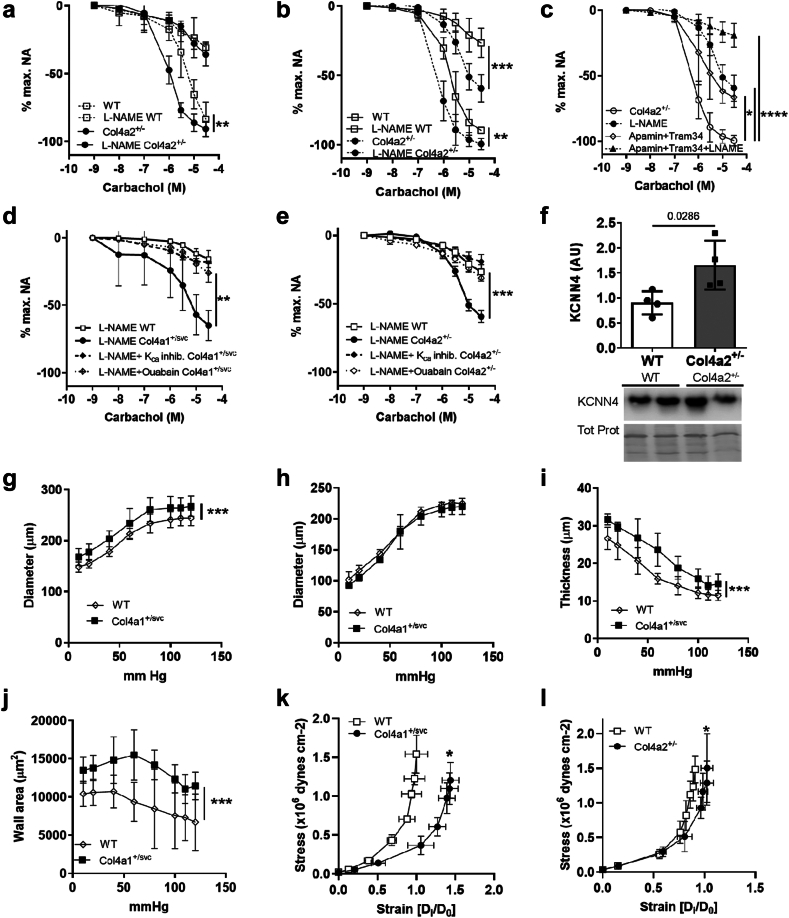
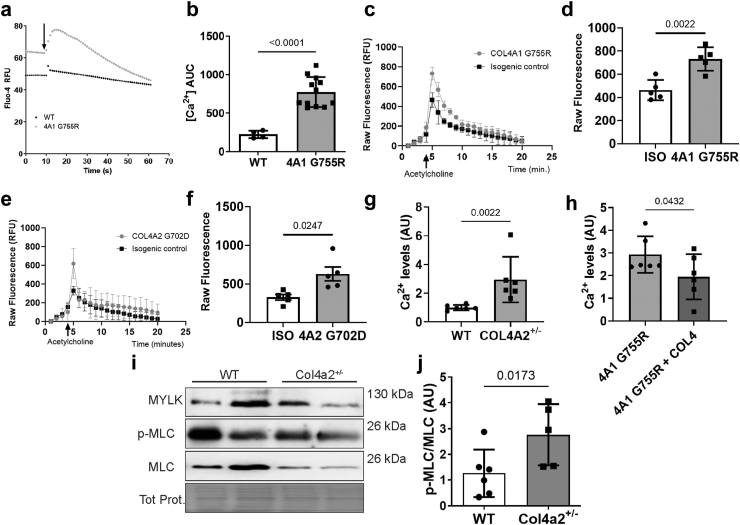
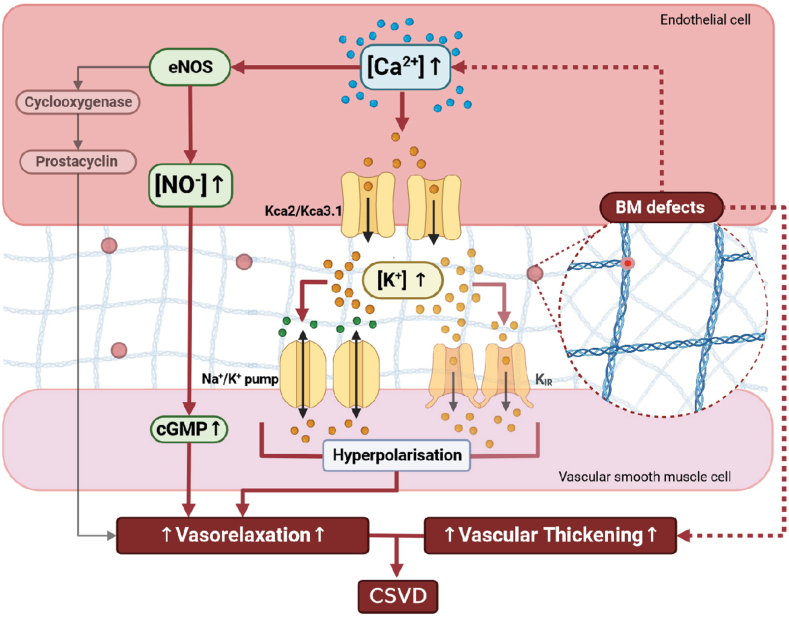
Findings: Col4a1 missense mutations cause early-onset CSVD independent of hypertension, with enhanced vasodilation of small arteries due to endothelial dysfunction, vascular wall thickening and reduced stiffness. Mechanistically, the early-onset dysregulated endothelium-dependent hyperpolarization (EDH) is due to reduced collagen IV levels with elevated activity and levels of endothelial Ca2+-sensitive K+ channels. This results in vasodilation via the Na/K pump in vascular smooth muscle cells. Our data support this endothelial dysfunction preceding development of CSVD-associated ICH is due to increased cytoplasmic Ca2+ levels in endothelial cells. Moreover, cerebral blood vessels of patients with sporadic CSVD show genotype-dependent mechanisms with wall thickening and lower collagen IV levels in those harboring common non-coding COL4A1/COL4A2 risk alleles.

Interpretation: COL4A1/COL4A2 variants act in genetic and sporadic CSVD with ICH via dysregulated EDH, and altered vascular wall thickness and biomechanics due to lower collagen IV levels and/or mutant collagen IV secretion. These data highlight EDH and collagen IV levels as potential treatment targets.

Funding: MRC, Wellcome Trust, BHF.

Keywords: Basement membrane; Cerebrovascular disease; Collagen; Endothelial dysfunction; Small vessel disease; Stroke.


Conflict of interest statement

Declaration of interests CDA reports sponsored research support from the American Heart Association (18SFRN34250007 and 21SFRN812095) and Bayer AG, and consulting with ApoPharma, outside the scope of the current work. RA-SS reports grants outside the submitted work from BHF, Chief Scientist Office of the Scottish Government, and National Institutes of Health Research Health Technology Assessment programme paid to The University of Edinburgh, consultancy income paid to The University from Recursion Pharmaceuticals, and reimbursement for endpoint adjudication paid to The University of Edinburgh from NovoNordisk. TVA reports he serves on the grants committee of DEBRA UK and was honorary Treasurer for the British Society of Matrix Biology (2016–2022).

Figures

Fig. 1
Fig. 1
Col4a1 glycine mutation causes vascular dysfunction. (a) Reduced contraction to noradrenaline (NA) in Col4a1+/SVC compared to wild type (WT) arteries (n = 5, area under the curve with followed by Welch’s t-test, point estimate −48.6 (95% CI: −69.63 to −27.57)). Graph of maximum constriction to noradrenaline is provided in Supplemental Fig. S1a. (b) 30% decreased maximal response to KCl in Col4a1+/SVC (n = 5, Welch’s t-test, point estimate −1.91 (95% CI −2.83 to −0.99)). (c) Increased basal NO generation in Col4a1+/SVC measured by increase in constriction of arteries to NA with pre-treatment of L-NAME compared to without L-NAME (n = 3, Welch’s t-test, point estimate 2.014 (95% CI 0.742–3.53)). (d) Increased endothelial cell independent vasodilation in Col4a1+/SVC vessels shown by elevated dose response to SNP of vessels pre-constricted with NA (n = 5, area under the curve followed by Welch’s t-test, point estimate 68.7 (95% CI 50.08–87.32)). (e) Greater endothelial dependent relaxation in Col4a1+/SVC vessels indicated by increased vasodilation to carbachol. Pre-treatment with NOS inhibitor L-NAME shows contribution of eNOS mediated vasodilation is reduced in mutant arteries (n = 4–7; area under the curve and Welch’s ANOVA with Dunnett’s T3 multiple comparison test; WT versus L-NAME WT p < 0.0001 point estimate 101.435 (95% CI 86.67–116.2), WT versus Col4a1+/SVC p = 0.0055, point estimate −88.42 (95% CI −129.0 to −47.85), L-NAME WT versus L-NAME Col4a1+/SVC p = 0.0293, point estimate −62.84 (95% CI −110.6 to −15.09), Col4a1+/SVC versus L-NAME Col4a1+/SVC p = 0.0007 point estimate 127 (95% CI 86.78–167.2). (f) Col4a1+/SVC vessels pre-treated with KCa inhibitors (KCa inhib) apamin and TRAM-34 reduce endothelium dependent relaxation by ∼50%. Endothelium dependent vasorelaxation in Col4a1+/SVC vessels pre-treated with apamin, TRAM-34 and L-NAME was similar to WT vessels pre-treated with L-NAME, indicating increased EDH vasodilation in mutant arteries (n = 4–7, area under the curve and Welch’s ANOVA with Dunnett’s T3 multiple comparison test; SVC vehicle versus SVC LNAME p = 0.0033, point estimate 88.99 (95% CI 38.49–139.5), SVC vehicle versus SVC LNAME + KCa inh p < 0.0001, point estimate 159.6 (95% CI 130.1–189.1), SVC vehicle versus SVC + KCa inh p = 0.0016, point estimate 82.815 (95% CI 41.53–124.1)) ∗p < 0.05, ∗∗p < 0.01, ∗∗∗p < 0.001, ∗∗∗∗p < 0.0001.
Fig. 2
Fig. 2
Basement membrane defects in Col4a2+/em2Wtsimice. (a) Reduced Col4a2 mRNA levels in cerebrovasculature of 6-month-old Col4a2+/em2Wtsi mice (Col4a2+/−) (n = 3–4, Welch’s t-test, point estimate −0.4963 (95% CI −0.9081 to −0.08450)). (b) Lower Col4a1 and Col4a2 mRNA levels in mesenteric arteries of 6 month old Col4a2+/em2Wtsi mice (n = 3–4, Welch’s t-test, Col4a1 point estimate −0.611 (95% CI −0.8004 to −0.4220); Col4a2 point estimate −0.71 (95% CI −1.398 to −0.02204)). (c) Immunostaining (red) against α2(IV) in aorta of wild type (WT) and Col4a2+/em2Wtsi (4a2) mice. Scale bar 50 μm. (d) Quantification of staining in (c) (n = 5, Welch’s t-test, point estimate −0.35 (95% CI −0.6827 to −0.01735)). (e) Multiple strand formation in BM of kidney Bowman’s capsule (red arrow, see also Supplemental Fig. S4 for vascular and tubular BM in kidney) Scale bar 2 μm. (f) Increased thickness of Bowmans Capsule BM in Col4a2+/em2Wtsi (data points are individual measures from n = 3 mice, Welch’s t-test applied on n = 3, point estimate 0.4708 (95% CI 0.3873–0.5543)) (g) Atomic force microscopy images displaying stiffness of the BM of Bowman’s capsule (green dotted line) in WT and Col4a2+/em2Wtsi. Scale bar 10 μm. See also Supplemental Fig. S3 for exemplar AFM images of height and stiffness (same image provided), and immunostaining used to guide AFM. (h). Reduced BM stiffness in Col4a2+/em2Wtsi (n = 5–6, Mann–Whitney U Test, point estimate: −0.3389 (96.97% CI −0.5588 to −0.2884)). (i) Presence of positive hemosiderin staining in 50% of Col4a2+/em2Wtsi (n = 6, Fisher’s exact test p = 0.18). (j) Pigment deposit in Col4a2+/em2Wtsi Scale bar 50 μm. (k) Hemosiderin positive stain (blue) in Col4a2+/em2Wtsi. Scale bar 50 μm.
Fig. 3
Fig. 3
Vascular defects due to reduced collagen IV levels. (a) Dose response curve to carbachol in presence and absence of NOS inhibitor L-NAME in mesenteric arteries of 3-month-old wild type (WT) and Col4a2+/em2Wtsi (Col4a2+/−) (WT versus Col4a2+/em2Wtsi p = 0.0027, point estimate −50.35 (95% CI −77.88 to −22.82). Vasoconstriction and endothelium-independent vasodilation measured by SNP dose response curve is provided in Supplemental Fig. S5. (b) Dose response curve to carbachol in presence and absence of L-NAME (absence: WT, Col4a2+/−; presence: L-NAME) in 6-month-old mice reveals increased NO-dependent and -independent vasodilation in Col4a2+/em2Wtsi (n = 4–5, WT versus Col4a2+/em2Wtsi p = 0.0009, point estimate −46.3 (95% CI −68.51 to −24.09), WT L-NAME versus Col4a2+/em2Wtsi L-NAME p = 0.0016, point estimate −31.69 (95% CI −47.43 to −15.95)). (c) Dose response curve to carbachol in presence of L-NAME (L-NAME), small and intermediate KCa channel blocker Apamin and TRAM-34, and L-NAME plus apamin and TRAM-34 shows EDH vasodilation in 6-month-old Col4a2+/em2Wtsi (Col4a2+/em2Wtsi versus Col4a2+/em2Wtsi L-NAME p < 0.0001, point estimate 107.58 (95% CI 89.47–125.7); Col4a2+/em2Wtsi versus Col4a2+/em2Wtsi KCa Inh p = 0.0216, point estimate 72.86 (95% CI 19.03–126.7); Col4a2+/em2Wtsi versus Col4a2+/em2Wtsi L-NAME + KCa Inh, p < 0.0001 point estimate 140.8 (95% CI 120.3–161.3)). (d) Dose response curve to carbachol in presence of L-NAME, apamin and TRAM-34 (KCa inhibitor), and ouabain (inhibitor of Na+/K+ pump) in 3-month-old Col4a1+/SVC reveals EDH is mediated by Na+/K+ pump. Col4a1+/SVC L-NAME versus Col4a1+/SVC ouabain, p = 0.0012 point estimate 0.001125 (95% CI 0.0007186−0.001532)) (e) Dose response curve to carbachol in presence of L-NAME, apamin and TRAM-34 (KCa inhibitor), and ouabain in 6-month-old Col4a2+/em2Wtsi (Col4a2+/em2Wtsi L-NAME versus Col4a2+/em2Wtsi ouabain, p = 0.0005 point estimate 0.0006846 (95% CI 0.0004138–0.0009554)) (f) Increased protein levels in mesenteric arteries of intermediate KCa channel (KCNN4) in 6-month-old WT and Col4a2+/em2Wtsi (Col4a2+/−). Tot. Prot: Ponceau stain of total protein (Mann–Whitney U test, n = 4, point estimate 0.6160 (97.14%CI 0.08814–1.689)). (g) Increased outer diameter of mesenteric arteries over range of pressures of 3-month-old Col4a1+/SVC mice compared to wild type (WT) (p = 0.0003, point estimate 2553 (95% CI 2261–2845)). (h) Inner diameter of mesenteric arteries of 3-month-old wild type (WT) and Col4a1+/SVC mice. (i) Elevated arterial wall thickness of 3-month-old Col4a1+/SVC mice compared to wild type (WT) (p = 0.0003, point estimate 567 (95% CI 383.1–750.9)) (j) Increased cross sectional wall area of 3-month-old wild type Col4a1+/SVC mice (p = 0.0003, point estimate 517,036 (95% CI 358,122–675,950)) (k) Stress–strain curve shows reduced vascular stiffness in 3-month-old Col4a1+/SVC (p = 0.0263, point estimate −0.0608 (95% CI −0.08236 to −0.03924)) (l) Reduced vascular stiffness in 6-month-old Col4a2+/em2Wtsi (Col4a2+/−) (p = 0.0396, point estimate 0.05891 (95% CI 0.01022–0.1076)) (a–e n = 3–5, Area under curve and Welch’s ANOVA with Dunnett’s test for multiple comparison; g-l n = 5 Area under curve followed by Welch’s t-test n = 5). ∗p < 0.05 ∗∗p < 0.01 ∗∗∗p < 0.001 ∗∗∗∗p < 0.0001.
Fig. 4
Fig. 4
COL4A1/COL4A2 variants increased Ca2+levels in brain endothelial cells. (a) Increased basal intracellular calcium levels and after acetylcholine stimulation in human brain microvascular endothelial cell line (HBEC) harboring a COL4A1 mutation measured using Fluo-4 Ca2+ tracer (RFU:relative fluorescent units). WT: wild type; 4A1 G755R: COL4A1+/G755R. (b) Quantification of intracellular Ca2+ concentration in COL4A1 mutant cells (area under the curve analysis of graphs in (a) (AUC) with Welch’s t-test; wild type n = 4, Col4a1 G755R n = 12, point estimate 550.2 (95% CI 419.0–681.4)). (c) Trace of intracellular Ca2+ levels in human iPSC-derived brain endothelial cells showing increased response to acetylcholine in cells carrying COL4A1 G755R mutation compared to isogenic control (iso). (d) Average peak value of (c) show increased cytoplasmic Ca2+ levels in mutant hIPSC-derived brain endothelial cells (Welch’s t-test, n = 5, point estimate 267.4 (95% CI 129.3–405.5)). (e) Trace of intracellular Ca2+ levels in COL4A2 mutant (G702D) and isogenic control human iPSC-derived brain endothelial cells (n = 5). (f) Average peak value of (e) show cytoplasmic Ca2+ levels in COL4A2 G702D mutant and isogenic control hIPSC-derived brain endothelial cells (Welch’s t-test, n = 5, point estimate 300.08 (95% CI 55.76–544.4)) (g) Basal intracellular Ca2+ levels in COL4A2+/− HBEC cell line and WT (n = 6, Mann–Whitney U test, point estimate 1.528 (95.89% CI 0.8466–4.757)). (h) Effects of extracellular collagen IV levels via coating wells with COL4 on basal intracellular Ca2+ levels in COL4A1WT/G755R HBEC cells (uncoated: 4A1 G755R; collagen IV coated: 4A1 G755R + COL4; n = 6, Paired t-test, point estimate −0.981 (95% CI −1.918 to −0.04396)). (i) Western blot against myosin light chain kinase (MLK), total and phosphorylated myosin light chain (MLC, p-MLC) in mesentery of 6-month-old Col4a2+/− mice. Tot Prot: Ponceau stain of total protein (j) Increased ratio of phosphorylated: total MLC in mesentery of Col4a2+/− mice. p = 0.0173 Mann–Whitney U test, point estimate 1.757 (96.97% CI 0.03886–3.258)).
Fig. 5
Fig. 5
Collagen IV levels and wall thickness in human sporadic CSVD. (a) Immunostaining against collagen IV on brain tissue from non-ICH non-CSVD controls (n = 18), sporadic CSVD with ICH without rare coding COL4A1/2 variants (CSVD) (n = 18), and sporadic CSVD with ICH harboring rare COL4A1/2 variants (COL4-ICH) (n = 7) Size Bar 50 μM. (b) Vessel wall thickening in sporadic CSVD without rare COL4 variants (CSVD) and sporadic CSVD with ICH harboring rare COL4 variants (COL4-ICH). Vessel wall thickness: ratio of vascular lumen over total vessel area defined by parenchymal basement membrane stained with collagen IV (see Supplemental Fig. S9). Welch’s ANOVA with Dunnet’s test. Control versus cSVD point estimate 10.415 (95% CI 4.901–15.93), control versus COL4-ICH point estimate 7.313 95% CI (2.396–12.23). (c) Quantification of collagen IV staining as fraction of vessel wall area shows reduced levels in sporadic CSVD without rare COL4 variants sporadic (CSVD). Sporadic ICH with rare COL4 variants (COL4-ICH). Kruskal Wallis test ANOVA with Bonferroni adjusted Mann–Whitney post hoc test control versus cSVD p = 0.0141, point estimate 7.89% (95.35% CI: 0.76%–11.43%).
Fig. 6
Fig. 6
Mechanisms of COL4A1/COL4A2 variants in CSVD. Diagram depicting overarching CSVD mechanism whereby basement membrane (BM) defects due to reduced collagen IV levels increase intracellular calcium levels leading to increased endothelial cell mediated vasodilation via EDH vasodilation mediated by KCa channels and Na/K pump. In addition, BM defects can also be due to mutant protein secretion, and both are coupled with vascular wall thickening in CSVD independent of hypertension.

References

    1. Haffner C., Malik R., Dichgans M. Genetic factors in cerebral small vessel disease and their impact on stroke and dementia. J Cereb Blood Flow Metab. 2016;36(1):158–171. - PMC - PubMed
    1. Rodrigues M.A., Samarasekera N., Lerpiniere C., et al. The Edinburgh CT and genetic diagnostic criteria for lobar intracerebral haemorrhage associated with cerebral amyloid angiopathy: model development and diagnostic test accuracy study. Lancet Neurol. 2018;17(3):232–240. - PMC - PubMed
    1. Wardlaw J.M., Smith C., Dichgans M. Small vessel disease: mechanisms and clinical implications. Lancet Neurol. 2019;18(7):684–696. - PubMed
    1. Yurchenco P.D., Ruben G.C. Basement membrane structure in situ: evidence for lateral associations in the type IV collagen network. J Cell Biol. 1987;105(6):2559–2568. - PMC - PubMed
    1. Dean A., Van Agtmael T. In: The collagen superfamily and collagenopathies. Ruggiero F., editor. Springer International Publishing; Cham: 2021. Collagen IV-related diseases and therapies; pp. 143–197.

MeSH terms

LinkOut - more resources