. 2024 Sep 11;4(9):100641.
doi: 10.1016/j.xgen.2024.100641. Epub 2024 Aug 30.

An isoform-resolution transcriptomic atlas of colorectal cancer from long-read single-cell sequencing

Affiliations

An isoform-resolution transcriptomic atlas of colorectal cancer from long-read single-cell sequencing

Zhongxiao Li et al. Cell Genom. .

Abstract

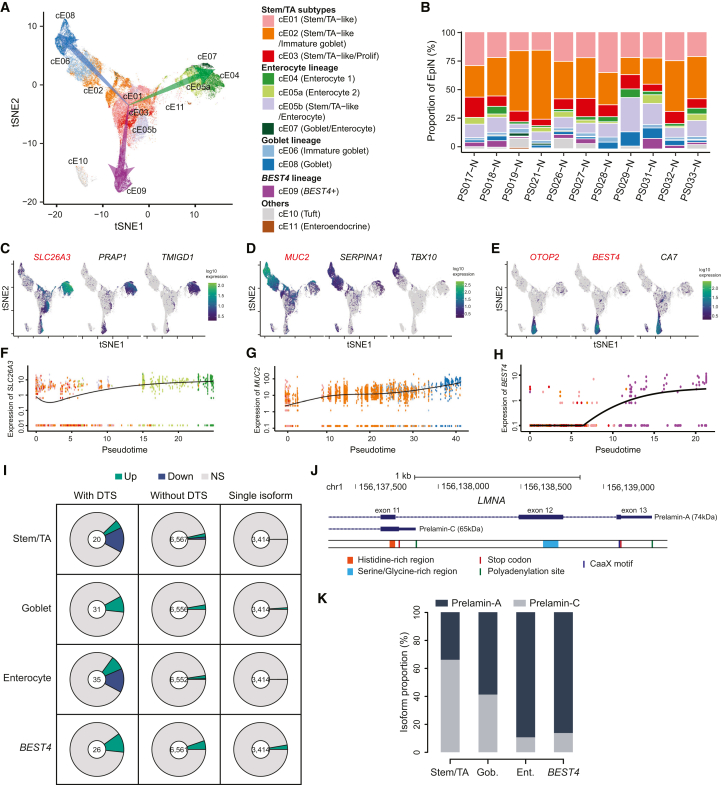
Colorectal cancer (CRC) ranks as the second leading cause of cancer deaths globally. In recent years, short-read single-cell RNA sequencing (scRNA-seq) has been instrumental in deciphering tumor heterogeneities. However, these studies only enable gene-level quantification but neglect alterations in transcript structures arising from alternative end processing or splicing. In this study, we integrated short- and long-read scRNA-seq of CRC samples to build an isoform-resolution CRC transcriptomic atlas. We identified 394 dysregulated transcript structures in tumor epithelial cells, including 299 resulting from various combinations of splicing events. Second, we characterized genes and isoforms associated with epithelial lineages and subpopulations exhibiting distinct prognoses. Among 31,935 isoforms with novel junctions, 330 were supported by The Cancer Genome Atlas RNA-seq and mass spectrometry data. Finally, we built an algorithm that integrated novel peptides derived from open reading frames of recurrent tumor-specific transcripts with mass spectrometry data and identified recurring neoepitopes that may aid the development of cancer vaccines.

Keywords: colorectal cancer; long-read RNA-seq; neoantigen; scRNA-seq.


Conflict of interest statement

Declaration of interests The authors declare no competing interests.

Figures

None
Graphical abstract
Figure 1
Figure 1
The short-read single-cell transcriptomic atlas of human CRC (A) Schematic illustration of the workflow of long-read (PacBio) and short-read (Illumina) single-cell RNA sequencing (scRNA-seq) on tumor and normal samples from 12 CRC patients. (B and C) tSNE (t-distributed stochastic neighbor embedding) plots illustrating (B) the major cell types and (C) the source of cells from in-house tumor and normal samples, and the public dataset (c295). (D) Number of detected cells for each major cell type by in-house Illumina scRNA-seq data. (E) Proportion of detected cells from each major cell type in each sample. (F) Copy-number variation (CNV) profiling of each cell from each sample.
Figure 2
Figure 2
The long-read single-cell transcriptomic atlas of human CRC (A) Schematic showing four structural types of isoforms identified by PacBio scRNA-seq data. FSM, full splice match; ISM, incomplete splice match; NIC, novel in catalog; NNC, novel not in catalog. The black box denotes a novel splice site. (B) Proportion of the identified transcripts from each isoform structural type in each major cell type. Others include antisense, genic (from intronic regions), and intergenic transcripts. (C) Percentage of the identified isoforms with supporting Cap Analysis of Gene Expression (CAGE) peaks for the 5′ ends and polyA peaks for the 3′ ends. (D) Percentage of the identified isoforms with different numbers (0, 1, 2, 3) of splice junctions that are not detected in the TCGA-COAD bulk RNA-seq data. (E) Percentage of genes with single and multiple detected isoforms. (F) Structure of the four types of isoforms from EPCAM identified by PacBio scRNA-seq data. The identified novel splice sites are highlighted with black boxes.
Figure 3
Figure 3
Dysregulated transcript structures in epithelial tumor cells (A) Illustration of dysregulated gene expression (DGE) and dysregulated transcript structure (DTS) in epithelial tumor (EpiT) compared to normal (EpiN) cells. (B) Scatterplot showing the correlation in fold change of genes between EpiT and EpiN quantified by long- and short-read sequencing. Up (Down), measured by both sequencing methods as significantly up- or downregulated; discordant, measured by both sequencing methods as significant but with inconsistent directions of change; NS, not significant. (C) RT-qPCR validation of the top three DGE events, MMP7, REG1A, and REG3A, from (B) using four pairs of CRC tumor (T) and adjacent normal (N) patient samples (PS). p values from the Student's t test. ∗∗p < 0.01, ∗∗∗p < 0.001. (D) Proportion of upregulated (Up), downregulated (Down), and not significantly changed (NS) genes for those with DTS, without DTS, and those with only one detected isoform. p value from chi-squared test. (E) Enrichment of gene ontology (GO) terms for genes with DTS. (F) Structures of the three identified isoforms from PCNA (upper), the gene expression pattern, and the percentage of each isoform in EpiN and EpiT. (G) Numbers of DTS isoforms with co-occurrence of two types of AS events (or single type of events on the diagonal) and their percentage of the total corresponding isoforms. p value from two-tailed binomial test. AF, alternative first exon; SE, skipped exon; MX, mutually exclusive exon; A5, alternative 5′ splice site; A3, alternative 3′ splice site; RI, retained intron; AL, alternative last exon. (H and I) Structural illustration of isoforms (arrows indicate DTS isoforms) from (H) ARGHDIA and (I) TMEM259 with co-occurrence of two different types of splicing events. ARGHDIA DTS contains coupled AF and RI, while DTS from TMEM259 contains coupled RI and A3.
Figure 4
Figure 4
Dysregulated RNA editing in epithelial tumor cells (A) Illustration of two approaches to calculate RNA-editing levels: RNA-editing level per site (REPS) and RNA-editing level per isoform (REPI). (B) Scatterplot showing REPS for each detected event in epithelial tumor (EpiT) and normal (EpiN) cells. REPS based on RNA-seq data from GTEx are illustrated by scaled colors. (C) Sanger sequencing validation of the RNA-editing sites and levels as shown in (B). Representative chromatograms are shown. (D) Illustration of the detected RNA-editing events on each isoform from CDK13 (upper) and the corresponding REPI in EpiN and EpiT. (E) REPI for each event on each isoform from the sites highlighted in (B) in CDK13, ANKRD40CL, and NEAT1. (F) Consistency between REPS and REPI in EpiT compared to EpiN. Red boxes indicate inconsistencies between REPS and REPI. (G) Heatmap showing the number of isoforms with detected RNA editing versus the total number of detected isoforms of the gene. Each dot represents an editing event at a gene locus. Dots are colored according to their REPS, and those for the three RNA-editing events in (E) are highlighted.
Figure 5
Figure 5
Transcriptome profiling of normal epithelial cell subtypes from multiple lineages (A) tSNE plot illustrating subtypes of epithelial normal cells (EpiN) and the three main lineages of differentiation (indicated by arrows), including enterocyte (green), goblet (blue), and BEST4 (purple). (B) Proportion of EpiN subtypes in each sample. (C–E) The top identified markers with lineage-specific expression for (C) enterocyte, (D) goblet, and (E) BEST4. Known markers are in red. (F–H) RNA expression of lineage-specific marker genes over the pseudotime was estimated by trajectory analysis along the (F) enterocyte, (G) goblet, and (H) BEST4 lineages. (I) Proportion of upregulated (Up), downregulated (Down), and not significantly changed (NS) genes for genes with DTS, without DTS, and those with only one detected isoform in the stem/TA subtypes and each differentiated lineage. (J) Structure of the LMNA transcripts encoding two Prelamin protein isoforms, Prelamin-A and Prelamin-C. (K) Proportion of the LMNA transcripts encoding the two Prelamin protein isoforms in the stem/TA subtypes and the three differentiation lineages.
Figure 6
Figure 6
Dysregulation of genes and isoforms in the epithelial tumor cell subtypes (A) Schematic showing the comparisons between each EpiT subtype and their corresponding EpiN cell subtype. (B) Proportion of EpiT subtypes in each sample. (C) Proportion of the LMNA transcripts encoding the two Prelamin protein isoforms in each EpiT subtype. (D) Structure of the KRT8 transcripts encoding three CK8 protein isoforms with molecular weights of 56.6, 53.7, and 46.2 kDa. (E) Proportion of the KRT8 transcripts encoding each CK8 protein isoform in each EpiN and EpiT subtype. (F) Correlation between the usage of the 56.6-kDa transcript isoform and SMAD4 expression in each EpiN and EpiT subtype. (G) Fold changes (log2 transformed) of top significant genes with dysregulated expression in each EpiT subtype compared to the corresponding EpiN subtype. (H) Overall survival of TCGA-COAD patients with different expression levels of REG4. (I) Progression-free survival of TCGA-COAD patients with different scores of cE02 and cE03 signature genes. H, high; L, low.
Figure 7
Figure 7
Identification of common neoantigens for cancer vaccine from recurrent tumor-specific transcripts (A) Workflow for the identification of neoepitopes from novel tumor-specific recurrent transcript isoforms for cancer vaccine development. (B and C) Selection of neoepitopes for a novel isoform of (B) STMN3 (TCONS_0078414) and (C) CPNE7 (TCONS_00044960). The selected MS-supported neoepitopes are encircled by solid boxes, and the non-MS-supported ones by dashed-line boxes. (D) PCR and Sanger sequencing validation of the unique splice junctions for the recurrent tumor-specific isoforms from which the neoepitope panel is derived. Novel splice junctions are depicted by black dotted lines and 5′ junction of sequences unique to selected isoforms by red dotted lines. Representative chromatograms and images are shown. (E) Western blot validation of overexpressing the HA-tagged open reading frames (ORFs) derived from the validated neoepitopes in colon epithelial cell line, CCD 841 CoN, and CRC cell line, DLD-1. (F) Effect of ORF overexpression from (E) on anchorage-independent growth in DLD-1 cells. p values from the Student’s t test, ∗∗∗p < 0.001. (G) HLA binding profile of the panel of 22 neoepitopes against the HLA alleles of the TCGA-COAD patients (values of highest binding affinity of the patients’ alleles are shown). Each row is sorted from the individual with the highest binding affinity to the lowest. The thresholds of strong binding affinity (ES rank <0.5) and weak binding affinity (ES rank <2) are marked accordingly. (H) Binding affinity of the 22 neoepitopes for the 12 in-house patients. “Weak/strong binding” denotes the binding affinity of the neoepitopes to at least one patient HLA allele (each row). “Strong binding & detected by LR-seq” neoepitopes are indicated by red boxes in the corresponding heatmap. The top panel summarizes the total number of neoepitopes that satisfies each criterion above per patient. The right panel summarizes the total number of patients for whom the epitope satisfies the criteria above.

References

    1. Burrell R.A., McGranahan N., Bartek J., Swanton C. The causes and consequences of genetic heterogeneity in cancer evolution. Nature. 2013;501:338–345. doi: 10.1038/nature12625. - DOI - PubMed
    1. Meacham C.E., Morrison S.J. Tumour heterogeneity and cancer cell plasticity. Nature. 2013;501:328–337. doi: 10.1038/nature12624. - DOI - PMC - PubMed
    1. Li H., Courtois E.T., Sengupta D., Tan Y., Chen K.H., Goh J.J.L., Kong S.L., Chua C., Hon L.K., Tan W.S., et al. Reference component analysis of single-cell transcriptomes elucidates cellular heterogeneity in human colorectal tumors. Nat. Genet. 2017;49:708–718. doi: 10.1038/ng.3818. - DOI - PubMed
    1. Becker W.R., Nevins S.A., Chen D.C., Chiu R., Horning A.M., Guha T.K., Laquindanum R., Mills M., Chaib H., Ladabaum U., et al. Single-cell analyses define a continuum of cell state and composition changes in the malignant transformation of polyps to colorectal cancer. Nat. Genet. 2022;54:985–995. doi: 10.1038/s41588-022-01088-x. - DOI - PMC - PubMed
    1. Zhang L., Li Z., Skrzypczynska K.M., Fang Q., Zhang W., O’Brien S.A., He Y., Wang L., Zhang Q., Kim A., et al. Single-Cell Analyses Inform Mechanisms of Myeloid-Targeted Therapies in Colon Cancer. Cell. 2020;181:442–459.e29. doi: 10.1016/j.cell.2020.03.048. - DOI - PubMed

MeSH terms

Substances