. 2024 Nov:89:102019.
doi: 10.1016/j.molmet.2024.102019. Epub 2024 Aug 30.

The GLP-1 medicines semaglutide and tirzepatide do not alter disease-related pathology, behaviour or cognitive function in 5XFAD and APP/PS1 mice

Affiliations

The GLP-1 medicines semaglutide and tirzepatide do not alter disease-related pathology, behaviour or cognitive function in 5XFAD and APP/PS1 mice

Leticia Forny Germano et al. Mol Metab. 2024 Nov.

Abstract

Objective: The development of glucagon-like peptide-1 receptor (GLP-1R) agonists for the treatment of type 2 diabetes and obesity has been accompanied by evidence for anti-inflammatory and cytoprotective actions in the heart, blood vessels, kidney, and brain. Whether GLP-1R agonists might be useful clinically for attenuating deterioration of cognitive dysfunction and reducing the progression of Alzheimer's disease remains uncertain.

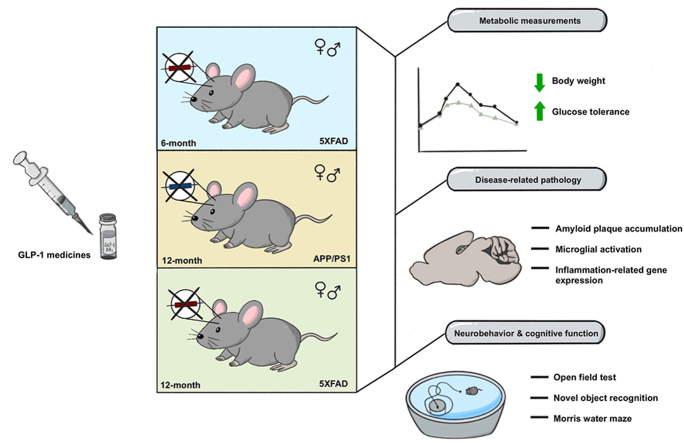
Methods: Here we evaluated the actions of semaglutide and tirzepatide, clinically distinct GLP-1 medicines, in two mouse models of neurodegeneration.

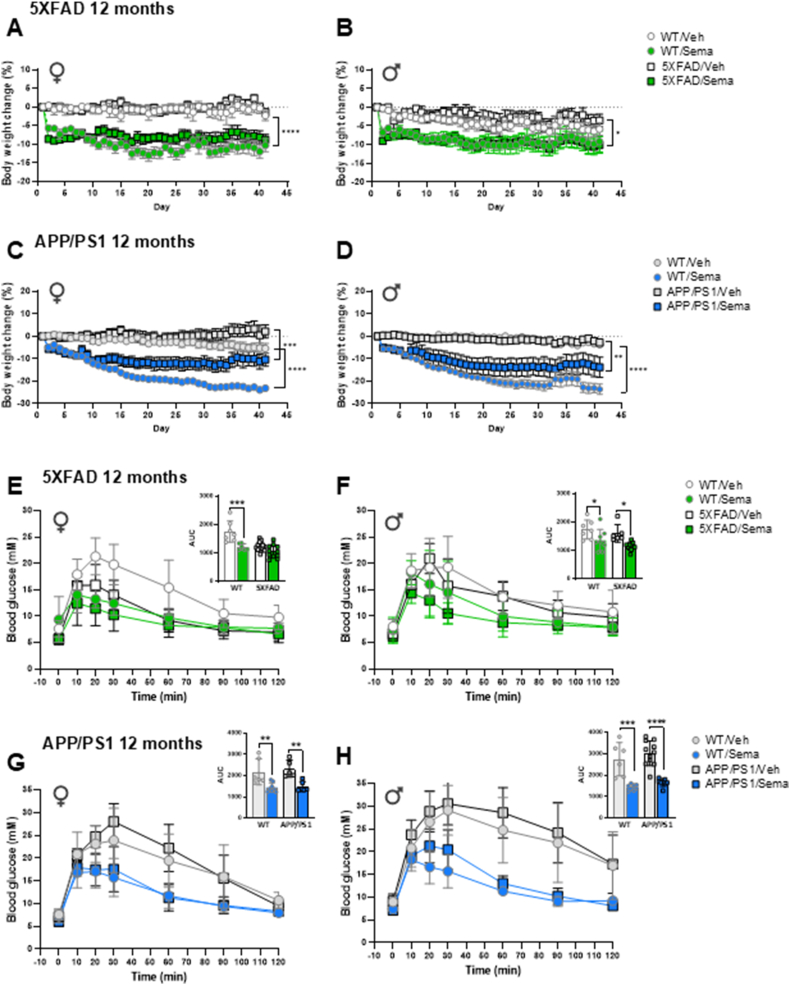
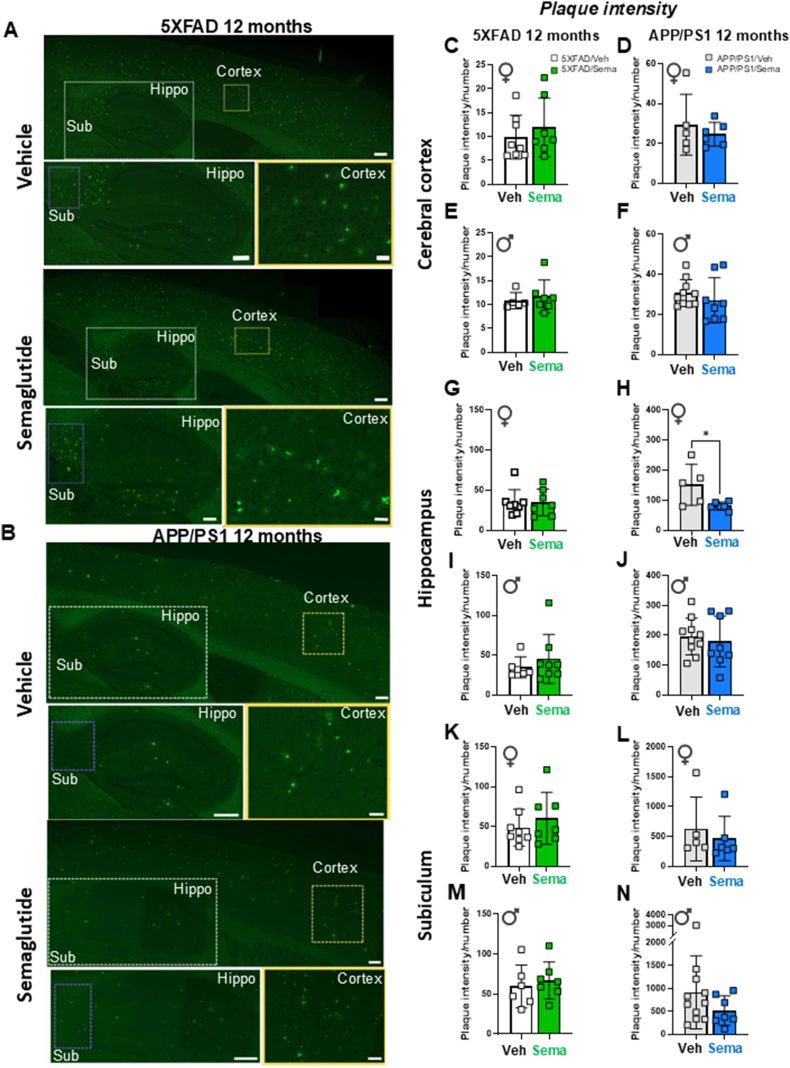
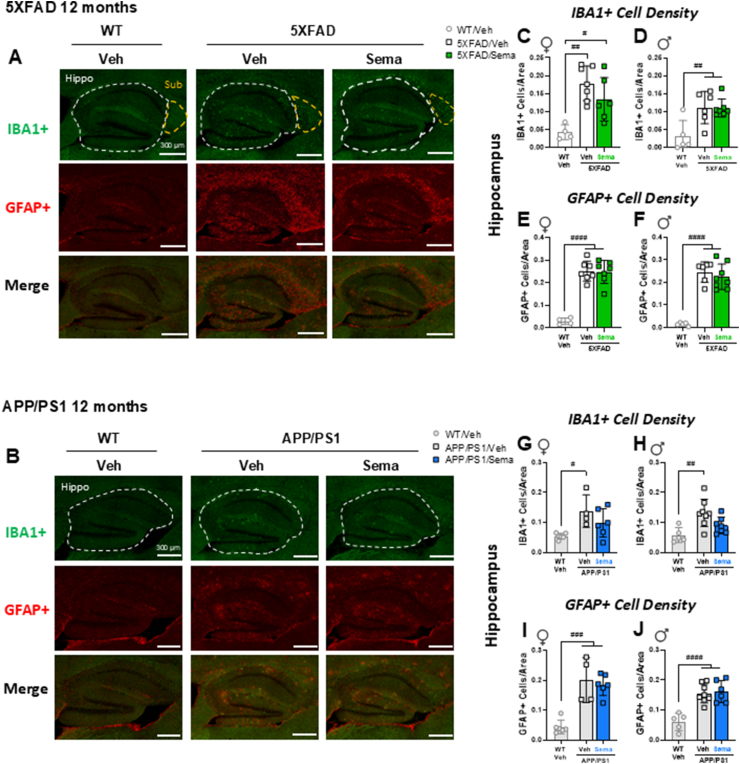
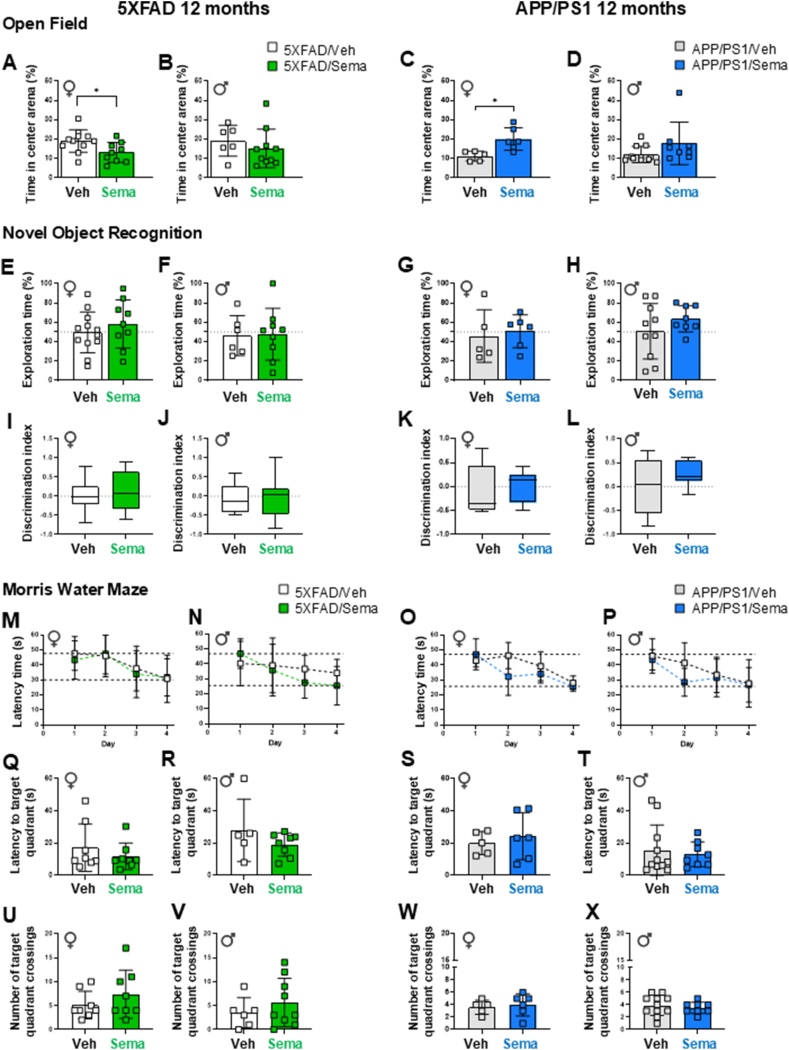
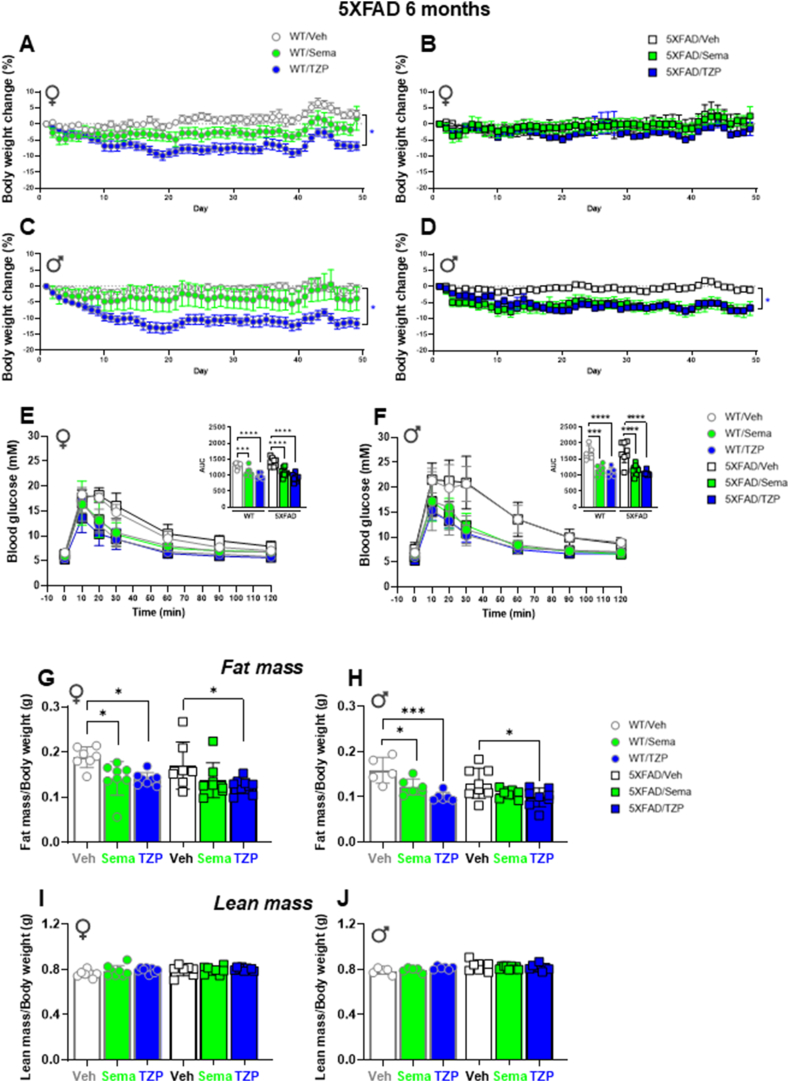
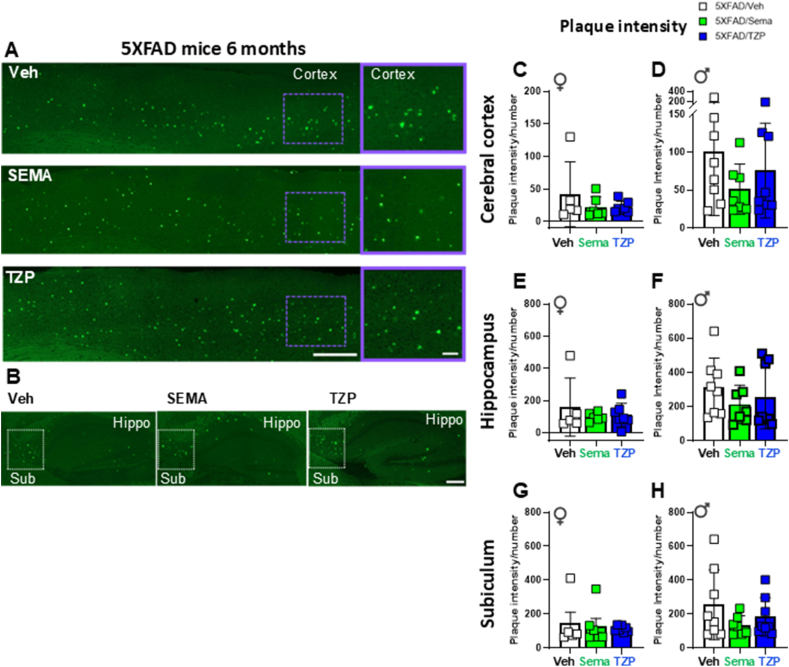
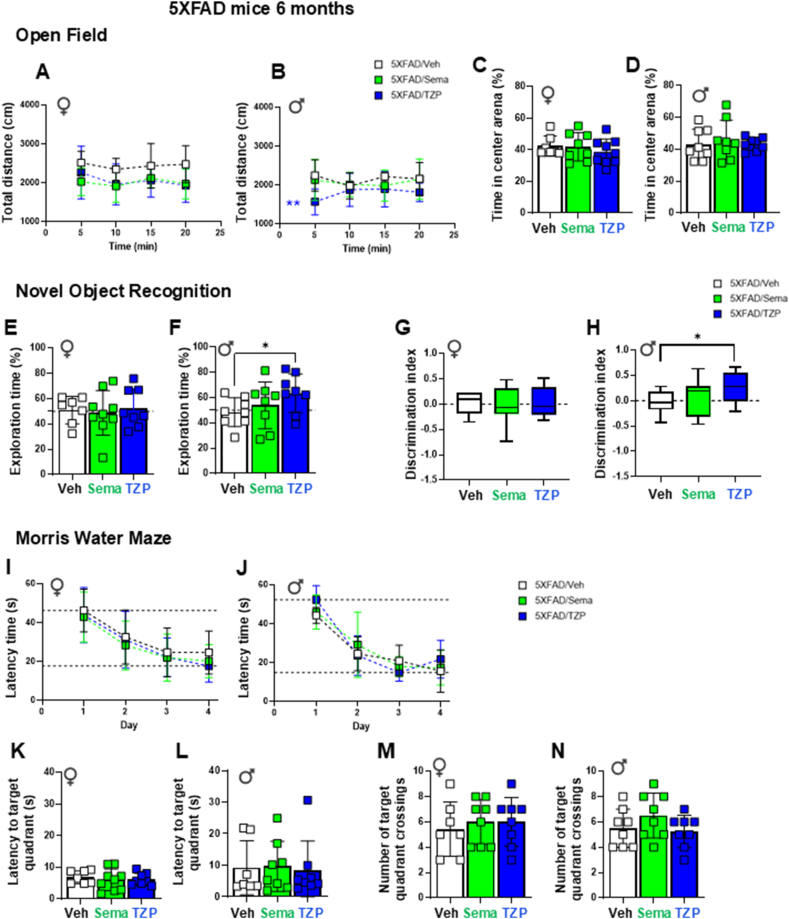
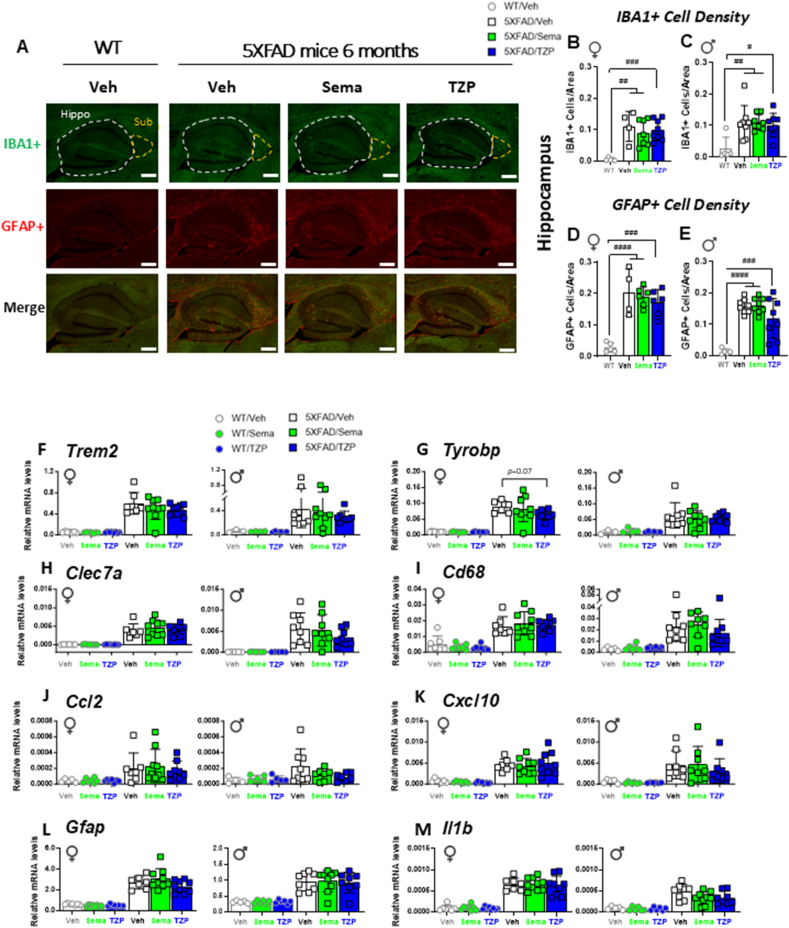
Results: Semaglutide reduced body weight and improved glucose tolerance in 12-month-old male and female 5XFAD and APP/PS1 mice, consistent with pharmacological engagement of the GLP-1R. Nevertheless, amyloid plaque density was not different in the cerebral cortex, hippocampus, or subiculum of semaglutide-treated 12-month-old 5XFAD and APP/PS1 mice. IBA1 and GFAP expression were increased in the hippocampus of 5XFAD and APP/PS1 mice but were not reduced by semaglutide. Moreover, parameters of neurobehavioral and cognitive function evaluated using Open Field testing or the Morris water maze were not improved following treatment with semaglutide. To explore whether incretin therapies might be more effective in younger mice, we studied semaglutide and tirzepatide action in 6-month-old male and female 5XFAD mice. Neither semaglutide nor tirzepatide modified the extent of plaque accumulation, hippocampal IBA1+ or GFAP+ cells, or parameters of neurobehavioral testing, despite improving glucose tolerance and reducing body weight. mRNA biomarkers of inflammation and neurodegeneration were increased in the hippocampus of male and female 5XFAD mice but were not reduced after treatment with semaglutide or tirzepatide.

Conclusions: Collectively, these findings reveal preservation of the metabolic actions of two GLP-1 medicines, semaglutide and tirzepatide, yet inability to detect improvement in structural and functional parameters of neurodegeneration in two mouse models of Alzheimer's disease.

Keywords: Alzheimer's; Diabetes; GLP-1; Glucagon-like peptides; Inflammation; Neurodegeneration; Obesity.


Conflict of interest statement

Declaration of competing interest Dr. Drucker has served as a consultant or speaker within the past 12 months to Altimmune, Amgen, AstraZeneca Boehringer Ingelheim, Kallyope, Merck Research Laboratories, Novo Nordisk Inc., Pfizer Inc. and Zealand Pharma Inc. Laurie Baggio is currently an employee of Avalere Health. None of the authors have anything else to declare.

Figures

Image 1
Graphical abstract
Figure 1
Figure 1
Semaglutide treatment induces body weight loss and improves glucose tolerance in 12-month-old 5XFAD and APP/PS1 mice. Daily percentage of body weight change from baseline of regular chow diet-fed 12-month-old 5XFAD (A, B), APP/PS1 (C, D) and wildtype matched female (♀) and male (♂) mice as indicated. Mice were treated with weekly incremental doses of semaglutide (10, 17, 25 nmol/kg) as shown in Supplemental Figure 1A. Glucose excursions following an i.p. glucose challenge in 12-month-old 5XFAD (E, F), APP/PS1 (G, H) and wildtype matched female (♀) and male (♂) mice treated with semaglutide (25 nmol/kg) or vehicle (saline). Inset graphs represent the Area Under the Curve (AUC) of the blood glucose excursions. AUC data for AD and E-H were analyzed by 2-way ANOVA with Sidak's post-hoc test for comparison of WT or transgenic-vehicle vs. semaglutide-treated mice. ∗p < 0.05, ∗∗p < 0.01, ∗∗∗p < 0.001, ∗∗∗∗p < 0.0001 vehicle vs. semaglutide-treated mice. Data are represented as means ± SEM (A–D) or means ± SD (E-H, and AUCs). n = 5–13 in each group of vehicle-(Veh) or semaglutide-(Sema) treated mice.
Figure 2
Figure 2
Effect of semaglutide on amyloid beta content in 12-month-old 5XFAD and APP/PS1 mice. Representative images of Thioflavin S staining of vehicle- and semaglutide (25 nmol/kg)-treated 5XFAD (A) and APP/PS1 (B) mice. Bottom panels in each image represent magnification of areas highlighted in the upper panels of the cerebral cortex (Cortex), hippocampus (Hippo) and subiculum (Sub) regions. Scale bars represent 100 μm (upper panels), 50 μm (lower panel for hippocampus and subiculum) and 10 μm (lower panel for cortex). Quantification of the plaque intensity in the cerebral cortex (C–F), hippocampus (G–J) and subiculum (K–N) after Thioflavin S staining in vehicle- or semaglutide (25 nmol/kg)-treated 12-month-old 5XFAD (left panels) and APP/PS1 (right panels) female (♀) and male (♂) mice. Data were analyzed by Mann–Whitney U test, or unpaired, two-tailed Student's t test. ∗p < 0.05 vehicle vs. semaglutide-treated mice. Data are represented as means ± SD. n = 5–11 in each group of vehicle (Veh)- or semaglutide (Sema)-treated mice.
Figure 3
Figure 3
Effect of semaglutide on activated microglia (IBA1+) and reactive astroglia (GFAP+) in 12-month-old 5XFAD and APP/PS1 mice. Representative images of IBA1+ cells (green), GFAP+ cells (red), or cells co-stained with both IBA1 and GFAP antibodies (bottom panel) in the hippocampus (Hippo) or subiculum (Sub) of 12-month-old WT and vehicle- or semaglutide (25 nmol/kg)-treated 5XFAD (A) and APP/PS1 (B) mice. Scale bars represent 300 μm. Areas of interest are encircled by dashed lines. (C–J) Quantification of the number of IBA1+ cells per area (C, D) and the number of GFAP+ cells per area (E, F) in the hippocampus of 12-month-old female (♀) and male (♂) WT and 5XFAD mice. Quantification of the number of IBA1+ cells per area (G, H) and the number of GFAP+ cells per area (I, J) in the hippocampus of 12-month-old female (♀) and male (♂) WT and APP/PS1 mice. Data (C–J) were analyzed by 1-way ANOVA with Tukey's post-hoc test. #p < 0.05, ##p < 0.01 ###p < 0.001, ####p < 0.0001 WT vs. transgenic mice. Data are represented as means ± SD. n = 4–8 in each group of vehicle (Veh)- or semaglutide (Sema)-treated mice.
Figure 4
Figure 4
Cognitive test performance of 12-month-old 5XFAD and APP/PS1 mice with semaglutide or vehicle treatment. (A–D) Open Field test. The percentage of time spent in center area of the arena of vehicle- or semaglutide (25 nmol/kg)-treated 5XFAD (A, B) and APP/PS1 (C, D) female (♀) and male (♂) mice. (E–L) Novel Object Recognition test was performed to assess exploratory behavior and recognition memory. (E–H) The percentage of exploration time on the novel object of vehicle- or semaglutide (25 nmol/kg)-treated 5XFAD (E, F) and APP/PS1 (G, H) mice. (I–L) The discrimination index, defined by the time spent investigating the novel object over the total object exploration time, of vehicle- or semaglutide (25 nmol/kg)-treated 5XFAD (I, J) and APP/PS1 (K, L) mice. (M–P) Morris Water Maze (Training days). Daily latency time to reach the platform during the 4-day trial acquisition task (training) of vehicle- or semaglutide (25 nmol/kg)-treated 5XFAD (M, N) and APP/PS1 (O, P) female (♀) and male (♂) mice. (Q–X) Morris Water Maze (Probe test day). Latency time to the target quadrant on Probe test day (Day 5) of vehicle- or semaglutide (25 nmol/kg)-treated 5XFAD (Q, R) and APP/PS1 (S, T) mice. The number of crossings on the target quadrant of vehicle- or semaglutide (25 nmol/kg)-treated 5XFAD (U, V) and APP/PS1 (W, X) mice. Data on (M–P) were analyzed by 2-way ANOVA with Sidak's post-hoc test comparison, and on (A-L, Q-X) by Mann–Whitney U test, or unpaired, two-tailed Student's t test. ∗p < 0.05 vehicle- vs. semaglutide-treated mice. Data are represented as means ± SD (A-H, M-X), or as box-and-whisker plots (I–L). Dashed lines in panels M–P indicate the time range (longest and shortest time) required to reach the platform over the 4-day training period. n = 5–11 in each group of vehicle (Veh)- or semaglutide (Sema)-treated mice.
Figure 5
Figure 5
Metabolic characterization of 6-month-old wildtype and 5XFAD mice treated with semaglutide or tirzepatide. The percentage of body weight change from baseline of regular chow diet-fed 6-month-old female (♀) and male (♂) WT (A, C) and 5XFAD (B, D) mice. Mice were treated with weekly incremental doses of semaglutide (10, 17, 25 nmol/kg), or tirzepatide (2.5, 5, 10 nmol/kg) as indicated in Supplemental Figure 5. (E, F) Glucose excursions following an i.p. glucose challenge in regular chow diet-fed 6-month-old 5XFAD and WT-matched female (E) and male (F) mice treated with semaglutide (25 nmol/kg), tirzepatide (10 nmol/kg), or vehicle (saline). Inset graphs represent the Area Under the Curve (AUC) of the blood glucose excursions. (G–J) Body composition assessed by EchoMRI. Fat mass normalized by body weight of vehicle-, semaglutide (25 nmol/kg)-, or tirzepatide (10 nmol/kg)-treated 5XFAD and WT-matched female (G) and male (H) mice. Lean mass normalized by body weight of vehicle-, semaglutide (25 nmol/kg)-, or tirzepatide (10 nmol/kg)-treated 5XFAD and WT-matched female (I) and male (J) mice. Data were analyzed by 2-way ANOVA with Tukey's post-hoc test for comparison of vehicle vs. treatment. ∗p < 0.05, ∗∗∗p < 0.001, ∗∗∗∗p < 0.0001 vehicle vs. treatment. Data are represented as means ± SEM (A–D), or as means ± SD (E-J and AUCs). n = 5–10 in each group of vehicle (Veh)-, semaglutide (Sema)-, or tirzepatide (TZP)-treated mice.
Figure 6
Figure 6
Semaglutide and tirzepatide do not alter amyloid beta content in 6-month-old 5XFAD mice. (A, B) Representative images of (A) the cerebral cortex (Cortex) and (B) the hippocampus (Hippo) and subiculum (Sub) brain regions of 5XFAD mice. Right panels in (A) represent magnification of the area of the cerebral cortex highlighted in the left panels. Scale bars in (A) represent 100 μm (left panels) and 10 μm (right panels); scale bar in (B) represents 50 μm. Quantification of plaque intensity in the cerebral cortex (C, D), hippocampus (E, F) and subiculum (G, H) after Thioflavin S staining in 6-month-old 5XFAD and WT-matched female (♀) and male (♂) mice treated with semaglutide (25 nmol/kg), tirzepatide (10 nmol/kg), or vehicle (saline). Data are represented as means ± SD. n = 5–11 in each group of vehicle (Veh)-, semaglutide (Sema)-, or tirzepatide (TZP)-treated mice.
Figure 7
Figure 7
Memory performance tests in 6-month-old 5XFAD mice. (A–D) Open Field Test. Locomotory activity was evaluated by an Open Field test in 6-month-old female (♀, A) and male (♂, B) 5XFAD mice treated with semaglutide (25 nmol/kg), tirzepatide (10 nmol/kg), or vehicle (saline). The percentage of time spent in the center area of the arena for female (C) and male (D) 5XFAD mice. (E–H) Novel Object Recognition tests were performed to assess exploratory behavior and recognition memory. The percentage of exploration time spent on the novel object for 6-month-old female (E) and male (F) 5XFAD mice treated with semaglutide (25 nmol/kg), tirzepatide (10 nmol/kg), or vehicle (saline). The discrimination index, defined by the difference of the time spent exploring the novel object over the total object exploration time, of female (G) and male (H) 5XFAD mice. (I–J) Morris Water Maze (Training days). Daily latency time to reach the platform during the 4-day trial acquisition task (training) of 6-month-old female (I) and male (J) 5XFAD mice treated with semaglutide (25 nmol/kg), tirzepatide (10 nmol/kg), or vehicle (saline). (K–N) Morris Water Maze (Probe test day). Latency to the target quadrant (K, L) and number of crossings on the target quadrant (M, N) on Probe test day (Day 5) of 6-month-old female (K, M) and male (L, N) 5XFAD mice treated with semaglutide (25 nmol/kg), tirzepatide (10 nmol/kg), or vehicle (saline). Data for (A, B, I, J) were analyzed by 2-way ANOVA with Sidak's post-hoc test, and for (C–H, K–N) by Mann–Whitney U test, or unpaired, two-tailed Student's t test for comparison between vehicle- and semaglutide- or tirzepatide-treated mice. ∗p < 0.05, ∗∗p < 0.01 vehicle vs. treatment. Data are represented as means ± SD (A-F, I–N), or as box-and-whisker plots (G, H) of female (♀) and male (♂) mice as indicated. Dashed lines in panels I–J indicate the time range (longest and shortest times) required to reach the platform over the 4-day training period. n = 6–10 in each group of vehicle (Veh)-, semaglutide (Sema)-, or tirzepatide (TZP)-treated mice.
Figure 8
Figure 8
Semaglutide and tirzepatide do not reduce the number of activated microglia or reactive astroglia, or attenuate dysregulated gene expression related to neurodegeneration in the hippocampus of 6-month-old 5XFAD mice. (A) Representative images of IBA1+ cells (green), GFAP+ cells (red), or co-stained with both IBA1 and GFAP antibodies (bottom panel) in the hippocampus (Hippo) or subiculum (Sub) of 6-month-old WT and 5XFAD mice treated with semaglutide (25 nmol/kg), tirzepatide (10 nmol/kg), or vehicle (saline). Scale bars represent 300 μm. Areas of interest are encircled by dashed lines. (B–E) Quantification of the number of IBA1+ cells per area (B, C) and the number of GFAP+ cells per area (D, E) in the hippocampus of female (♀) and male (♂) WT and 5XFAD mice. (F–M) Quantitative PCR analysis of transcript levels of Trem2 (F), Tyrobp (G), Clec7a (H), Cd68 (I), Ccl2 (J), Cxcl10 (K), Gfap (L) and Il1b (M) in the hippocampus of 6-month-old female (♀) and male (♂) WT and 5XFAD mice treated with semaglutide (25 nmol/kg), tirzepatide (10 nmol/kg), or vehicle (saline). Ppia was used as a reference gene for normalization. Data for (F–M) were analyzed by 2-way ANOVA with Sidak's post-hoc test for comparison of vehicle vs. treatment and for (B–E) by 1-way ANOVA with Tukey's post-hoc test. #p < 0.05, ##p < 0.01 ###p < 0.001, ####p < 0.0001 WT vs. 5XFAD mice. Data are represented as means ± SD. n = 3–12 in each group of vehicle (Veh)-, semaglutide (Sema)-, or tirzepatide (TZP)-treated mice.

References

    1. Campbell J.E., Drucker D.J. Pharmacology physiology and mechanisms of incretin hormone action. Cell Metabol. 2013;17(4):819–837. - PubMed
    1. Drucker D.J. Prevention of cardiorenal complications in people with type 2 diabetes and obesity. Cell Metabol. 2024;36(2):338–353. - PubMed
    1. Campbell J.E., Muller T.D., Finan B., DiMarchi R.D., Tschop M.H., D'Alessio D.A. GIPR/GLP-1R dual agonist therapies for diabetes and weight loss-chemistry, physiology, and clinical applications. Cell Metabol. 2023;35(9):1519–1529. - PMC - PubMed
    1. McLean B.A., Wong C.K., Campbell J.E., Hodson D.J., Trapp S., Drucker D.J. Revisiting the complexity of GLP-1 action from sites of synthesis to receptor activation. Endocr Rev. 2021;42(2):101–132. - PMC - PubMed
    1. Kosiborod M.N., Abildstrom S.Z., Borlaug B.A., Butler J., Rasmussen S., Davies M., et al. Semaglutide in patients with heart failure with preserved ejection fraction and obesity. N Engl J Med. 2023;389(12):1069–1084. - PubMed

MeSH terms

Substances